Estrategia de dos líneas del canal de bandas de Bollinger RSI
Descripción general
Esta estrategia combina la línea de Brin con un indicador relativamente débil (RSI) y, al mismo tiempo que el indicador RSI está sobrecomprando y sobrevendido, requiere una correspondente ruptura de la línea de Brin en la parte superior y inferior de la trayectoria, lo que hace que la señal de negociación de esta estrategia sea más rigurosa y confiable.
Principio de estrategia
- Utilizando la línea de Brin, se calcula la línea media, la línea superior y la línea inferior de acuerdo con el precio de cierre de los últimos n días.
- Calcula el RSI para determinar si el mercado está demasiado optimista o demasiado optimista.
- Solo se puede hacer una operación de corto plazo cuando el indicador RSI muestra un exceso de compra (por encima del parámetro rsi_overbought) y el precio rompe la vía de la línea de Brin.
- Solo se puede realizar una operación de más de un lado cuando el indicador RSI muestra un exceso de venta (< el parámetro rsi_oversold) y el precio rompe la línea de subida de Brin.
De esta manera, la estrategia utiliza al mismo tiempo las características de los canales de las líneas de Brin y las señales de sobreventa y sobreventa del indicador RSI, evitando errores de juicio en un solo indicador, y es más confiable.
Ventajas estratégicas
- Utiliza las ventajas de la línea de Brin combinadas con el indicador RSI para un juicio más riguroso y evitar errores.
- La línea de Bryn establece un canal dinámico que permite entender las leyes de la fluctuación del mercado.
- El RSI es un indicador de compras y ventas en exceso, que evita la caída y la subida.
Riesgo estratégico
- Si los parámetros de la línea de Brin se establecen incorrectamente, la subida y la bajada de la vía no pueden envolver el precio de manera efectiva.
- Si el parámetro RSI está mal configurado, no se puede juzgar eficazmente la verdadera situación de sobrecompra y sobreventa.
- La estrategia por sí sola no puede determinar la dirección de la tendencia, y debe utilizarse junto con otros indicadores.
Para responder a estos riesgos, se deben optimizar los parámetros, probar rigurosamente los modelos y evaluar las tendencias generales con otros indicadores.
Dirección de optimización de la estrategia
- Prueba la línea de Bryn de diferentes parámetros de ciclo para encontrar el parámetro de ciclo óptimo.
- Prueba diferentes parámetros del RSI para determinar los mejores.
- Se pueden agregar otros indicadores, como la media móvil, para determinar la tendencia general.
Resumir
Esta estrategia combina con éxito las ventajas de la línea de Brin y el indicador RSI para emitir órdenes de negociación cuando aparecen señales simultáneas, lo que evita los errores de juicio de un solo indicador y hace que el comercio sea más confiable. Al mismo tiempo, optimiza los parámetros, realiza pruebas rigurosas y juzga las tendencias generales con otros indicadores, lo que mejora aún más la estabilidad y la rentabilidad de la estrategia.
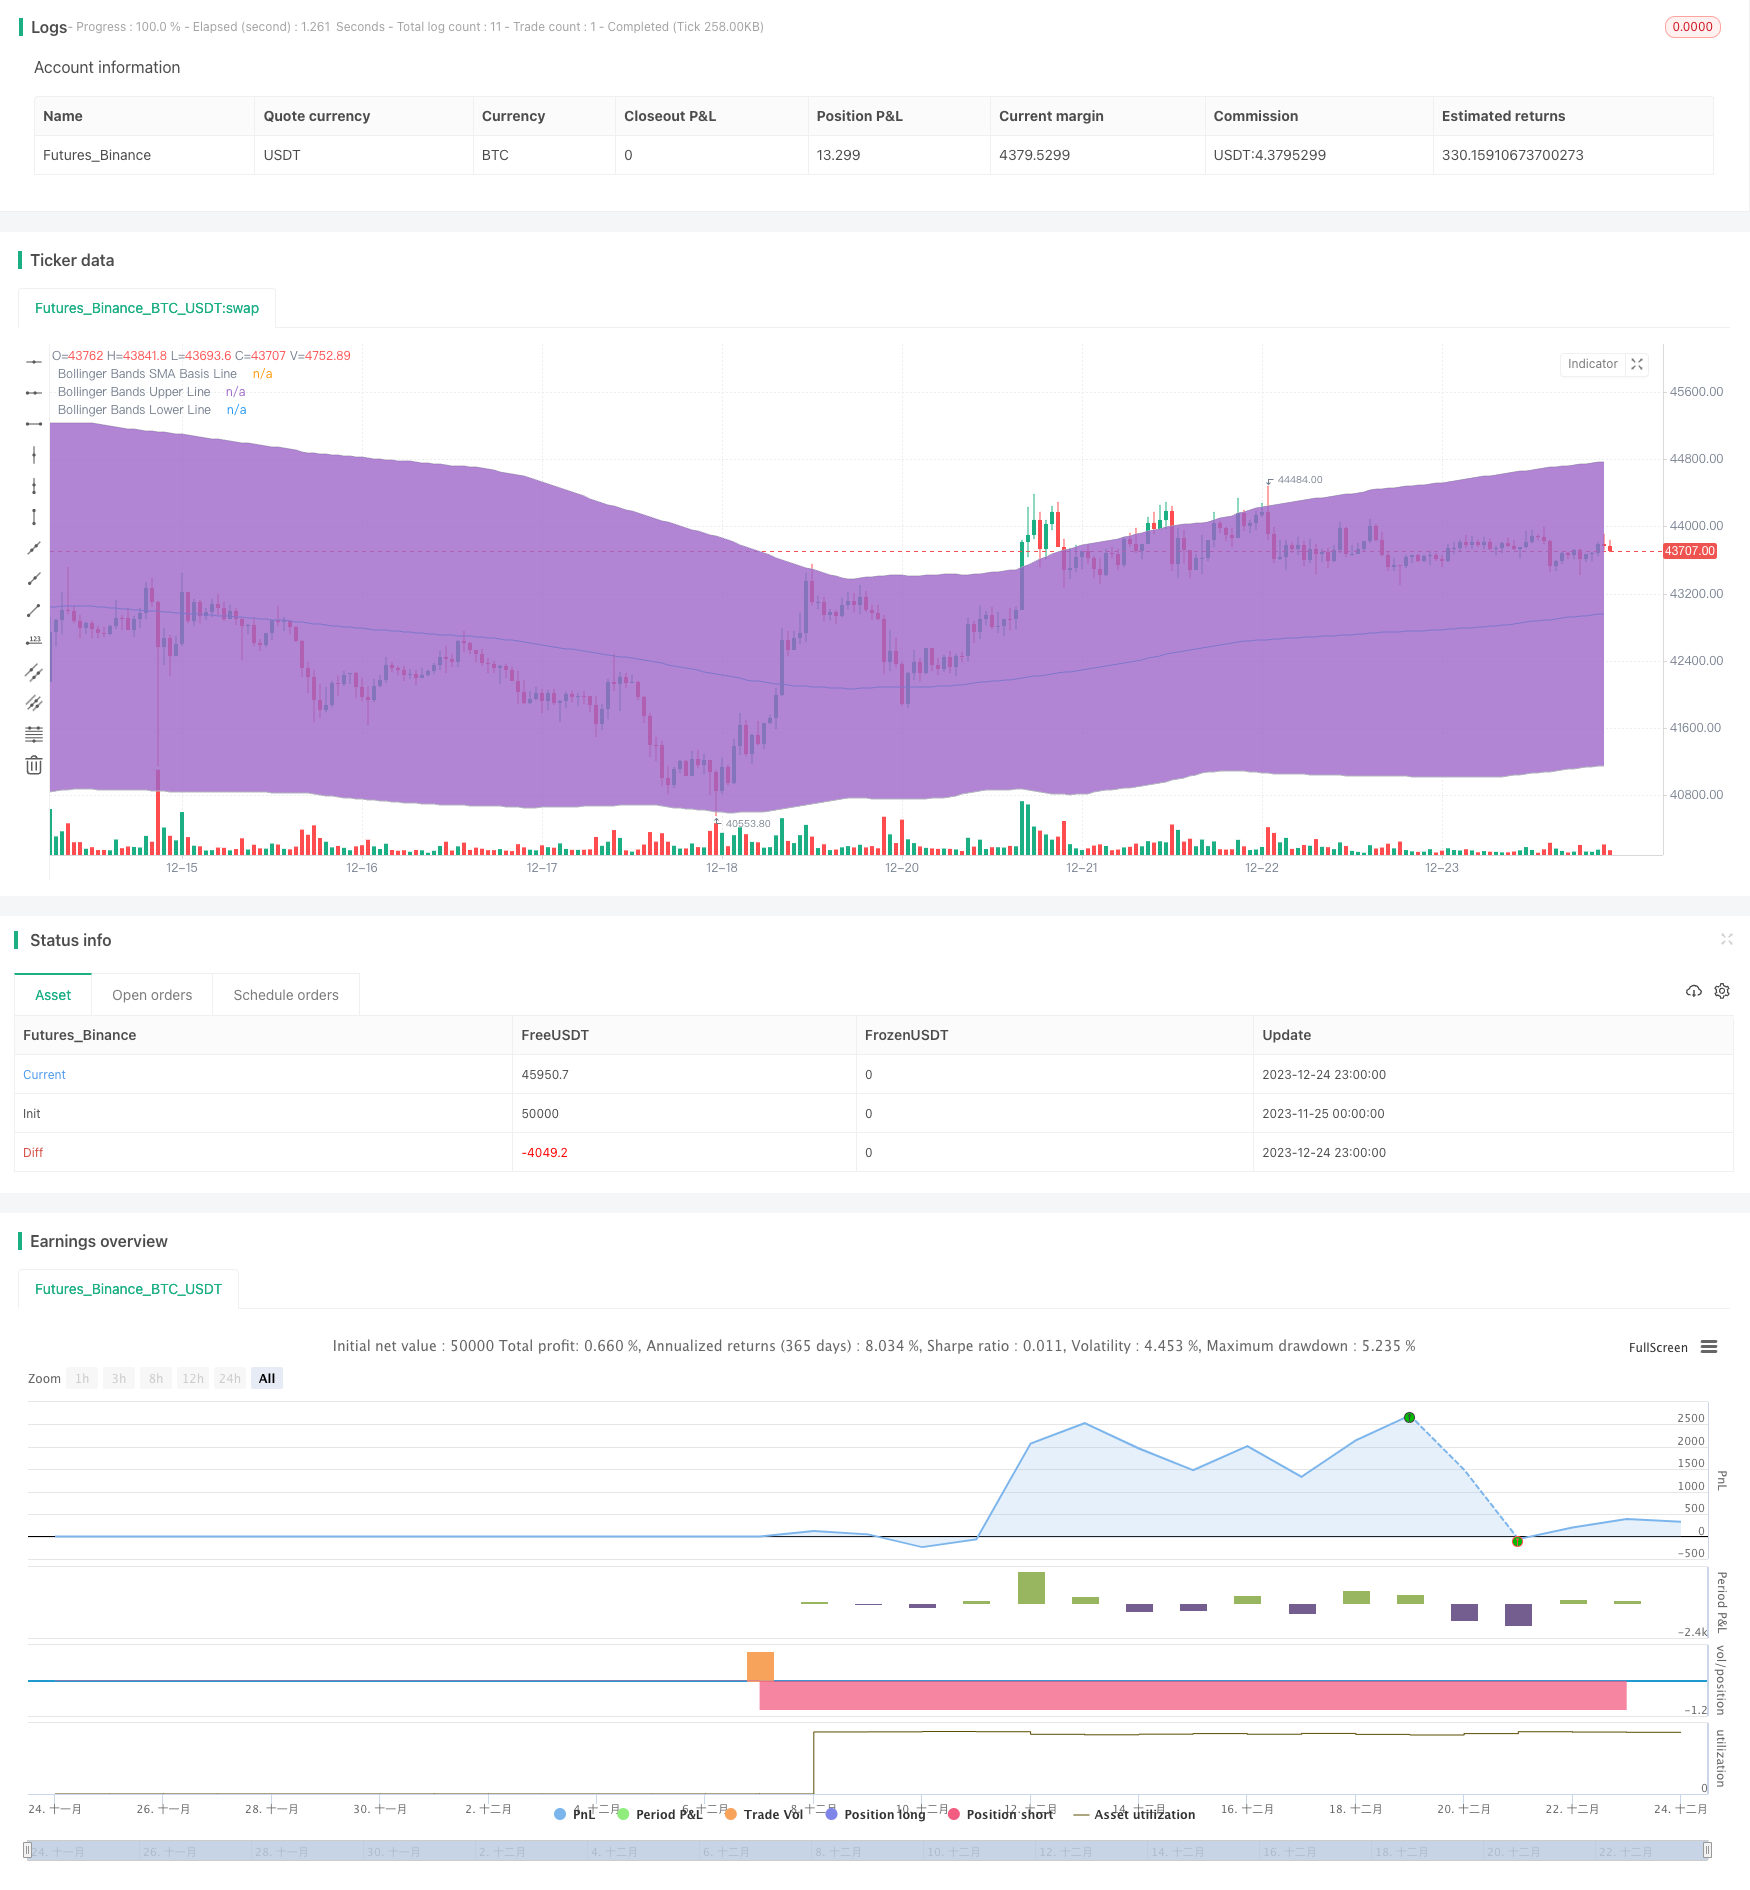
/*backtest
start: 2023-11-25 00:00:00
end: 2023-12-25 00:00:00
period: 1h
basePeriod: 15m
exchanges: [{"eid":"Futures_Binance","currency":"BTC_USDT"}]
*/

//@version=2
strategy("Bollinger + RSI, Double Strategy (by ChartArt) v1.1", shorttitle="CA_-_RSI_Bol_Strat_1.1", overlay=true)

// ChartArt's RSI + Bollinger Bands, Double Strategy - Update
//
// Version 1.1
// Idea by ChartArt on January 18, 2015.
//
// This strategy uses the RSI indicator
// together with the Bollinger Bands
// to sell when the price is above the
// upper Bollinger Band (and to buy when
// this value is below the lower band).
//
// This simple strategy only triggers when
// both the RSI and the Bollinger Bands
// indicators are at the same time in
// a overbought or oversold condition.
//
// In this version 1.1 the strategy was
// both simplified for the user and
// made more successful in backtesting.
//
// List of my work:
// https://www.tradingview.com/u/ChartArt/
//
//  __             __  ___       __  ___
// /  ` |__|  /\  |__)  |   /\  |__)  |
// \__, |  | /~~\ |  \  |  /~~\ |  \  |
//
//


///////////// RSI
RSIlength = input(6,title="RSI Period Length")
RSIoverSold = 50
RSIoverBought = 50
price = close
vrsi = rsi(price, RSIlength)


///////////// Bollinger Bands
BBlength = input(200, minval=1,title="Bollinger Period Length")
BBmult = 2 // input(2.0, minval=0.001, maxval=50,title="Bollinger Bands Standard Deviation")
BBbasis = sma(price, BBlength)
BBdev = BBmult * stdev(price, BBlength)
BBupper = BBbasis + BBdev
BBlower = BBbasis - BBdev
source = close
buyEntry = crossover(source, BBlower)
sellEntry = crossunder(source, BBupper)
plot(BBbasis, color=aqua,title="Bollinger Bands SMA Basis Line")
p1 = plot(BBupper, color=silver,title="Bollinger Bands Upper Line")
p2 = plot(BBlower, color=silver,title="Bollinger Bands Lower Line")
fill(p1, p2)


///////////// Colors
switch1=input(true, title="Enable Bar Color?")
switch2=input(true, title="Enable Background Color?")
TrendColor = RSIoverBought and (price[1] > BBupper and price < BBupper) and BBbasis < BBbasis[1] ? red : RSIoverSold and (price[1] < BBlower and price > BBlower) and BBbasis > BBbasis[1] ? green : na
barcolor(switch1?TrendColor:na)
bgcolor(switch2?TrendColor:na,transp=50)


///////////// RSI + Bollinger Bands Strategy
if (not na(vrsi))

    if (crossover(vrsi, RSIoverSold) and crossover(source, BBlower))
        strategy.entry("RSI_BB_L", strategy.long, stop=BBlower,  comment="RSI_BB_L")
    else
        strategy.cancel(id="RSI_BB_L")

    if (crossunder(vrsi, RSIoverBought) and crossunder(source, BBupper))
        strategy.entry("RSI_BB_S", strategy.short, stop=BBupper,  comment="RSI_BB_S")
    else
        strategy.cancel(id="RSI_BB_S")

//plot(strategy.equity, title="equity", color=red, linewidth=2, style=areabr)