Estrategia de seguimiento de supertendencias
Descripción general
La estrategia es una estrategia de seguimiento de supertrends, la idea principal es la combinación de indicadores de supertrends con diferentes configuraciones de parámetros para lograr el efecto de seguimiento y el uso de indicadores de filtro para el control de riesgo. La idea central de la estrategia es simple, práctica, fácil de entender y adecuada para el aprendizaje de los principiantes.
Principio de estrategia
Esta estrategia se compone principalmente de tres grupos de indicadores de tendencia de la super tendencia con diferentes parámetros. El primer grupo de indicadores de tendencia de la super tendencia principal adopta los parámetros predeterminados para determinar la dirección de la tendencia del mercado. El segundo grupo de indicadores de tendencia de la super tendencia secundaria permite un seguimiento más sensible de los cambios en los precios mediante la reducción del ciclo de ATR y el aumento del múltiplo de ATR.
Cuando la tendencia principal emite una señal de compra, la estrategia toma una compra de seguimiento si la tendencia secundaria también emite una señal de compra simultánea y la dirección de la tendencia principal es ascendente; cuando la tendencia principal emite una señal de venta, la estrategia toma una venta de seguimiento si la tendencia secundaria también emite una señal de venta simultánea y la dirección de la tendencia principal es descendente. De esta manera, se puede garantizar la captura de la tendencia principal, al mismo tiempo que se utiliza el indicador de la tendencia secundaria para rastrear de manera sensible los ajustes mínimos, para que se realice una entrada y un parada en el tiempo.
Ventajas estratégicas
- Las estrategias son sencillas, claras y fáciles de entender, adecuadas para los principiantes.
- La configuración de los parámetros de la estrategia es razonable para rastrear el comportamiento y controlar el riesgo de manera efectiva
- Las señales estratégicas son más precisas y confiables, y tienen una mayor probabilidad de éxito.
- Combinación de diferentes combinaciones de parámetros para lograr un efecto de seguimiento
- Mecanismo de filtrado agregado para filtrar eficazmente las señales de falsedad y controlar el riesgo
Riesgo estratégico
- El riesgo sistémico de las acciones mismas
- El indicador de tendencias súper puede generar un retraso en algunos mercados
- La configuración incorrecta de los parámetros en el indicador ATR puede causar un desvío en la señal de la estrategia
- La falta de volumen de operaciones estratégicas puede dificultar el cierre de todas las posiciones
Las principales medidas de prevención de riesgos:
- Opte por acciones con buena liquidez y mucha volatilidad
- Optimización adecuada de los parámetros para reducir el posible retraso
- Optimización de pruebas de parámetros para mejorar la precisión de la señal
- Aumentar adecuadamente el volumen de transacciones para asegurar el espacio para detener el daño
Dirección de optimización de la estrategia
- Prueba de diferentes combinaciones de parámetros de ciclo ATR para optimizar el seguimiento
- Intentar otros indicadores de volatilidad en lugar del ATR
- Aumentar o disminuir el número de combinaciones de tendencias súper, prueba de efecto
- Intentar optimizar la filtración de la señal junto con otros indicadores
- Prueba de diferentes formas de detener los daños para encontrar la mejor solución
Resumir
La idea general de esta estrategia es clara y simple, mediante el conjunto de indicadores de tendencia súper diferentes configuraciones de parámetros de cooperación entre sí, para lograr el seguimiento de la entrada y el control de riesgo. La señal de la estrategia es más precisa, el rendimiento en el disco es mejor, es adecuado para el aprendizaje de los principiantes, también puede utilizarse como una plantilla para la optimización de pruebas de diversos indicadores y parámetros, es una estrategia de tendencia súper recomendable.
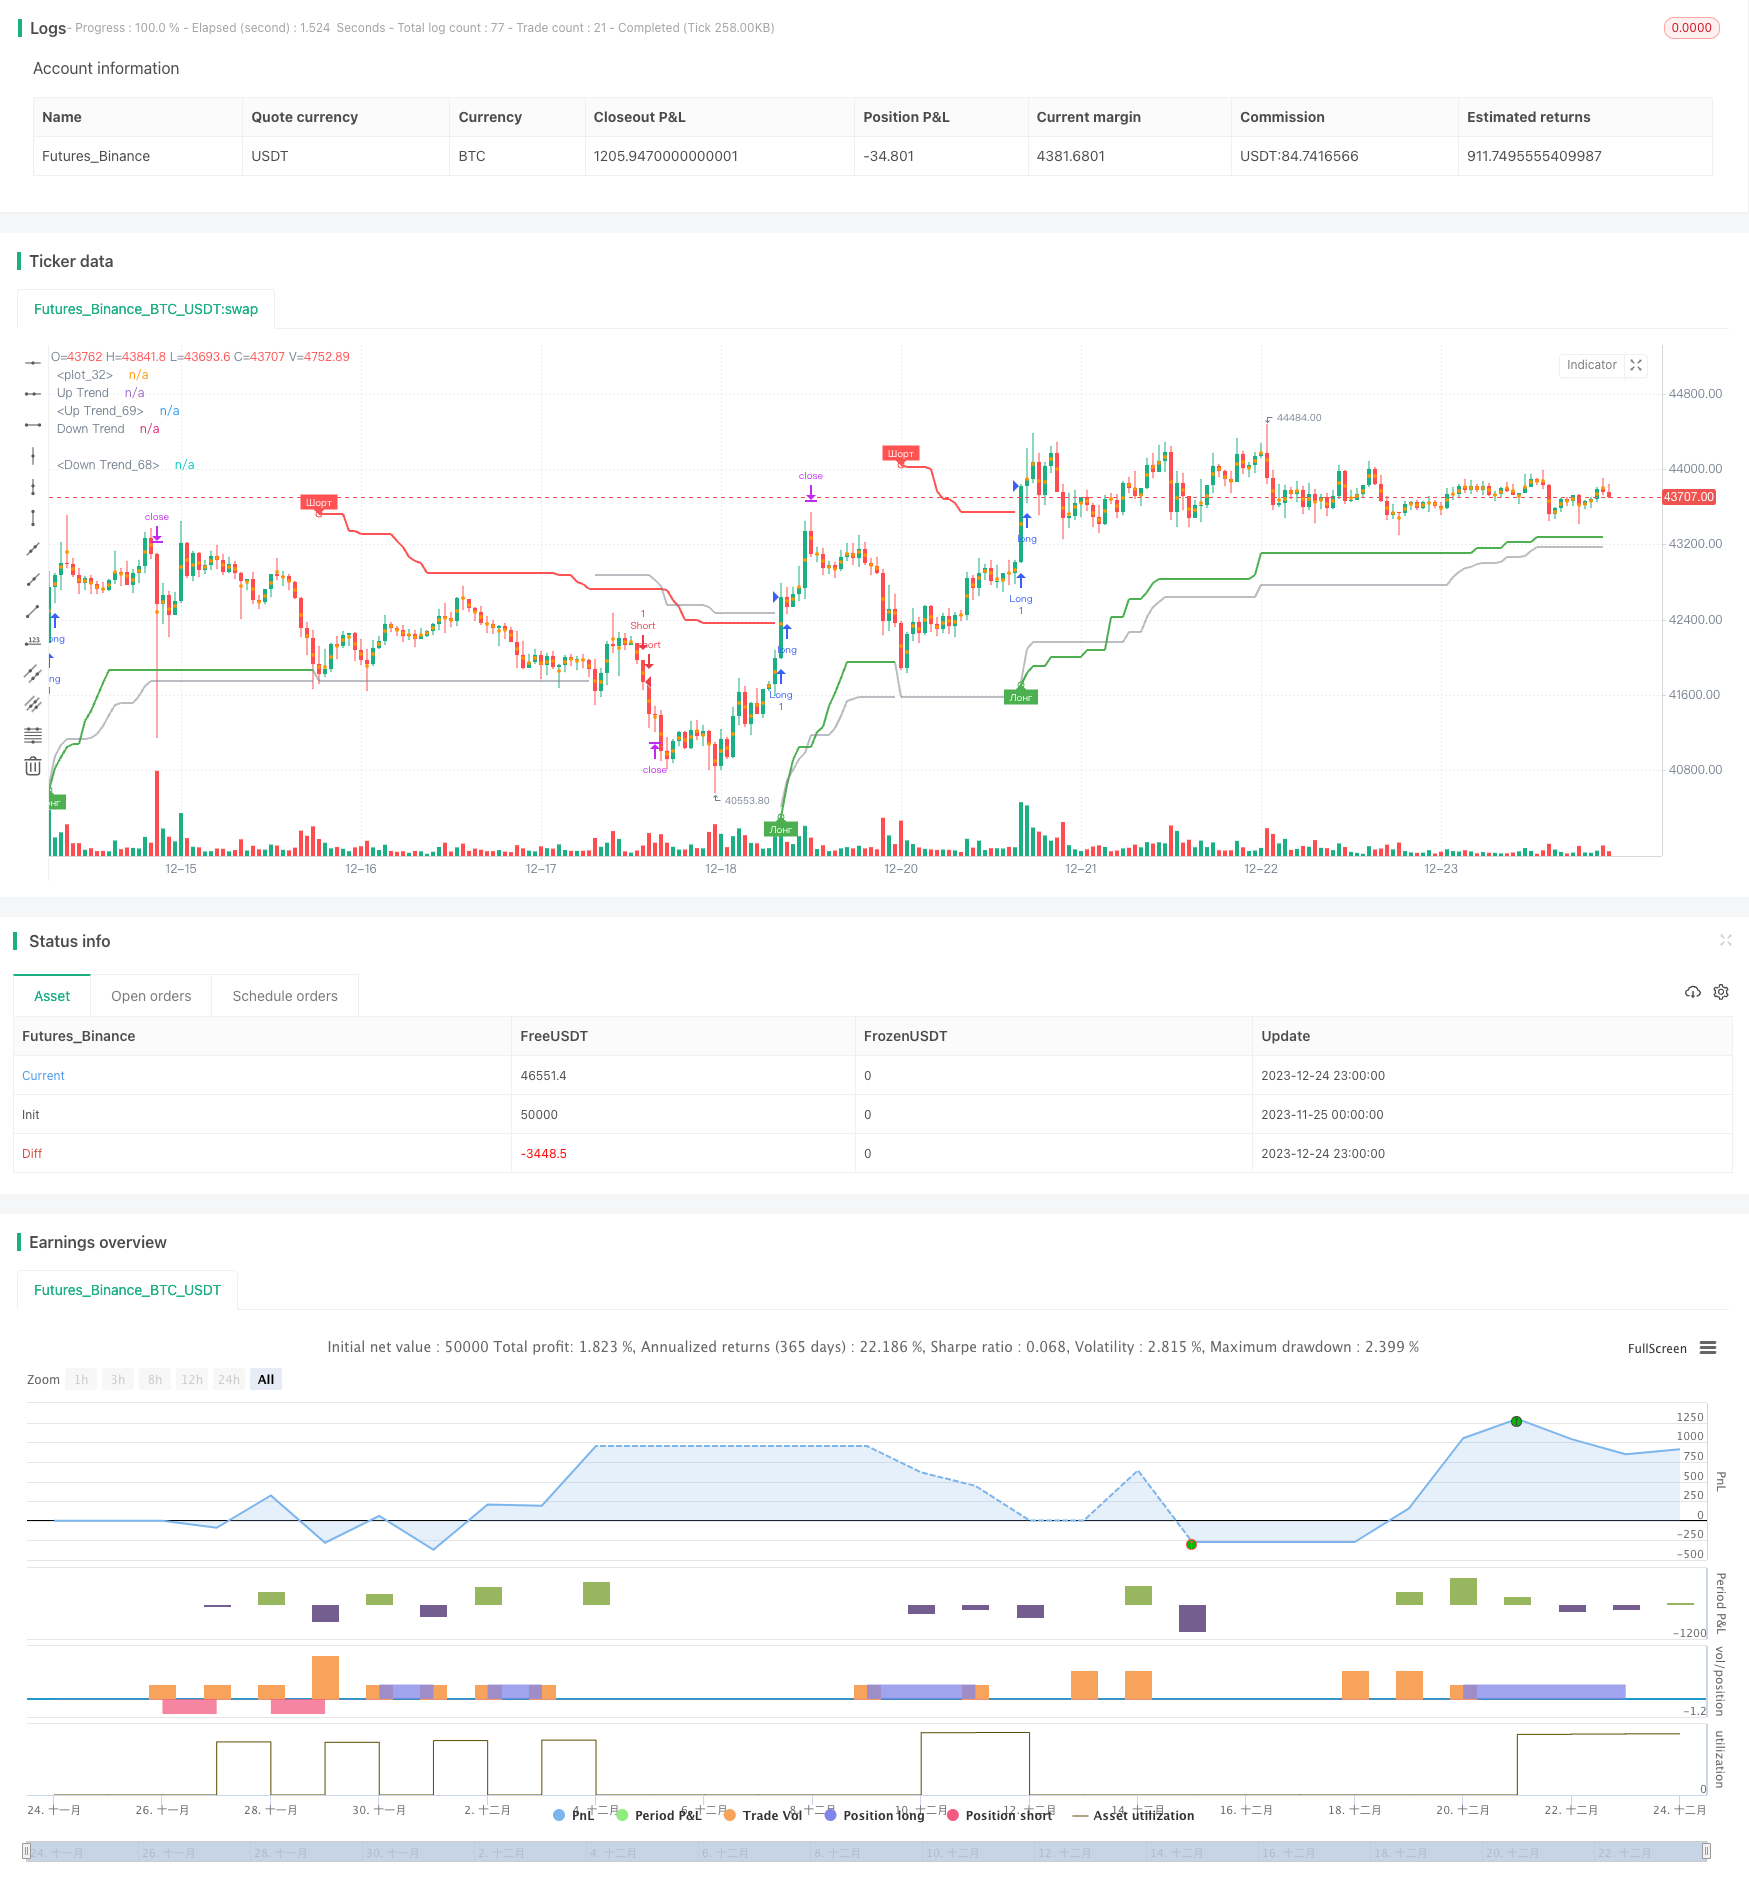
/*backtest
start: 2023-11-25 00:00:00
end: 2023-12-25 00:00:00
period: 1h
basePeriod: 15m
exchanges: [{"eid":"Futures_Binance","currency":"BTC_USDT"}]
*/

//@version=4
strategy("Supertrend TEST 2 Strategy", overlay = true, format=format.price, precision=2)

Periods = input(title="ATR Period", type=input.integer, defval=4)
src = input(hl2, title="Source")
Multiplier = input(title="ATR Multiplier", type=input.float, step=0.1, defval=4.7)
changeATR= input(title="Change ATR Calculation Method ?", type=input.bool, defval=true)
showsignals = input(title="Show Buy/Sell Signals ?", type=input.bool, defval=true)
highlighting = input(title="Highlighter On/Off ?", type=input.bool, defval=true)
tp=close
sl=close

atr2 = sma(tr, Periods)
atr= changeATR ? atr(Periods) : atr2
up=src-(Multiplier*atr)
up1 = nz(up[1],up)
up := close[1] > up1 ? max(up,up1) : up
dn=src+(Multiplier*atr)
dn1 = nz(dn[1], dn)
dn := close[1] < dn1 ? min(dn, dn1) : dn
trend = 1
trend := nz(trend[1], trend)
trend := trend == -1 and close > dn1 ? 1 : trend == 1 and close < up1 ? -1 : trend
upPlot = plot(trend == 1 ? up : na, title="Up Trend", style=plot.style_linebr, linewidth=2, color=color.green)
buySignal = trend == 1 and trend[1] == -1
plotshape(buySignal ? up : na, title="UpTrend Begins", location=location.absolute, style=shape.circle, size=size.tiny, color=color.green )
plotshape(buySignal and showsignals ? up : na, title="Лонг", text="Лонг", location=location.absolute, style=shape.labelup, size=size.tiny, color=color.green, textcolor=color.white )
dnPlot = plot(trend == 1 ? na : dn, title="Down Trend", style=plot.style_linebr, linewidth=2, color=color.red)
sellSignal = trend == -1 and trend[1] == 1
plotshape(sellSignal ? dn : na, title="DownTrend Begins", location=location.absolute, style=shape.circle, size=size.tiny, color=color.red )
plotshape(sellSignal and showsignals ? dn : na, title="Шорт", text="Шорт", location=location.absolute, style=shape.labeldown, size=size.tiny, color=color.red, textcolor=color.white )
mPlot = plot(ohlc4, title="", style=plot.style_circles, linewidth=0)
longFillColor = highlighting ? (trend == 1 ? color.green : color.white) : color.white
shortFillColor = highlighting ? (trend == -1 ? color.red : color.white) : color.white

sPeriods=input(title="ATR Period", type=input.integer, defval=8)
sMultiplier=input(title="dop ATR Multiplier", type=input.float, step=0.1, defval=1.5)
satr2 = sma(tr, sPeriods)
satr= changeATR ? atr(sPeriods) : satr2
ssup=ohlc4-(sMultiplier*satr)
ssup1 = nz(ssup[1],ssup)
ssup := close[1] > ssup1 ? max(ssup,ssup1) : ssup
sdn=ohlc4+(sMultiplier*satr)
sdn1 = nz(sdn[1], sdn)
sdn := close[1] < sdn1 ? min(sdn, sdn1) : sdn
strend = 1
strend := nz(strend[1], strend)
strend := strend == -1 and close > sdn1 ? 1 : strend == 1 and close < ssup1 ? -1 : strend
sbuySignal = strend == 1 and strend[1] == -1
ssellSignal = strend == -1 and strend[1] == 1

fPeriods=input(title="ATR Period", type=input.integer, defval=10)
fMultiplier=input(title="filter ATR Multiplier", type=input.float, step=0.1, defval=5)
fatr2 = sma(tr, fPeriods)
fatr= changeATR ? atr(fPeriods) : fatr2
fup=ohlc4-(fMultiplier*fatr)
fup1 = nz(fup[1],fup)
fup := close[1] > fup1 ? max(fup,fup1) : fup
fdn=ohlc4+(fMultiplier*fatr)
fdn1 = nz(fdn[1], fdn)
fdn := close[1] < fdn1 ? min(fdn, fdn1) : fdn
ftrend = 1
ftrend := nz(ftrend[1], ftrend)
ftrend := ftrend == -1 and close > fdn1 ? 1 : ftrend == 1 and close < fup1 ? -1 : ftrend
fbuySignal = ftrend == 1 and ftrend[1] == -1
fsellSignal = ftrend == -1 and ftrend[1] == 1
tcolor=color.new(color.gray,50)
fdnPlot = plot(ftrend == 1 ? na : fdn, title="Down Trend", style=plot.style_linebr, linewidth=2, color=tcolor)
fupPlot = plot(ftrend == 1 ? fup : na, title="Up Trend", style=plot.style_linebr, linewidth=2, color=tcolor)


if (strategy.position_size > 0)
	tp:=tp[1]
	sl:=up
	strategy.exit("Long_TP/SL","Long",limit=tp, stop=sl)

if (strategy.position_size < 0)
	tp:=tp[1]
	sl:=dn
	strategy.exit("Short_TP/SL","Short",limit=tp, stop=sl)


if ((buySignal and  ftrend==1) or (sbuySignal and trend==1 and  ftrend==1))
	tp:=close+(close-up)*0.382
    strategy.entry("Long", strategy.long,  limit=tp, comment=tostring(round(tp)))
if ((sellSignal and ftrend==-1) or (ssellSignal and trend==-1 and  ftrend==-1))
	tp:=close-(dn-close)*0.382
    strategy.entry("Short", strategy.short, limit=tp, comment=tostring(round(tp)))