Estrategia de tendencia cuantitativa de JBravo
Descripción general de la estrategia
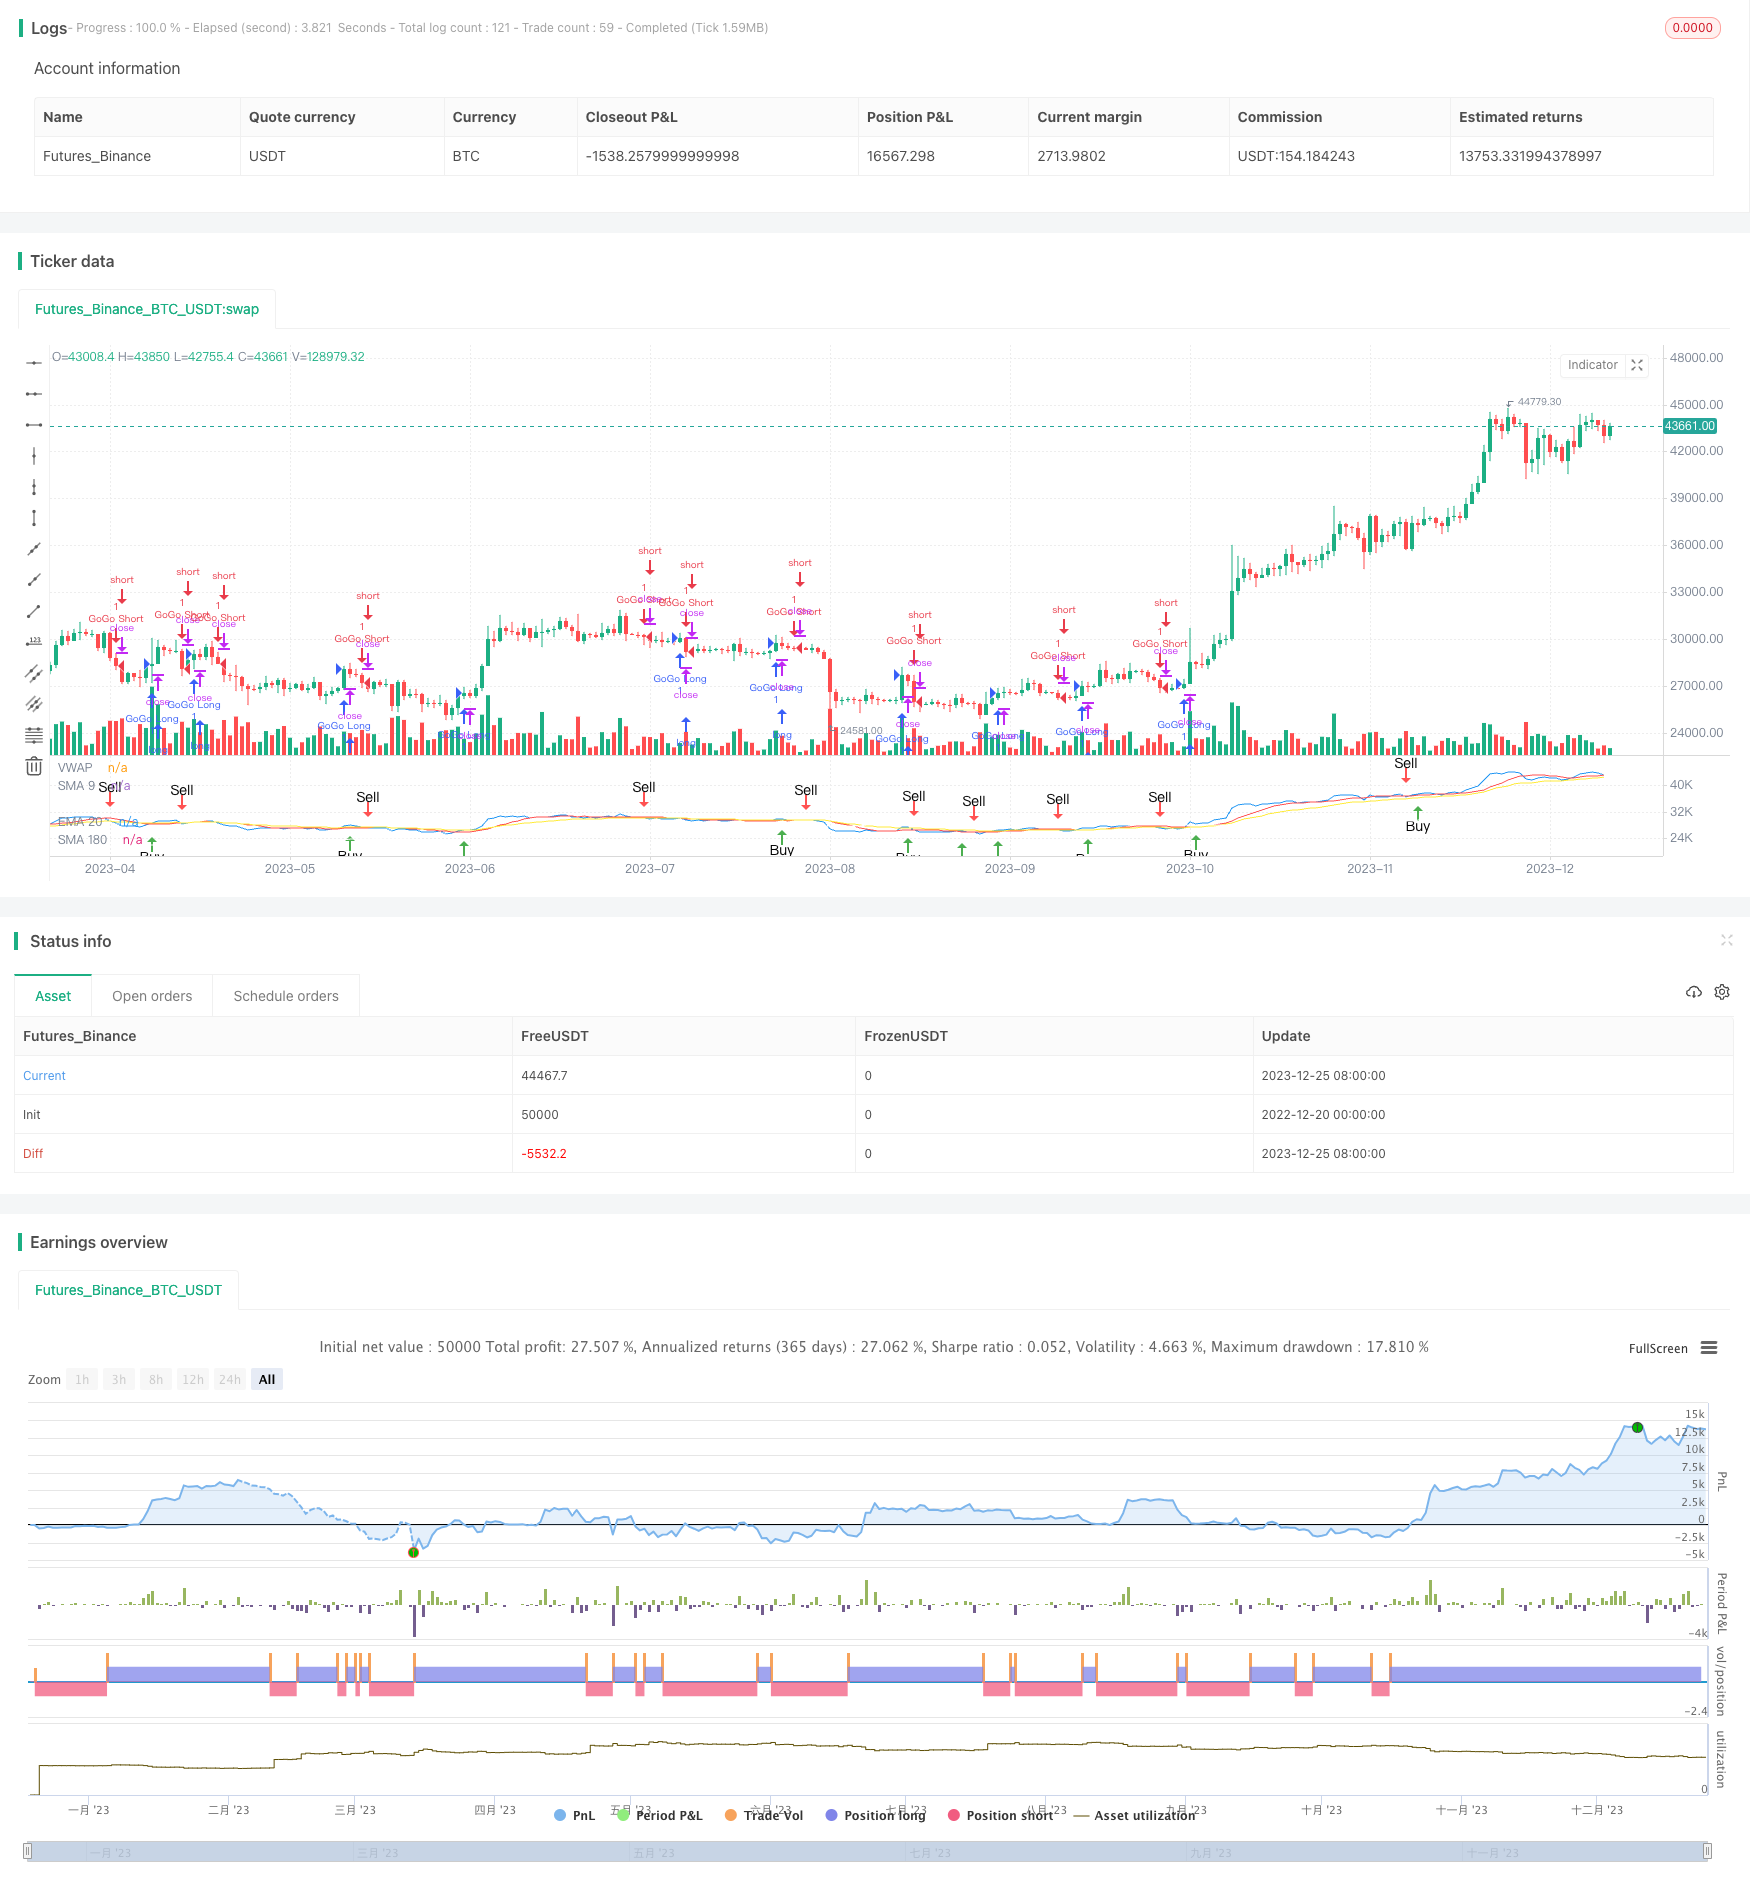
La estrategia de tendencia cuantitativa de JBravo es una estrategia de seguimiento de tendencias basada en promedios móviles. Utiliza las medias móviles simples de 9 días, las medias móviles de 20 días y las medias móviles simples de 180 días para juzgar la dirección de la tendencia del mercado y las señales finales de compra y venta.
El nombre de la estrategia se inspira en el personaje animado de Johnny Bravo, que representa una decisión de negociación segura y decisiva. El término “GoGo juice” describe la entrada en escena cuando la línea VWAP atraviesa la media móvil de 20 días.
Principio de estrategia
Cuando una línea K se cierra en el precio a través de una media móvil simple de 9 días, genera una señal de compra; cuando el precio de cierre se cierra en el precio a través de una media móvil de 20 días, genera una señal de venta.
Si las medias móviles de los días 9, 20 y 180 están todas hacia arriba, y la media móvil del día 9 es superior a la media móvil del día 20, la media móvil del día 20 es superior a la media móvil del día 180, se genera una fuerte señal de compra.
Si las medias móviles de los días 9, 20 y 180 están todas hacia abajo, y la media móvil del día 9 está por debajo de la media móvil del día 20, la media móvil del día 20 está por debajo de la media móvil del día 180, se genera una fuerte señal de venta.
Cuando la línea de precios de media ponderada de transacción cruza la media móvil de 20 días del índice desde abajo, se produce una señal de baja de Go Go; cuando la línea de precios de media ponderada de transacción cruza la media móvil de 20 días del índice desde arriba, se produce una señal de baja de Go Go.
Análisis de las ventajas estratégicas
La estrategia combina el seguimiento de tendencias y la estrategia de las rupturas. La media móvil permite determinar claramente la dirección de la tendencia del mercado, reduciendo la probabilidad de transacciones erróneas. Al mismo tiempo, utiliza de manera flexible el precio promedio ponderado por volumen de transacción, un indicador para determinar el momento de entrada en el mercado y controlar el riesgo al mismo tiempo que espera una ruptura en el mercado.
En comparación con el uso de medias móviles, la estrategia añade el mecanismo de entrada de GoGo, que permite obtener una mayor tasa de retribución en el mercado en situaciones de fuerza.
En general, la estrategia de retroceso es pequeña y tiene una rentabilidad estable.
Análisis de riesgos estratégicos
A pesar de que la estrategia agrega un mecanismo de entrada fuerte, los puntos de parada pueden ser activados con frecuencia en situaciones de crisis. Además, las medias móviles en sí mismas son muy retrasadas y no pueden capturar los cambios en el precio a tiempo.
Esto significa que la estrategia puede generar una cantidad de operaciones virtuales que no reflejan realmente los precios del mercado. Además, la entrada fuerte aumenta el riesgo de pérdidas.
Para reducir el riesgo, se puede ajustar adecuadamente el ciclo de las medias móviles; o agregar un módulo de stop loss para detener el retiro de pérdidas después de que las pérdidas alcancen una cierta magnitud.
Dirección de optimización de la estrategia
La estrategia puede ser optimizada en las siguientes direcciones:
Ajustar los parámetros de las medias móviles, optimizar los parámetros de los períodos y encontrar la mejor combinación de parámetros
Aumentar el conocimiento de los indicadores de volumen de transacciones para evitar señales erróneas en las fuertes fluctuaciones de precios
Aumentar el módulo de stop loss, establecer reglas de salida del campo y controlar las pérdidas individuales
La combinación de la selección de segmentos de mercado en los puntos de interés hace que la estrategia sea más específica
Optimización de la proporción de posiciones abiertas, diferentes parámetros para optimizar diferentes escalas de posiciones
Resumir
La estrategia de tendencias cuantitativas de JBravo integra el análisis de las medias móviles y el juicio de tendencias de los precios promedios ponderados por el volumen de transacciones. Busca obtener ganancias estables en las líneas largas y, al mismo tiempo, tiene un mecanismo de negociación agresivo. La estrategia es adecuada para la tenencia de líneas medias largas, el riesgo medio, etc., con una alta tasa de retorno. Se puede convertir en una parte integral de la estrategia de negociación de la cartera y tiene una buena adaptabilidad al mercado.
||
Strategy Overview
The JBravo Quantitative Trend Strategy is a trend-following strategy based on moving averages. It uses the 9-day simple moving average, 20-day exponential moving average, and 180-day simple moving average to determine the market trend direction, as well as the final buy and sell signals.
The strategy name is inspired by the cartoon character Johnny Bravo, representing a confident and decisive trading decision. The term “GoGo Juice” depicts the aggressive entry when the VWAP line crosses the 20-day exponential moving average.
Strategy Principle
A buy signal is generated when the closing price crosses above the 9-day simple moving average; A sell signal is generated when the closing price crosses below the 20-day exponential moving average.
If the 9-day, 20-day and 180-day moving averages are all moving up, and the 9-day moving average is above the 20-day moving average, the 20-day moving average is above the 180-day moving average, a strong buy signal is generated.
If the 9-day, 20-day and 180-day moving averages are all moving down, and the 9-day moving average is below the 20-day moving average, the 20-day moving average is below the 180-day moving average, a strong sell signal is generated.
When the Volume Weighted Average Price line crosses the 20-day exponential moving average upward, a “GoGo Long” signal is generated; When the Volume Weighted Average Price line crosses the 20-day exponential moving average downward, a “GoGo Short” signal is generated.
Advantage Analysis
This strategy combines the ideas of trend following and breakout strategies. Moving averages can clearly determine the direction of the market trend and reduce the probability of wrong trades. At the same time, it flexibly uses the VWAP indicator to determine the entry time, controlling risks while favoring breakthroughs in the market.
Compared to using moving averages alone, this strategy adds the aggressive entry mechanism of “GoGo Juice”, which can obtain higher returns in strong trends.
Overall, this strategy has small drawdowns and stable profitability.
Risk Analysis
Although the strategy increases the strength of entries, stop loss points can be frequently triggered in sideways markets. In addition, moving averages themselves have high inertia and cannot keep up with price changes in time.
This means that the strategy may generate a certain number of virtual trades that do not actually reflect market price movements. In addition, aggressive entries also increase the risk of losses.
To reduce risks, we can adjust the cycle of moving averages as appropriate; or add a stop loss module to stop loss when losses reach a certain level.
Optimization Directions
The strategy can be optimized in the following directions:
Adjust moving average parameters and optimize cycle parameters to find the optimal parameter combination
Add volume indicators to avoid false signals in times of violent price fluctuations
Increase stop loss modules and set exit rules to control per trade loss
Combine selections of market hot sectors to make strategies more targeted
Optimize opening position proportions, optimize different scale for different parameters
Conclusion
The JBravo Quantitative Trend Strategy integrates moving average analysis and VWAP trend judgment. It pursues stable long-term profits while having a certain degree of aggressive trading mechanisms. The strategy is suitable for medium-long term holdings, with medium-high risks and high returns. It can become a part of portfolio trading strategies with very good market adaptability.
[/trans]
/*backtest
start: 2022-12-20 00:00:00
end: 2023-12-26 00:00:00
period: 1d
basePeriod: 1h
exchanges: [{"eid":"Futures_Binance","currency":"BTC_USDT"}]
*/

// This source code is subject to the terms of the Mozilla Public License 2.0 at https://mozilla.org/MPL/2.0/
// © bradvaughn

//@version=4
strategy("JBravo Swing", overlay = false)

var buy_in_progress = false


//Moving Averages
smaInput1 = input(title="Display SMA 9", type=input.bool, defval=true)
smaInput2 = input(title="Display EMA 20", type=input.bool, defval=true)
smaInput4 = input(title="Display SMA 180", type=input.bool, defval=true)
colored_180 = input(false, title="Color-code 180 trend direction")
vwapInput = input(title="Display VWAP", type=input.bool, defval=true)

sma9 = sma(close, 9)
ema20 = ema(close, 20)
sma180 = sma(close, 180)

//Plot Moving Averages
plot(smaInput1 ? sma9 : na, color= color.red, title="SMA 9")
plot(smaInput2 ? ema20 : na, color = color.yellow, title="EMA 20")

// Plot VWAP
vwap1 = vwap(hlc3)
plot(vwapInput ? vwap1 : na, color = color.blue, title="VWAP")
vwaplong = vwap1 > ema20
vwapshort = vwap1 < ema20

//Color SMA 180 trend direction if selected
sma180_uptrend = sma(close, 180) > sma(close[2], 180)
colr = sma180_uptrend == true or colored_180 == false ? color.white : colored_180 == true ? color.gray : na
plot(smaInput4 ? sma180 : na, color = colr, title="SMA 180")

//Get value of lower end of candle
buyLow = iff(lowest(open, 1) < lowest(close, 1), lowest(open, 1), lowest(close, 1))
sellLow = lowest(close, 1)

// Find the lower MA for crossover sell condition
sellma = iff((sma9<ema20), sma9, ema20)


//SMA 9 trend direction
sma9_uptrend = sma(close, 9) > sma(close[2], 9)
//EMA 20 trend direction
ema20_uptrend = ema(close, 20) > sma(close[2], 20)

//Buy or sell if conditions are met
// Buy when the candle low is above the SMA9
// Sell when the candle low is below the lower of SMA9 and EMA20
Buy = iff(buy_in_progress == false and buyLow > sma9 == true, true, false)
Sell = iff(buy_in_progress == true and sellLow < sellma == true, true, false)

// Determine stong buy and strong sell conditions.
// If moving averages are all up, then this will qualify a buy as a strong buy.
// If the moving averages are not up (ie. down) then this will qualify a sell as a strong sell
StrongBuy = iff (Buy and sma9_uptrend and sma180_uptrend and ema20_uptrend and (sma9 > ema20) and (ema20 > sma180), true, false)
StrongSell = iff (Sell and not sma9_uptrend and not sma180_uptrend and not ema20_uptrend and (sma9 < ema20) and (ema20 < sma180), true, false)

//Update Trading status if bought or sold
if Buy
    buy_in_progress := true
if Sell
    buy_in_progress := false

// Clear Buy and Sell conditions if StrongBuy or StrongSell conditions exist.
// This disables plotting Buy and Sell conditions
if StrongBuy
    Buy := false
if StrongSell
    Sell := false


//Display BUY/SELL indicators

plotshape(Buy,title="Buy", color=color.green, style=shape.arrowup,location=location.belowbar, text="Buy")
plotshape(StrongBuy,title="Strong Buy", color=color.green, style=shape.arrowup,location=location.belowbar, text="Strong Buy")
plotshape(Sell,title="Sell", color=color.red, style=shape.arrowdown,text="Sell")
plotshape(StrongSell,title="Strong Sell", color=color.red, style=shape.arrowdown,text="Strong Sell")

strategy.entry("GoGo Long", strategy.long, 1, when=vwaplong and vwapInput)
strategy.entry("GoGo Short", strategy.short, 1, when=vwapshort and vwapInput)

strategy.close("GoGo Long", when = vwapshort and vwapInput)
strategy.close("GoGo Short", when = vwaplong and vwapInput)


alertcondition(Buy, title="Buy Signal", message="Buy")
alertcondition(Sell, title="Sell Signal", message="Sell")