Estrategias de seguimiento de tendencias basadas en múltiples indicadores
Descripción general
Esta estrategia se llamaEstrategias de seguimiento de tendencias en combinación de múltiples indicadores(Multi-Indicator Trend Tracking Strategy), que utiliza varios indicadores, como el indicador de cambio de Fisher, el promedio móvil ponderado (WMA), el indicador de fuerza relativa (RSI) y la línea de promedio (OBV), para determinar la dirección de la tendencia del mercado y realizar operaciones de seguimiento de tendencias.
Principio de estrategia
- El indicador de cambio de Fisher determina la tendencia y la intensidad del cambio de precio. Se emite una señal de negociación cuando las cuatro líneas de Fisher cambian de color al mismo tiempo.
- La WMA determina la dirección de la tendencia general. El RSI filtra las señales falsas.
- El indicador OBV se utiliza para confirmar tendencias.
Concretamente, el indicador de cambio de Fisher contiene 4 líneas de 1 doble, 2 doble, 4 doble y 8 doble. Cuando las 4 líneas se mueven hacia arriba en verde al mismo tiempo, se produce una señal de más y cuando las 4 líneas se mueven hacia abajo en rojo al mismo tiempo, se produce una señal de menos.
Análisis de las ventajas
La estrategia tiene las siguientes ventajas:
- El indicador de conversión de Fisher tiene un gran juicio, y cuando las 4 líneas de Fisher cambian de color al mismo tiempo, es muy probable que se produzca una reversión de tendencia.
- La WMA se encarga de evaluar las principales tendencias y evitar las inversiones en contra.
- El indicador OBV confirma la tendencia y evita falsas rupturas en mercados sin tendencia.
- El RSI filtra las señales falsas para garantizar la fiabilidad de la señal.
La aplicación de una combinación de varios indicadores garantiza la precisión y fiabilidad de las señales de negociación y la capacidad de seguir tendencias, lo que permite obtener mejores resultados estratégicos.
Análisis de riesgos
La estrategia también tiene ciertos riesgos:
- La línea de Fisher es propensa a generar falsas señales si el mercado se correlaciona. En este caso, se debe confiar en el filtro RSI.
- La configuración incorrecta de los parámetros WMA también puede afectar la precisión de los juicios.
- El índice de conversión de Fisher es un indicador de mal juicio sobre la evolución de las líneas ultracortas.
- Si se rompe el cable, la estrategia puede generar grandes pérdidas.
Para reducir el riesgo, se puede ajustar adecuadamente el parámetro RSI y optimizar el parámetro de ciclo WMA. Al mismo tiempo, se puede establecer un punto de parada para evitar pérdidas excesivas.
Dirección de optimización
La estrategia puede ser mejorada en los siguientes aspectos:
- Se puede probar la eficacia de la estrategia bajo diferentes parámetros de ciclo para encontrar la combinación óptima de parámetros.
- Agrega un mecanismo de suspensión de pérdidas. Se detiene cuando las pérdidas alcanzan una cierta proporción.
- Los parámetros del indicador de la transformación de Fisher se ajustan más a los resultados de la retroalimentación para encontrar la combinación de parámetros más precisa para determinar el indicador.
- Trate de añadir filtros de otros indicadores, como indicadores de fuerza y debilidad, de sesgo, etc.
- Prueba diferentes configuraciones para el tamaño de las posiciones abiertas.
Resumir
Esta estrategia utiliza el indicador de cambio de Fisher, el indicador WMA, el indicador OBV y el indicador RSI para determinar la dirección de la tendencia del mercado. Su señal de determinación es precisa, su capacidad de confirmación es fuerte y puede bloquear efectivamente la tendencia para obtener ganancias.
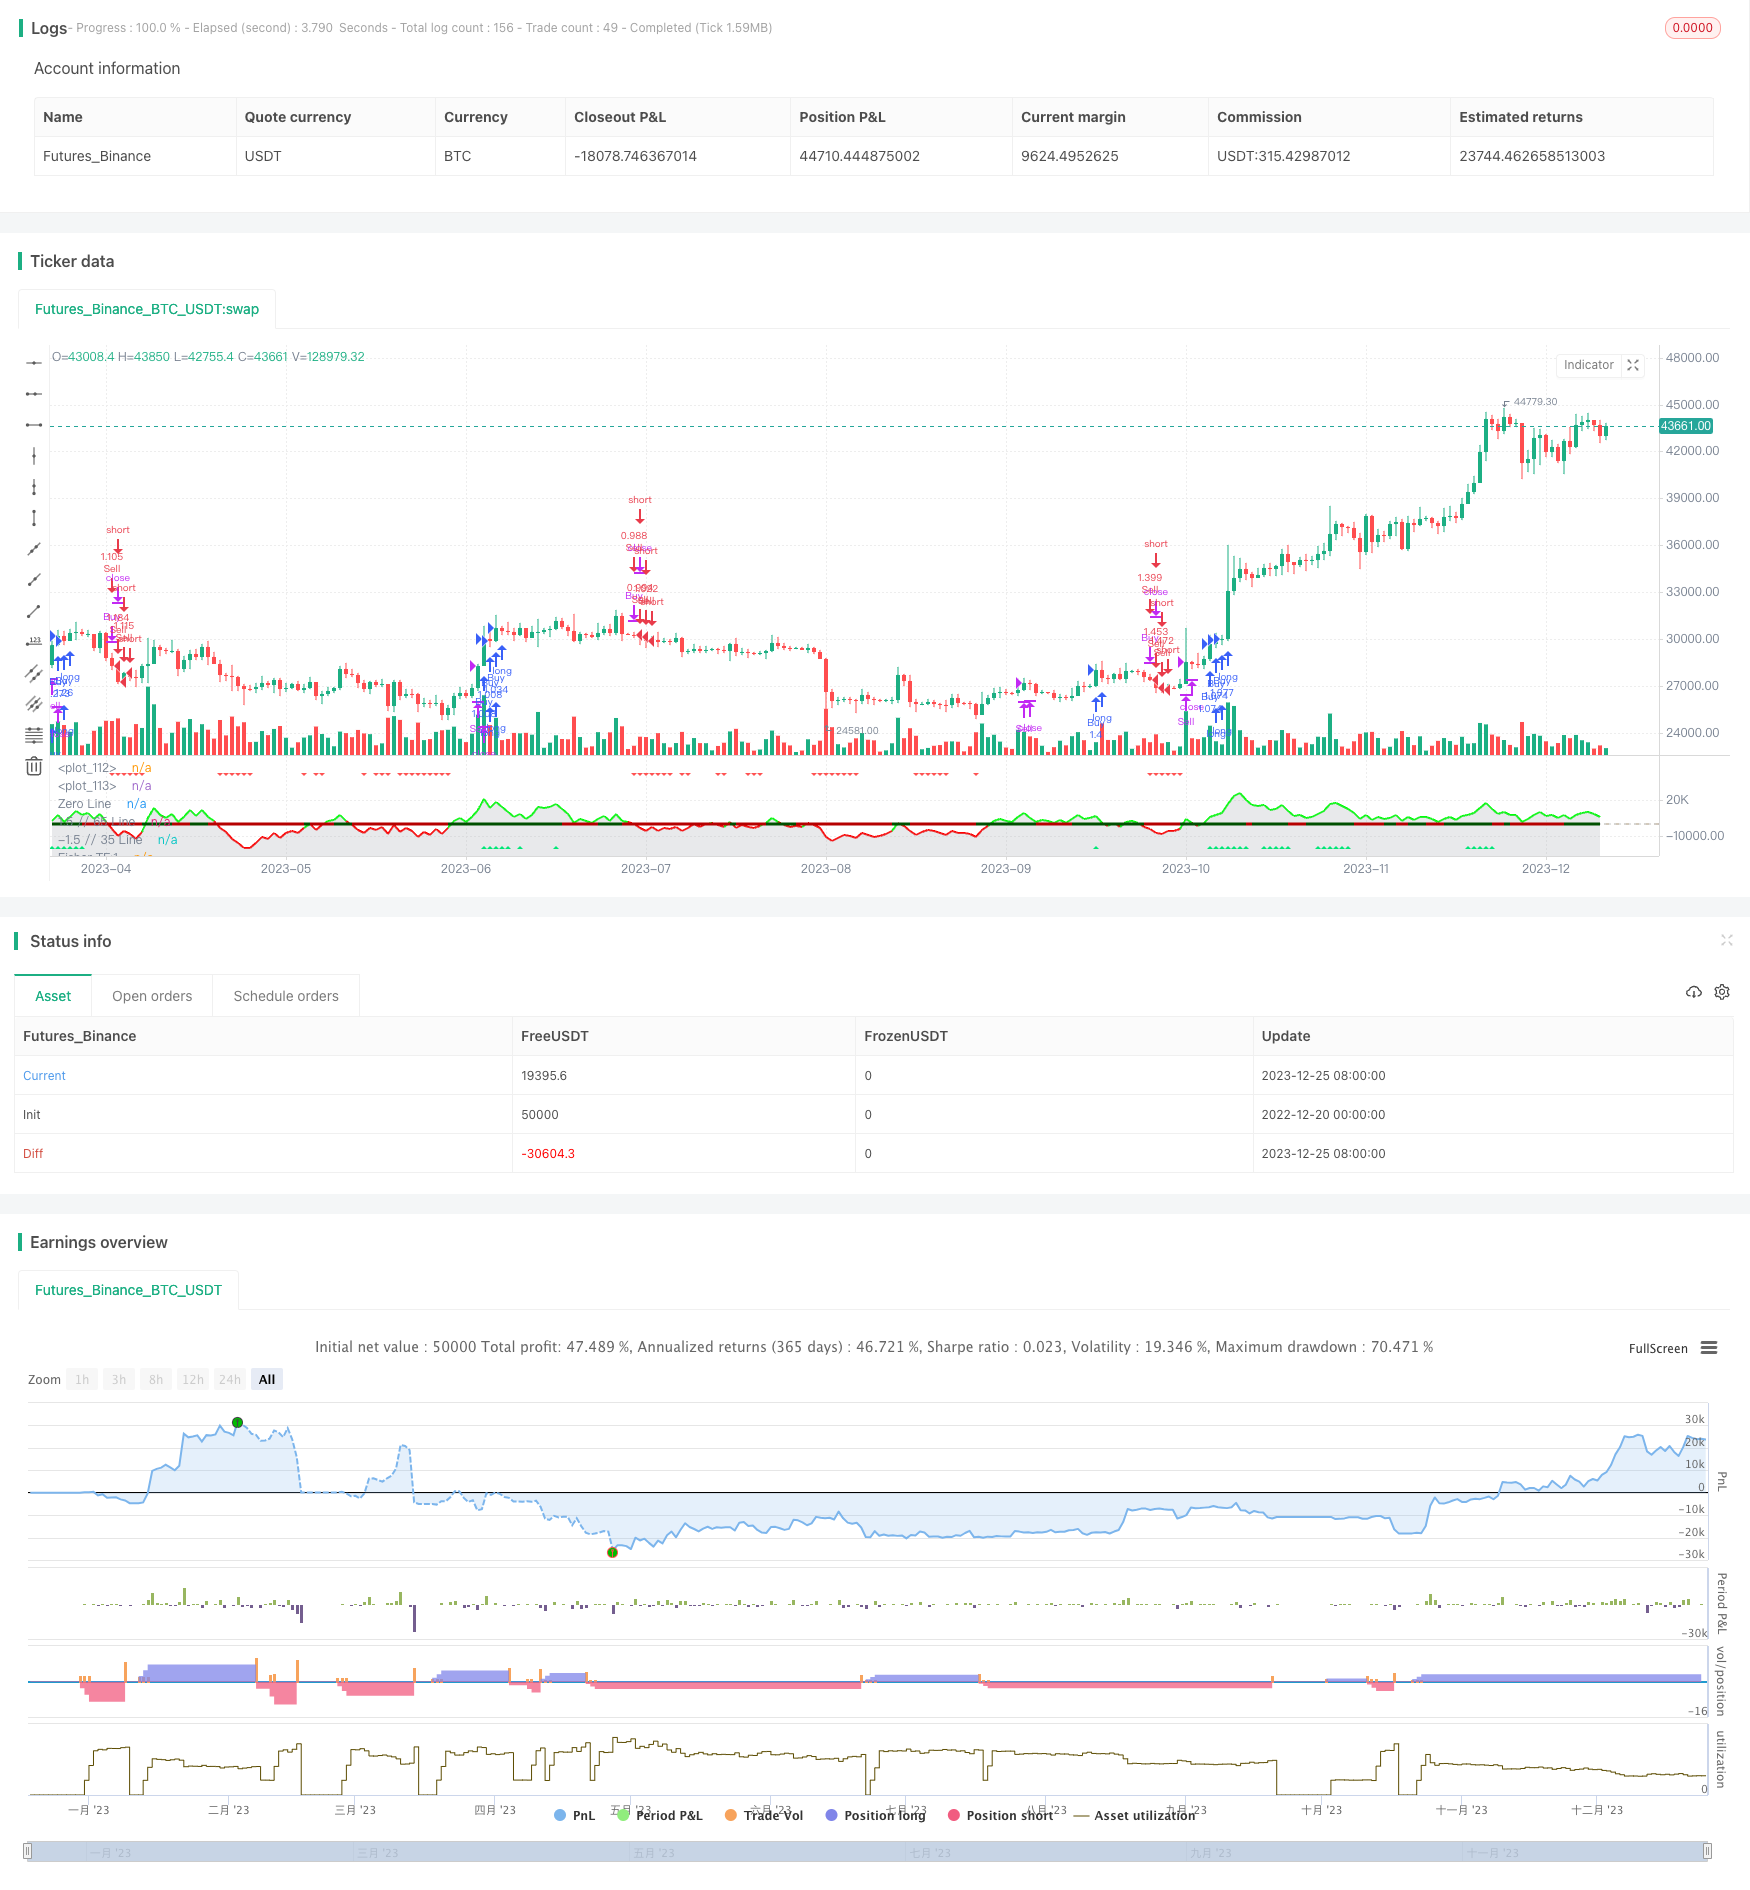
/*backtest
start: 2022-12-20 00:00:00
end: 2023-12-26 00:00:00
period: 1d
basePeriod: 1h
exchanges: [{"eid":"Futures_Binance","currency":"BTC_USDT"}]
*/

//@version=5
//author Sdover0123
strategy(title='FTR, WMA, OBV & RSI Strat', shorttitle='FTR WMA, OBV, RSI',overlay=false, default_qty_type=strategy.percent_of_equity, initial_capital = 100, default_qty_value=100, commission_value = 0.06, pyramiding = 3)
Len = input.int(10, minval=1, group ="Fisher Transform")
mult1 = input.int(1, minval=1, group ="Fisher Transform")
mult2 = input.int(2, minval=1, group ="Fisher Transform")
mult3 = input.int(4, minval=1, group ="Fisher Transform")
mult4 = input.int(8, minval=1, group ="Fisher Transform")
fish(Length, timeMultiplier) =>
    var nValue1 = 0.0
    var nValue2 = 0.0
    var nFish = 0.0
    xHL2 = hl2
    xMaxH = ta.highest(xHL2, Length * timeMultiplier)
    xMinL = ta.lowest(xHL2, Length * timeMultiplier)
    nValue1 := 0.33 * 2 * ((xHL2 - xMinL) / (xMaxH - xMinL) - 0.5) + 0.67 * nz(nValue1[1])
    if nValue1 > .99
        nValue2 := .999
        nValue2
    else if nValue1 < -.99
        nValue2 := -.999
        nValue2
    else
        nValue2 := nValue1
        nValue2
    nFish := 0.5 * math.log((1 + nValue2) / (1 - nValue2)) + 0.5 * nz(nFish[1])
    nFish
Fisher1 = fish(Len, mult1)
Fisher2 = fish(Len, mult2)
Fisher4 = fish(Len, mult3)
Fisher8 = fish(Len, mult4)

rsiLength = input.int(14, minval=1, group ="Moving Averages")
rsiVal = (ta.rsi(close, rsiLength) - 50) / 10
avg = strategy.position_avg_price

wma(source, length) =>
    sum = 0.0
    for i = 0 to length - 1
        sum := sum + source[i] * (length - i)
    wma = sum / (length * (length + 1) / 2)
    wma

wmaLength = input.int(10, "WMA Length", minval=1, group ="Moving Averages")
wmaClose = wma(close, wmaLength)
// Determine if WMA is bullish or bearish
isWmaBullish = wmaClose > wmaClose[1]
isWmaBearish = wmaClose < wmaClose[1]

//OBV
src = close
length = input.int(20, title="OBV Length", group="On-Balance Volume")
obv1(src) =>
    change_1 = ta.change(src)
    ta.cum(ta.change(src) > 0 ? volume : change_1 < 0 ? -volume : 0 * volume)*0.01
os = obv1(src)
obv_osc = os - ta.ema(os, length)
obc_color = (obv_osc > 0 ? color.rgb(0, 255, 8) : color.rgb(255, 0, 0))
plot(obv_osc, color=obc_color, style=plot.style_line, title='OBV-Points', linewidth=2)
plot(obv_osc, color=color.new(#b2b5be, 70), title='OBV', style=plot.style_area)
obvBullFilter = input.float(0.1, minval = 0, maxval = 5, step = 0.01, title ="OBV Bullish minimum value", group="On-Balance Volume")
obvBearFilter = input.float(-0.1, minval = -5, maxval = 0, step = 0.01, title ="OBV Bearish minimum value", group="On-Balance Volume")
obvBull = obv_osc > obvBullFilter
obvBear = obv_osc < obvBearFilter

// Add buy/sell signals
ReversalFilterDown = input.float(-0.7, 'Reversal Down TP Filter', -4, 4, step = 0.01, group = "RSI Level Filters", tooltip = "This is defined by taking the RSI value -50 and /10. When all Fisher lines are changing colour, this will SL/TP the long")
ReversalFilterUp = input.float(0.7, 'Reversal Up TP Filter', -4, 4, step = 0.01, group = "RSI Level Filters", tooltip = "This is defined by taking the RSI value -50 and /10. When all Fisher lines are changing colour, this will SL/TP the short")
RSILevelBuyFilter = input.float(1.66, 'RSI Level Buy Filter', -4, 4, step = 0.01, group = "RSI Level Filters", tooltip = "This is defined by taking the RSI value -50 and /10. Consider negative values")
RSILevelSellFilter = input.float(1, 'RSI Level Sell Filter', -4, 4, step = 0.01, group = "RSI Level Filters", tooltip = "This is defined by taking the RSI value -50 and /10. Consider negative values")
//buys - if breaking out and all Fisher are green and RSI filter value is met
buySignal = Fisher1 > Fisher1[1] and Fisher2 > Fisher2[1] and Fisher4 > Fisher4[1] and Fisher8 > Fisher8[1] and rsiVal > RSILevelBuyFilter and isWmaBullish and obvBull
ReversalUp = Fisher1 > Fisher1[1] and Fisher2 > Fisher2[1] and Fisher4 > Fisher4[1] and Fisher8 > Fisher8[1] and rsiVal > ReversalFilterUp
//sells - if breaking down and all Fisher are green and RSI filter value is met
sellSignal = Fisher1 < Fisher1[1] and Fisher2 < Fisher2[1] and Fisher4 < Fisher4[1] and Fisher8 < Fisher8[1] and rsiVal < RSILevelSellFilter and isWmaBearish and obvBear
ReversalDown = Fisher1 < Fisher1[1] and Fisher2 < Fisher2[1] and Fisher4 < Fisher4[1] and Fisher8 < Fisher8[1] and rsiVal < ReversalFilterDown


// Buy and Sell conditions
if buySignal and time>timestamp(2022, 06, 01, 09, 30) and barstate.isconfirmed
    strategy.close("Sell", comment = "Close Short")
    strategy.entry("Buy", strategy.long, comment = "Long")

if sellSignal and time>timestamp(2022, 06, 01, 09, 30) and barstate.isconfirmed
    strategy.close("Buy", comment = "Close Long")
    strategy.entry("Sell", strategy.short, comment = "Short")

if ReversalDown
    strategy.close("Buy", comment = "Close Long")

if ReversalUp
    strategy.close("Sell", comment = "Close Short")

//Plotting
//Fisher
plot(Fisher1, color=Fisher1 > nz(Fisher1[1]) ? color.green : color.rgb(255, 0, 0), title='Fisher TF:1')
plot(Fisher2, color=Fisher2 > nz(Fisher2[1]) ? color.green : color.rgb(255, 0, 0), title='Fisher TF:1', linewidth=2)
plot(Fisher4, color=Fisher4 > nz(Fisher4[1]) ? #008000 : #b60000, title='Fisher TF:1', linewidth=3)
plot(Fisher8, color=Fisher8 > nz(Fisher8[1]) ? #004f00 : #b60000, title='Fisher TF:1', linewidth=3)
//RSI
plot(rsiVal, color=rsiVal < 0 ? color.purple : color.yellow, linewidth=2, title='RSI')

//WMA
plot(isWmaBullish ? -2 : na, color=color.rgb(76, 175, 79, 20), linewidth=3, style=plot.style_linebr, title="WMA Bullish")
plot(isWmaBearish ? -2 : na, color=color.rgb(255, 82, 82, 20), linewidth=3, style=plot.style_linebr, title="WMA Bearish")

//Buy/Sell Signals
plotshape(buySignal, title='Buy Signal', location=location.bottom, color=color.new(color.lime, 0), style=shape.triangleup, size=size.small)
plotshape(sellSignal, title='Sell Signal', location=location.top, color=color.new(color.red, 0), style=shape.triangledown, size=size.small)

//Orientation
hline(RSILevelBuyFilter, color=color.rgb(25, 36, 99, 20), linestyle=hline.style_dotted, linewidth=2)
hline(RSILevelSellFilter, color=color.rgb(111, 27, 27, 20), linestyle=hline.style_dotted, linewidth=2)
hline(0, color=color.rgb(181, 166, 144, 39), linestyle=hline.style_dashed, linewidth=2, title = "Zero Line")
hline(1.5, color=color.rgb(217, 219, 220, 50), linestyle=hline.style_dotted, linewidth=2, title = "1.5 // 65 Line")
hline(-1.5, color=color.rgb(217, 219, 220, 50), linestyle=hline.style_dotted, linewidth=2, title = "-1.5 // 35 Line")