Estrategia de sobrecompra y sobreventa con RSI lento
Descripción general
La estrategia de sobrecompra y sobreventa del RSI lento abre nuevas oportunidades de negociación al extender el ciclo de revisiones del RSI y reducir la volatilidad de la curva RSI. La estrategia también se aplica a otros indicadores técnicos como el MACD.
Principio de estrategia
La idea central de esta estrategia es extender la longitud del ciclo de retrospectiva del RSI, tomando por defecto 500 ciclos, y luego suavizar la curva RSI a través de SMA, con un ciclo por defecto de 250. Esto reduce considerablemente la volatilidad de la curva RSI y ralentiza la velocidad de respuesta del RSI, lo que genera nuevas oportunidades de negociación.
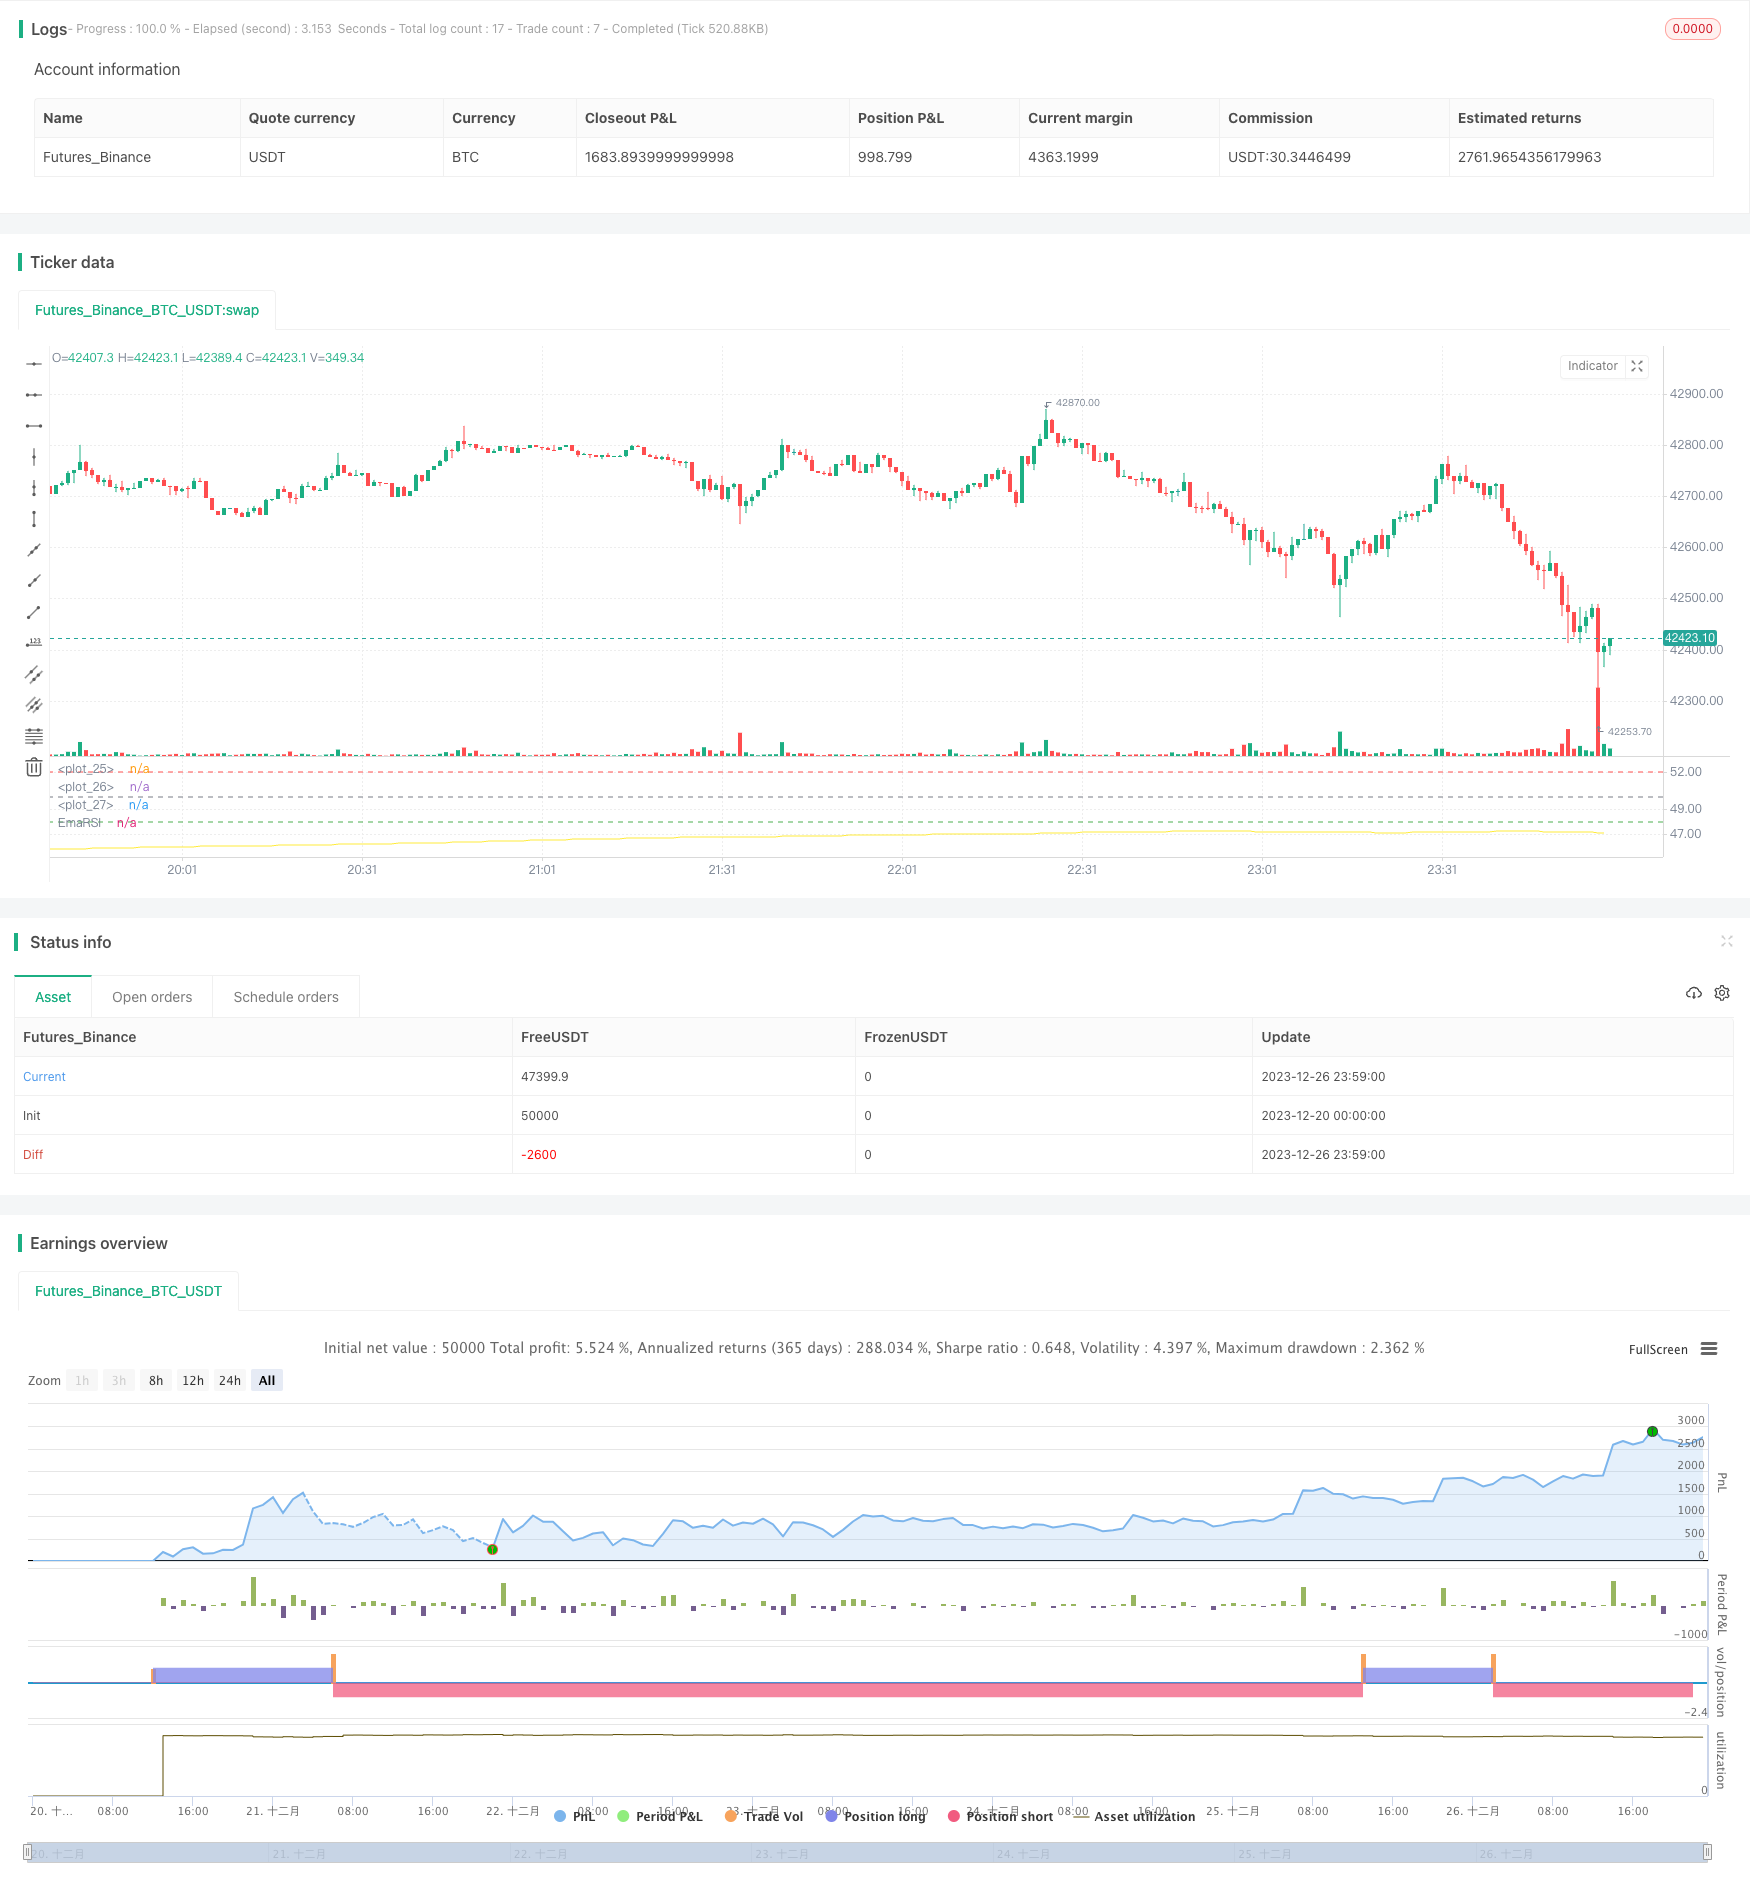
Los períodos de retracción demasiado largos debilitan la volatilidad de la curva RSI, por lo que los criterios para determinar si se está sobrecomprando o sobrevendendo también deben ajustarse. La estrategia establece una línea de sobreventa 52 y una línea de sobreventa 48 personalizadas. Se produce una señal de plus cuando el RSI ponderado rompe la línea de sobreventa desde abajo; se produce una señal de falta cuando se rompe la línea de sobreventa desde arriba.
Ventajas estratégicas
- Innovador, abre nuevas vías de negocio a través de ciclos más largos
- Se puede reducir significativamente la señal falsa y mejorar la estabilidad
- Se puede personalizar el umbral de sobrecompra y sobreventa para adaptarse a diferentes mercados
- Se puede sembrar para aumentar el rendimiento
Riesgo estratégico
- El ciclo demasiado largo puede perder oportunidades de línea corta
- Hay que tener paciencia a la espera de la oportunidad de entrar.
- El exceso de compra y venta de valores puede aumentar las pérdidas si se establece mal el umbral.
- El riesgo de ser aprovechado
La solución:
- Reducir adecuadamente los ciclos y aumentar la frecuencia de las transacciones
- El uso de la construcción por lotes para dispersar el riesgo
- Optimización de los parámetros de desvalorización para adaptarse a diferentes entornos del mercado
- Establezca un punto de parada para evitar grandes pérdidas
Dirección de optimización de la estrategia
- Optimizar los parámetros del RSI para encontrar la mejor combinación de períodos
- Prueba de diferentes parámetros de ciclo de suavizado SMA
- Optimización de los parámetros de sobrecompra y sobreventa para adaptarse a los diferentes mercados
- Añadir estrategias de stop loss para controlar las pérdidas individuales
Resumir
La estrategia de sobremarcha sobre el RSI a baja velocidad, mediante la extensión del ciclo y la utilización de la línea de paridad para suprimir la volatilidad, ha abierto con éxito una nueva forma de negociación. La estrategia, con la optimización de los parámetros y el control del riesgo en su lugar, promete obtener ganancias adicionales estables y eficientes. En general, la estrategia tiene una gran innovación y valor de uso.
/*backtest
start: 2023-12-20 00:00:00
end: 2023-12-27 00:00:00
period: 1m
basePeriod: 1m
exchanges: [{"eid":"Futures_Binance","currency":"BTC_USDT"}]
*/


// Wilder was a very influential man when it comes to TA. However, I'm one to always try to think outside the box.
// While Wilder recommended that the RSI be used only with a 14 bar lookback period, I on the other hand think there is a lot to learn from RSI if one simply slows down the lookback period
// Same applies for MACD.
// Every market has its dynmaics. So don't narrow your mind by thinking my source code input levels are the only levels that work.
// Since the long lookback period weakens the plot volatility, again, one must think outside the box when trying to guage overbought and oversold levels.

// Good luck and don't bash me if some off-the-wall FA spurned divergence causes you to lose money.
// And NO this doesn't repaint and I won't answer those who ask.
//@version=4

strategy("SLOW RSI OB/OS Strategy", overlay=false)
price = input(ohlc4, title="Price Source")
len = input(500, minval=1, step=5,  title="RSI Length")
smoother = input(250, minval=1, step=5, title="RSI SMA")
up = rma(max(change(price), 0), len)
down = rma(-min(change(price), 0), len)
rsi = down == 0 ? 100 : up == 0 ? 0 : 100 - (100 / (1 + up / down))
EmaRSI = ema(rsi,smoother)
plot(EmaRSI, title="EmaRSI", style=line, linewidth=1, color=yellow)


OB = input(52, step=0.1)
OS = input(48, step=0.1)
hline(OB, linewidth=1, color=red)
hline(OS,linewidth=1, color=green)
hline(50,linewidth=1, color=gray)


long = change(EmaRSI) > 0 and EmaRSI <= 50 and crossover(EmaRSI, OS)
short = change(EmaRSI) < 0 and EmaRSI >= 50 and crossunder(EmaRSI, OB)


strategy.entry("Long", strategy.long, when=long) //_signal or long) //or closeshort_signal)
strategy.entry("Short", strategy.short, when=short) //_signal or short) // or closelong_signal)

// If you want to try to play with exits you can activate these!

//closelong = crossunder(EmaRSI, 0) //or crossunder(EmaRSI, OS)
//closeshort = crossover(EmaRSI, 0) //or crossover(EmaRSI, OB)

//strategy.close("Long", when=closelong)
//strategy.close("Short", when=closeshort)