Estrategia de trading a corto plazo basada en la reversión de la media móvil
Descripción general
La estrategia de línea media inversa es una estrategia de comercio de línea corta basada en la inversión de la línea media. Combina varios indicadores como el Brin, el RSI y el CCI para capturar cambios en las tendencias de la línea corta en los mercados financieros y lograr un objetivo de comercio bajo y alto.
Esta estrategia se utiliza principalmente en variedades de alta liquidez como los índices de acciones, divisas y metales preciosos. Busca maximizar las ganancias por transacción, mientras controla el riesgo-beneficio de las transacciones en general.
Principio de estrategia
Utilice la banda de Brin para determinar la zona de desvalorización de los precios. Considere el short cuando el precio se acerca a la banda de Brin superior y el long cuando el precio se acerca a la banda de Brin inferior.
En combinación con el indicador RSI, se puede determinar si se está sobrecomprando o sobrevendendo. El indicador RSI puede identificar de manera efectiva las situaciones de sobrecompra y sobreventa.
El indicador CCI determina las señales de reversión de precios. El indicador CCI es más sensible a las situaciones anormales y puede capturar eficazmente las oportunidades de reversión de precios.
Los precios suben por encima de la media de 5 días y bajan por debajo de la media de 5 días. La posición de la media representa el rango principal de los precios actuales, y la relación entre el precio y la media refleja los cambios en la tendencia potencial.
Después de la confirmación de la señal de entrada, se obtiene una ganancia rápida. Se establece una salida de stop loss según la situación de retiro, para lograr una alta tasa de victoria.
Ventajas estratégicas
- Combinación de múltiples indicadores para mejorar la precisión de la señal
La estrategia de la línea media inversa utiliza varios indicadores al mismo tiempo, como las bandas de Brin, el RSI y el CCI. Estos indicadores son más sensibles a los cambios en los precios, y su uso en combinación puede mejorar la precisión de la señal y reducir las señales erróneas.
- Las reglas de entrada son estrictas para evitar la caída en picado.
La estrategia requiere que las señales de los indicadores y los precios aparezcan simultáneamente, evitando que un solo indicador sea engañoso. Al mismo tiempo, requiere que los precios se hayan invertido claramente, reduciendo el riesgo relacionado.
- Mecanismos eficientes para detener las pérdidas individuales
La estrategia establece un límite de pérdida más estricto, independientemente de la cantidad de descubiertos. Una vez que el precio rompe el límite de pérdida en la dirección negativa, la estrategia se detiene rápidamente y evita grandes pérdidas individuales.
- El objetivo es maximizar el beneficio de cada acción.
La estrategia establece dos objetivos de parada para obtener ganancias por etapas. Al mismo tiempo, se ajusta el seguimiento de las pérdidas en pasos pequeños después de la parada para ampliar el espacio de ganancias de cada uno.
Análisis de riesgos
- Los precios fluctuaron fuertemente, provocando un alto en los pérdidas.
En el caso de una fuerte fluctuación de los precios, la línea de parada puede romperse, causando pérdidas innecesarias. Esto ocurre generalmente en el caso de fluctuaciones anormales de precios causadas por eventos importantes.
Este riesgo puede ser respondido ampliando el stop loss, evitando al mismo tiempo operar durante eventos importantes.
- La persecución es demasiado, no hay vuelta atrás.
Cuando la tendencia es demasiado fuerte, el precio suele subir demasiado rápido y no puede revertirse a tiempo. Si se mantiene en la posición baja, puede correr el riesgo de seguir cayendo.
En este caso, se debe esperar a que el impulso de la subida de los precios se debilite de manera significativa para considerar la posibilidad de intervenir.
Dirección de optimización
- Optimización de los parámetros del indicador para mejorar la precisión de la señal
Se pueden probar los resultados de las respuestas con diferentes combinaciones de parámetros para seleccionar el mejor parámetro. Por ejemplo, los parámetros que pueden optimizar el RSI, los parámetros del CCI, etc.
- Indicadores de energía combinada para determinar el momento de la verdadera reversión
Se puede agregar un indicador de potencia equivalente de volumen de tráfico o ancho de banda de Brin. Esto evita que se produzcan señales erróneas cuando el precio se ajusta solo en pequeñas cantidades.
- Optimización de las estrategias de stop-loss para ampliar las ganancias individuales
Se pueden probar diferentes puntos de parada de pérdidas para maximizar cada ganancia. Al mismo tiempo, se debe equilibrar el riesgo para evitar que el stop loss se active fácilmente.
Resumir
La estrategia de la línea media inversa utiliza un conjunto de diversos indicadores, con características de precisión de la señal, especificaciones de operación y control de riesgos. Se aplica a las variedades con alta sensibilidad a los cambios en el mercado y con una gran liquidez, que pueden capturar oportunidades de reversión de precios entre el cinturón de Bryn y la línea media clave para lograr objetivos comerciales de compra y venta baja.
En la práctica, aún se debe prestar atención a la optimización de los parámetros del indicador, combinando la capacidad de los indicadores cuantitativos para determinar el momento de la verdadera reversión. Además, se debe administrar el riesgo para hacer frente a las fluctuaciones bruscas de los precios. Si se aplica correctamente, la estrategia puede obtener un rendimiento alfa relativamente estable.
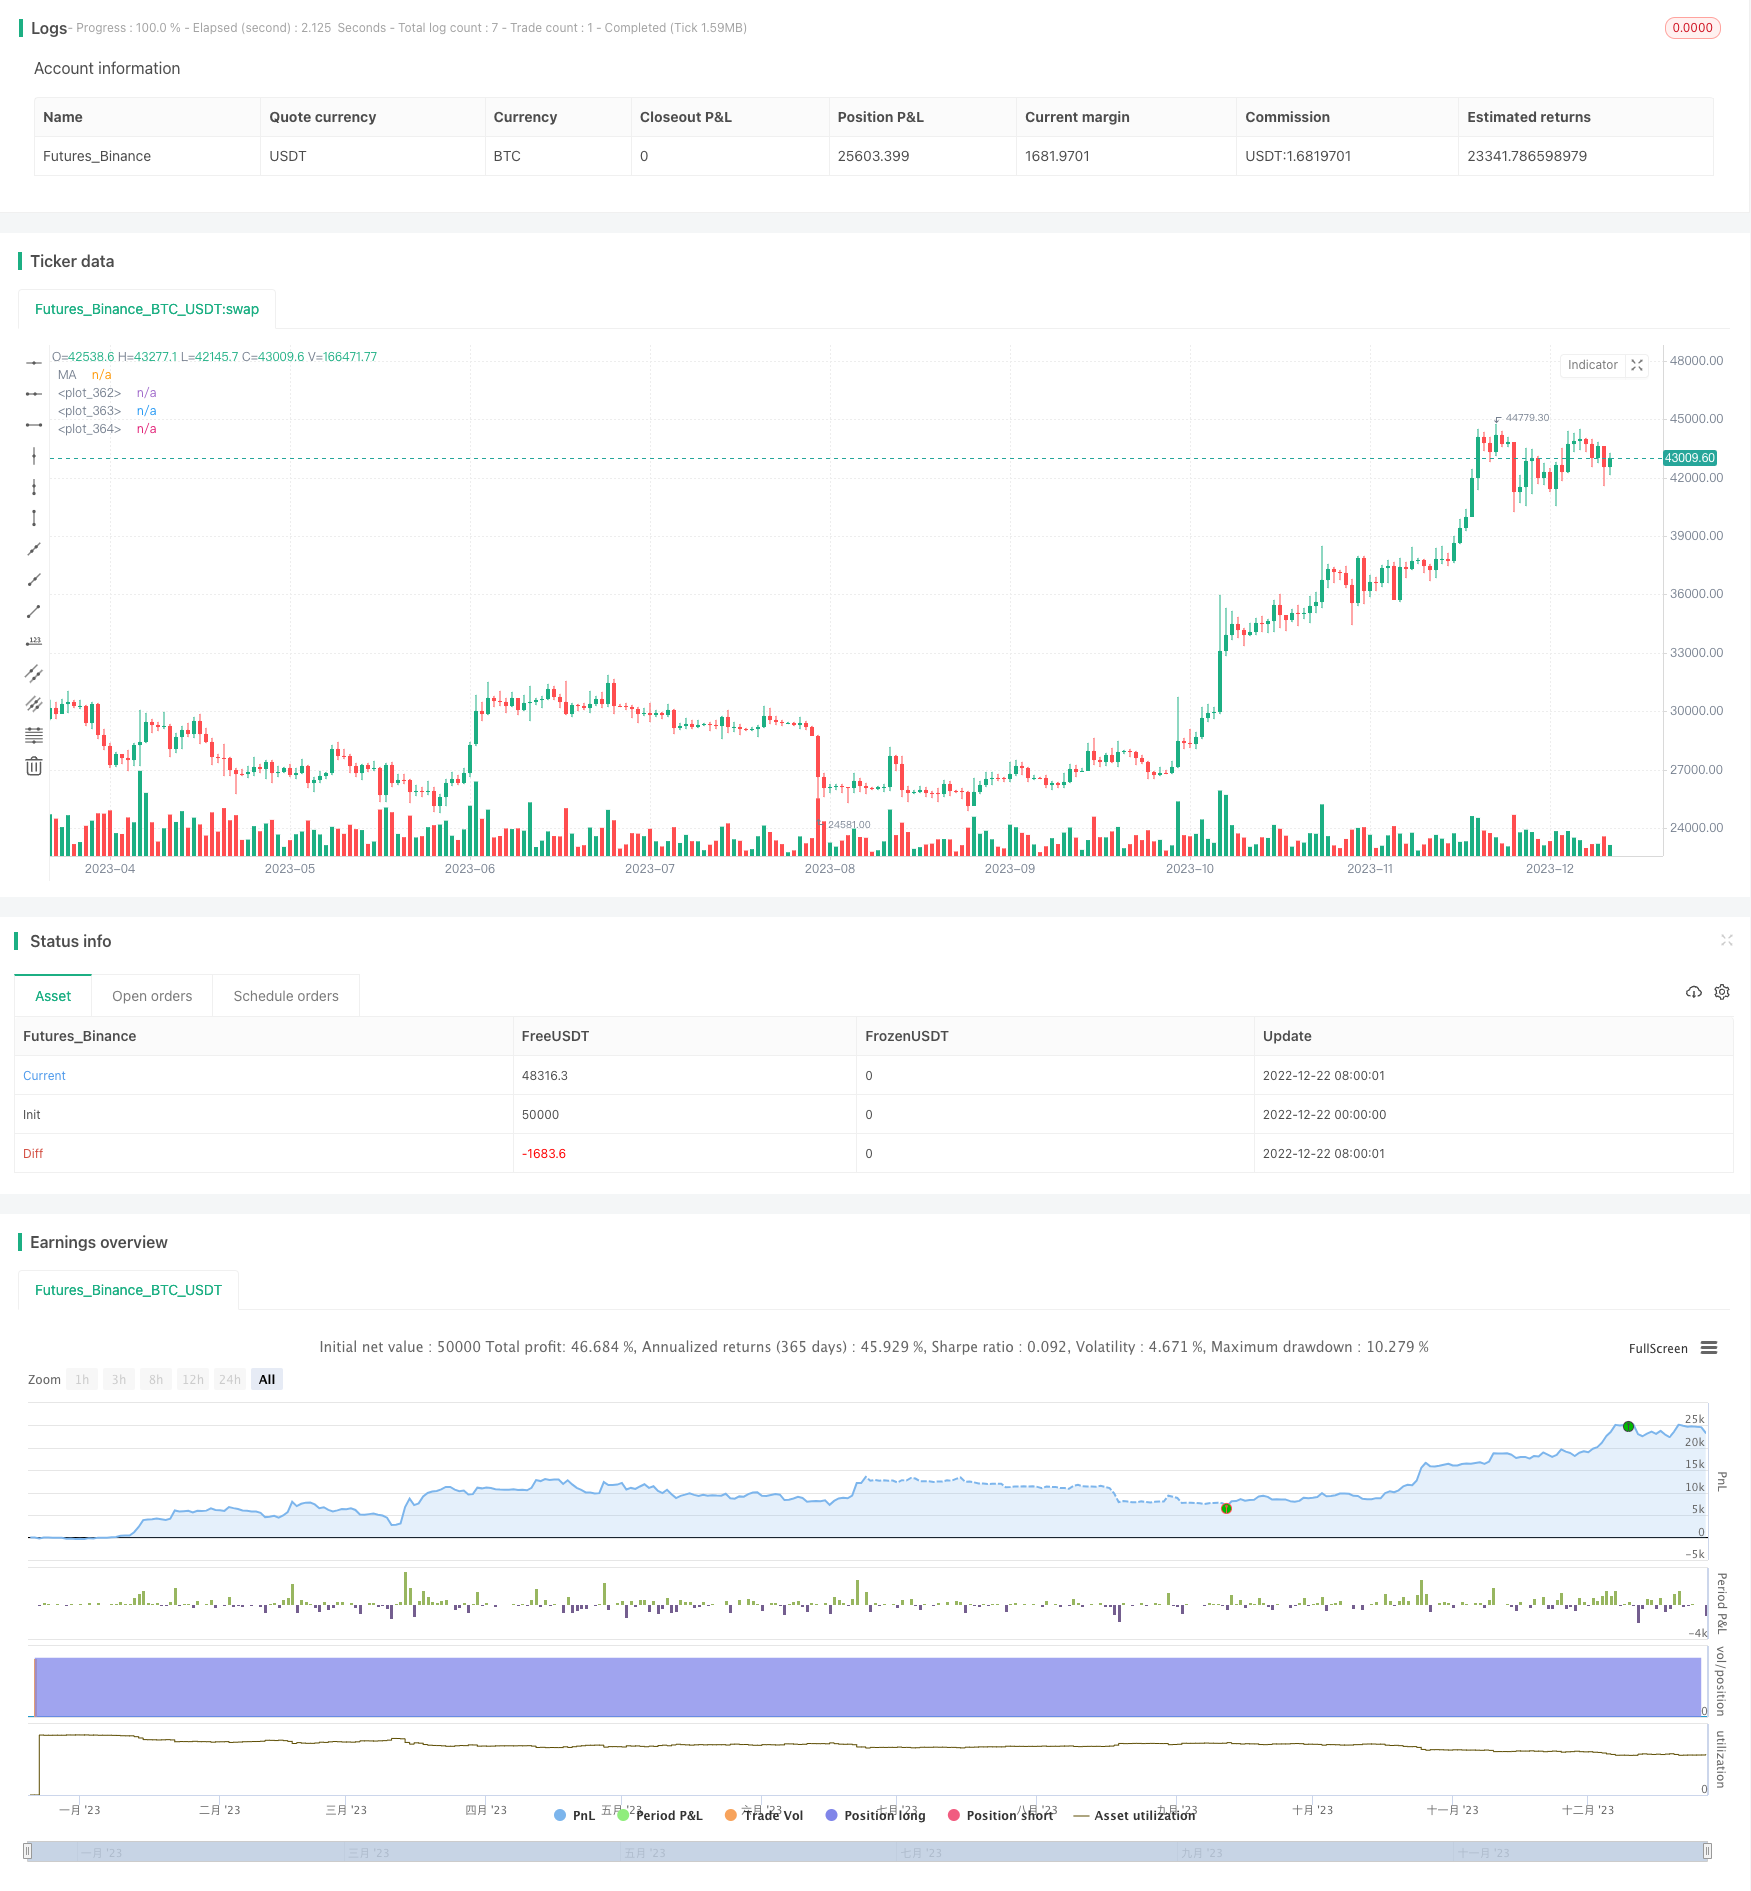
/*backtest
start: 2022-12-22 00:00:00
end: 2023-12-28 00:00:00
period: 1d
basePeriod: 1h
exchanges: [{"eid":"Futures_Binance","currency":"BTC_USDT"}]
*/

// This source code is subject to the terms of the Mozilla Public License 2.0 at https://mozilla.org/MPL/2.0/
// © sg1999

//@version=4


// >>>>>strategy name
strategy(title = "CCI-RSI MR", shorttitle = "CCI-RSI MR", overlay = true)

// >>>>input variables

// 1. risk per trade as % of initial capital
risk_limit = input(title="Risk Limit (%)", type=input.float, minval=0.1, defval=2.0, step=0.1)

// 2. drawdown
Draw_down = input(title="Max Drawdown (x ATR)", type=input.float, minval=0.5, maxval=10, defval=2.0, step=0.1)

// 3. type of stop loss to be used
original_sl_type  = input(title="SL Based on", defval="Close Price", options=["Close Price","Last Traded Price"])

// 4. entry signal validity for bollinger strategies
dist_from_signal= input(title="Entry distance from signal", type=input.integer, minval=1, maxval=20, defval=3, step=1)

// 5. multiple exit points
exit_1_pft_pct          = input(title="1st exit when reward is", type=input.float, minval=0.5, maxval=100, defval=1.0, step=0.1)
exit_1_qty_pct          = input(title="1st exit quantity %", type=input.float, minval=1, maxval=100, defval=100, step=5)
exit_2_pft_pct          = input(title="2nd exit when reward is", type=input.float, minval=0.5, maxval=100, defval=1.5, step=0.1)
sl_trail_pct            = input(title="Trailing SL compared to original SL", type=input.float, minval=0.5, maxval=100, defval=0.5, step=0.5)

//show signal bool
plotBB = input(title="Show BB", type=input.bool, defval=true)
plotSignals  = input(title="Show Signals", type=input.bool, defval=true)

// 6. date range to be used for backtesting
fromMonth = input(defval = 1,    title = "From Month",      type = input.integer, minval = 1, maxval = 12)
fromDay   = input(defval = 1,    title = "From Day",        type = input.integer, minval = 1, maxval = 31)
fromYear  = input(defval = 1990, title = "From Year",       type = input.integer, minval = 1970)
thruMonth = input(defval = 1,    title = "Thru Month",      type = input.integer, minval = 1, maxval = 12)
thruDay   = input(defval = 1,    title = "Thru Day",        type = input.integer, minval = 1, maxval = 31)
thruYear  = input(defval = 2022, title = "Thru Year",       type = input.integer, minval = 1970)

start     = timestamp(fromYear, fromMonth, fromDay, 00, 00)        // backtest start window
finish    = timestamp(thruYear, thruMonth, thruDay, 23, 59)        // backtest finish window
window()  => true

// >>>>>strategy variables

//input variables
current_high = highest(high, 5)     // swing high (5 period)
current_low = lowest(low, 5)        // swing low (5 period)
current_ma = sma(close, 5)          // Simple Moving average (5 period)
atr_length = atr(20)                // ATR (20 period)
CCI = cci(close,20)                 // CCI (20 period)
RSI = rsi(close,14)                 // RSI (14 period)
RSI_5 = sma (RSI, 5)                // Simple moving average of RSI (5 period)


// 1. for current candle

long_entry              = false
short_entry             = false
risk_reward_ok          = false
sl_hit_flag             = false
tsl_hit_flag            = false
sl_cross                = false

// 2. across candles

var RSI_short           = false     //short signal boolean
var RSI_long            = false     //long signal boolean
var cci_sell            = false     //sellsignal crossunder boolean
var cci_buy             = false     //buy signal crossover boolean
var bar_count_long      = 0         // Number of bars after a long signal
var bar_count_short     = 0         // Number of bars after a short signal
var candles_on_trade    = 0
var entry_price         = 0.00
var sl_price            = 0.00
var qty                 = 0
var exit_1_qty          = 0
var exit_2_qty          = 0
var exit_1_price        = 0.0
var exit_2_price        = 0.0
var hold_high           = 0.0       // variable used to calculate Trailing sl
var hold_low            = 0.0       // variable used to calculate Trailing sl
var tsl_size            = 0.0       // Trailing Stop loss size(xR)
var sl_size             = 0.0       // Stop loss size (R)
var tsl_price           = 0.0       //Trailing stoploss price


// >>>>>strategy conditions.
// Bollinger bands (2 std)
[mBB0,uBB0,lBB0] = bb(close,20,2)
uBB0_low= lowest(uBB0,3) // lowest among upper BB of past 3 periods
lBB0_high= highest(lBB0,3) //highest among upper BB of past 3 periods


//RSI and CCI may not necessarily crossunder on the same candle
t_sell_RSI = sum( crossunder(RSI,RSI_5)? 1 : 0, 2) == 1 // checks if crossunder has happened in the last 3 candles (including the current candle)
t_sell_CCI = sum( crossunder(CCI,100)? 1 : 0, 2) == 1 //and (CCI >50)
t_buy_RSI  = sum( crossover(RSI,RSI_5)? 1 : 0, 2) == 1  //checks if crossover has happened in the last 3 candles (including the current candle)
t_buy_CCI  = sum( crossover(CCI,-100) ? 1 : 0, 2) == 1 //and (CCI<-50)

// CONDITIONS FOR A SELL signal
if t_sell_RSI and t_sell_CCI and (current_high >= uBB0_low)
    cci_sell := true
    bar_count_short := 0

if  cci_sell and strategy.position_size ==0
    bar_count_short := bar_count_short + 1

if  cci_sell and bar_count_short<= dist_from_signal and close <= current_ma  and strategy.position_size ==0
    RSI_short := true

//conditions for a BUY signal
if t_buy_RSI and t_buy_CCI and (current_low <= lBB0_high) // or current_low_close <= lBB01_high)
    cci_buy := true
    bar_count_long := 0

if  cci_buy and strategy.position_size ==0
    bar_count_long := bar_count_long + 1

if  cci_buy and  bar_count_long<= dist_from_signal and close >= current_ma and strategy.position_size ==0
    RSI_long := true

if RSI_long and RSI_short
    RSI_long := false
    RSI_short := false


// >>>>>entry and target specifications

if strategy.position_size == 0 and RSI_short
    short_entry         := true
    entry_price         := close
    sl_price            := current_high + syminfo.mintick // (swing high + one tick) is the stop loss
    sl_size             := abs(entry_price - sl_price)
    candles_on_trade    := 0
    tsl_size            := abs(entry_price - sl_price)*sl_trail_pct // Here sl_trail_pct is the multiple of R which is used to calculate TSL size

if strategy.position_size == 0 and RSI_long
    long_entry          := true
    entry_price         := close
    sl_price            := current_low -  syminfo.mintick //(swing low - one tick) is the stop loss
    candles_on_trade    := 0
    sl_size             := abs(entry_price - sl_price)
    tsl_size            := abs(entry_price - sl_price)*sl_trail_pct // Here sl_trail_pct is the multiple of R which is used to calculate TSL size

if long_entry and short_entry
    long_entry          := false
    short_entry         := false


// >>>>risk evaluation criteria

//>>>>> quantity determination and exit point specifications.

if (long_entry or short_entry) and strategy.position_size == 0 // Based on our risk (R), no.of lots is calculated by considering a risk per trade limit formula
    qty                 := round((strategy.equity) * (risk_limit/100)/(abs(entry_price - sl_price)*syminfo.pointvalue))
    exit_1_qty          := round(qty * (exit_1_qty_pct/100))
    exit_2_qty          := qty - (exit_1_qty)
    if long_entry
        exit_1_price    := entry_price + (sl_size * exit_1_pft_pct)
        exit_2_price    := entry_price + (sl_size * exit_2_pft_pct)
    if short_entry
        exit_1_price    := entry_price - (sl_size * exit_1_pft_pct)
        exit_2_price    := entry_price - (sl_size * exit_2_pft_pct)


// trail SL after 1st target is hit
if abs(strategy.position_size) == 0
    hold_high   := 0
    hold_low    := 0

if strategy.position_size > 0 and high > exit_1_price
    if high > hold_high or hold_high == 0
        hold_high    := high
    tsl_price        := hold_high - tsl_size


if strategy.position_size < 0 and low < exit_1_price
    if low  < hold_low or hold_low == 0
        hold_low     := low
    tsl_price        := hold_low + tsl_size


//>>>> entry conditons

if long_entry and strategy.position_size == 0
    strategy.cancel("BUY", window())   // add another window condition which considers day time (working hours)
    strategy.order("BUY", strategy.long, qty, comment="BUY @ "+ tostring(entry_price),when=window())

if short_entry and strategy.position_size == 0
    strategy.cancel("SELL", window()) // add another window condition which considers day time (working hours)
    strategy.order("SELL", strategy.short, qty, comment="SELL @ "+ tostring(entry_price),when=window())

//>>>> exit conditons

tsl_hit_flag     := false

//exit at tsl
if strategy.position_size > 0 and close < tsl_price  and abs(strategy.position_size)!=qty
    strategy.order("EXIT at TSL", strategy.short, abs(strategy.position_size),  comment="EXIT TSL @ "+ tostring(close))
    RSI_short                := false
    RSI_long                 := false
    bar_count_long            := 0
    bar_count_short           := 0
    tsl_hit_flag              := true
    cci_sell := false
    cci_buy := false
    strategy.cancel("EXIT 1", true)
    strategy.cancel("EXIT 2", true)
    strategy.cancel("Exit Drawd",true)
    strategy.cancel("EXIT at SL",true)

if strategy.position_size < 0 and close > tsl_price  and abs(strategy.position_size)!=qty
    strategy.order("EXIT at TSL", strategy.long, abs(strategy.position_size), comment="EXIT TSL @ "+ tostring(close))
    RSI_short                := false
    RSI_long                 := false
    bar_count_long            := 0
    bar_count_short           := 0
    tsl_hit_flag              := true
    cci_sell := false
    cci_buy := false
    strategy.cancel("EXIT 1", true)
    strategy.cancel("EXIT 2", true)
    strategy.cancel("Exit Drawd",true)
    strategy.cancel("EXIT at SL",true)

//>>>>exit at sl

if strategy.position_size > 0 and original_sl_type == "Close Price" and close < sl_price and abs(strategy.position_size)==qty
    strategy.cancel("EXIT at SL", true)
    strategy.order("EXIT at SL", strategy.short, abs(strategy.position_size),stop= sl_price,  comment="EXIT SL @ "+ tostring(close))
    RSI_short                := false
    RSI_long                 := false
    bar_count_long            := 0
    bar_count_short           := 0
    cci_buy := false
    cci_sell := false
    sl_hit_flag               := true
    strategy.cancel("EXIT 1", true)
    strategy.cancel("EXIT 2", true)
    strategy.cancel("Exit Drawd",true)
    strategy.cancel("EXIT at TSL",true)


if strategy.position_size < 0 and original_sl_type == "Close Price" and close > sl_price and abs(strategy.position_size)==qty
    strategy.cancel("EXIT at SL", true)
    strategy.order("EXIT at SL", strategy.long, abs(strategy.position_size), stop = sl_price, comment="EXIT SL @ "+ tostring(close))
    RSI_short               := false
    RSI_long                := false
    bar_count_long           := 0
    bar_count_short          := 0
    cci_buy := false
    cci_sell := false
    sl_hit_flag              := true
    strategy.cancel("EXIT 1", true)
    strategy.cancel("EXIT 2", true)
    strategy.cancel("Exit Drawd",true)
    strategy.cancel("EXIT at TSL",true)


//>>>>>for ltp sl setting

if strategy.position_size > 0 and original_sl_type == "Last Traded Price" and abs(strategy.position_size) ==qty
    strategy.order("EXIT at SL", strategy.short, abs(strategy.position_size),stop= sl_price,  comment="EXIT SL @ "+ tostring(close))
    RSI_short              := false
    RSI_long               := false
    bar_count_long          := 0
    bar_count_short         := 0
    cci_buy := false
    cci_sell := false
    strategy.cancel("EXIT 1", true)
    strategy.cancel("EXIT 2", true)
    strategy.cancel("Exit Drawd",true)
    strategy.cancel("EXIT at TSL",true)

if strategy.position_size < 0 and original_sl_type == "Last Traded Price" and abs(strategy.position_size) ==qty
    strategy.order("EXIT at SL", strategy.long, abs(strategy.position_size), stop = sl_price, comment="EXIT SL @ "+ tostring(close))
    RSI_short              := false
    RSI_long               := false
    bar_count_long          := 0
    bar_count_short         := 0
    cci_buy := false
    cci_sell := false
    strategy.cancel("EXIT 1", true)
    strategy.cancel("EXIT 2", true)
    strategy.cancel("Exit Drawd",true)
    strategy.cancel("EXIT at TSL",true)

//>>>>>exit at target

if strategy.position_size > 0 and abs(strategy.position_size) == qty and not tsl_hit_flag
    strategy.order("EXIT 1", strategy.short, exit_1_qty, limit=exit_1_price, comment="EXIT TG1 @ "+ tostring(exit_1_price))
    strategy.cancel("Exit Drawd",true)
    cci_sell := false
    cci_buy := false

if strategy.position_size > 0 and abs(strategy.position_size) < qty and abs(strategy.position_size) != qty and not tsl_hit_flag
    strategy.order("EXIT 2", strategy.short, exit_2_qty, limit=exit_2_price, comment="EXIT TG2 @ "+ tostring(exit_2_price))
    RSI_short := false
    RSI_long  := false
    bar_count_long := 0
    bar_count_short := 0
    cci_buy := false
    cci_sell := false
    strategy.cancel("Exit Drawd",true)
    strategy.cancel("EXIT at SL", true)

if strategy.position_size < 0 and abs(strategy.position_size) == qty and not tsl_hit_flag
    strategy.order("EXIT 1", strategy.long, exit_1_qty, limit=exit_1_price, comment="EXIT TG1 @ "+ tostring(exit_1_price))
    strategy.cancel("Exit Drawd",true)
    cci_buy := false
    cci_sell := false

if strategy.position_size < 0 and abs(strategy.position_size) < qty and abs(strategy.position_size) != qty
    strategy.order("EXIT 2", strategy.long, exit_2_qty, limit=exit_2_price, comment="EXIT TG2 @ "+ tostring(exit_2_price))
    RSI_short := false
    RSI_long  := false
    bar_count_long := 0
    bar_count_short := 0
    cci_buy := false
    cci_sell := false
    strategy.cancel("Exit Drawd",true)
    strategy.cancel("EXIT at SL", true)

//>>>>>>drawdown execution

if strategy.position_size < 0 and original_sl_type == "Close Price" and not tsl_hit_flag
    strategy.cancel("Exit Drawd",true)
    strategy.order("Exit Drawd", strategy.long, abs(strategy.position_size), stop= (entry_price + Draw_down*atr_length)  ,comment="Drawdown exit S")
    RSI_short            := false
    RSI_long             := false
    bar_count_long        := 0
    bar_count_short       := 0
    cci_buy := false
    cci_sell := false


if strategy.position_size > 0 and original_sl_type == "Close Price" and not tsl_hit_flag and not sl_hit_flag
    strategy.cancel("Exit Drawd",true)
    strategy.order("Exit Drawd", strategy.short, abs(strategy.position_size), stop= (entry_price - Draw_down*atr_length)  ,comment="Drawdown exit B")
    RSI_short           := false
    RSI_long            := false
    bar_count_long       := 0
    bar_count_short      := 0
    cci_buy := false
    cci_sell := false

//>>>>to add sl hit sign

if strategy.position_size != 0 and sl_hit_flag //For symbols on chart
    sl_cross := true

//>>>>>cancel all pending orders if the trade is booked

strategy.cancel_all(strategy.position_size == 0 and not (long_entry or short_entry))

//>>>>plot indicators
p_mBB = plot(plotBB ? mBB0 : na, color=color.teal)
p_uBB = plot(plotBB ? uBB0 : na, color=color.teal, style=plot.style_stepline)
p_lBB = plot(plotBB ? lBB0 : na, color=color.teal, style=plot.style_stepline)


plot(sma(close,5), color=color.blue, title="MA")


//>>>>plot signals

plotshape(plotSignals and RSI_short, style=shape.triangledown, location=location.abovebar, color=color.red)
plotshape(plotSignals and RSI_long, style=shape.triangleup, location=location.belowbar, color=color.green)
plotshape(sl_cross, text= "Stoploss Hit",size= size.normal,style=shape.xcross , location=location.belowbar, color=color.red)

//>>>>plot signal high low
if strategy.position_size != 0
    candles_on_trade := candles_on_trade + 1

if strategy.position_size != 0 and candles_on_trade == 1
    line.new(x1=bar_index[1], y1=high[1], x2=bar_index[0], y2=high[1], color=color.black, width=2)
    line.new(x1=bar_index[1], y1=low[1],  x2=bar_index[0], y2=low[1],  color=color.black, width=2)


//>>>>end of program