Estrategia de backtesting de soporte y resistencia dinámicos
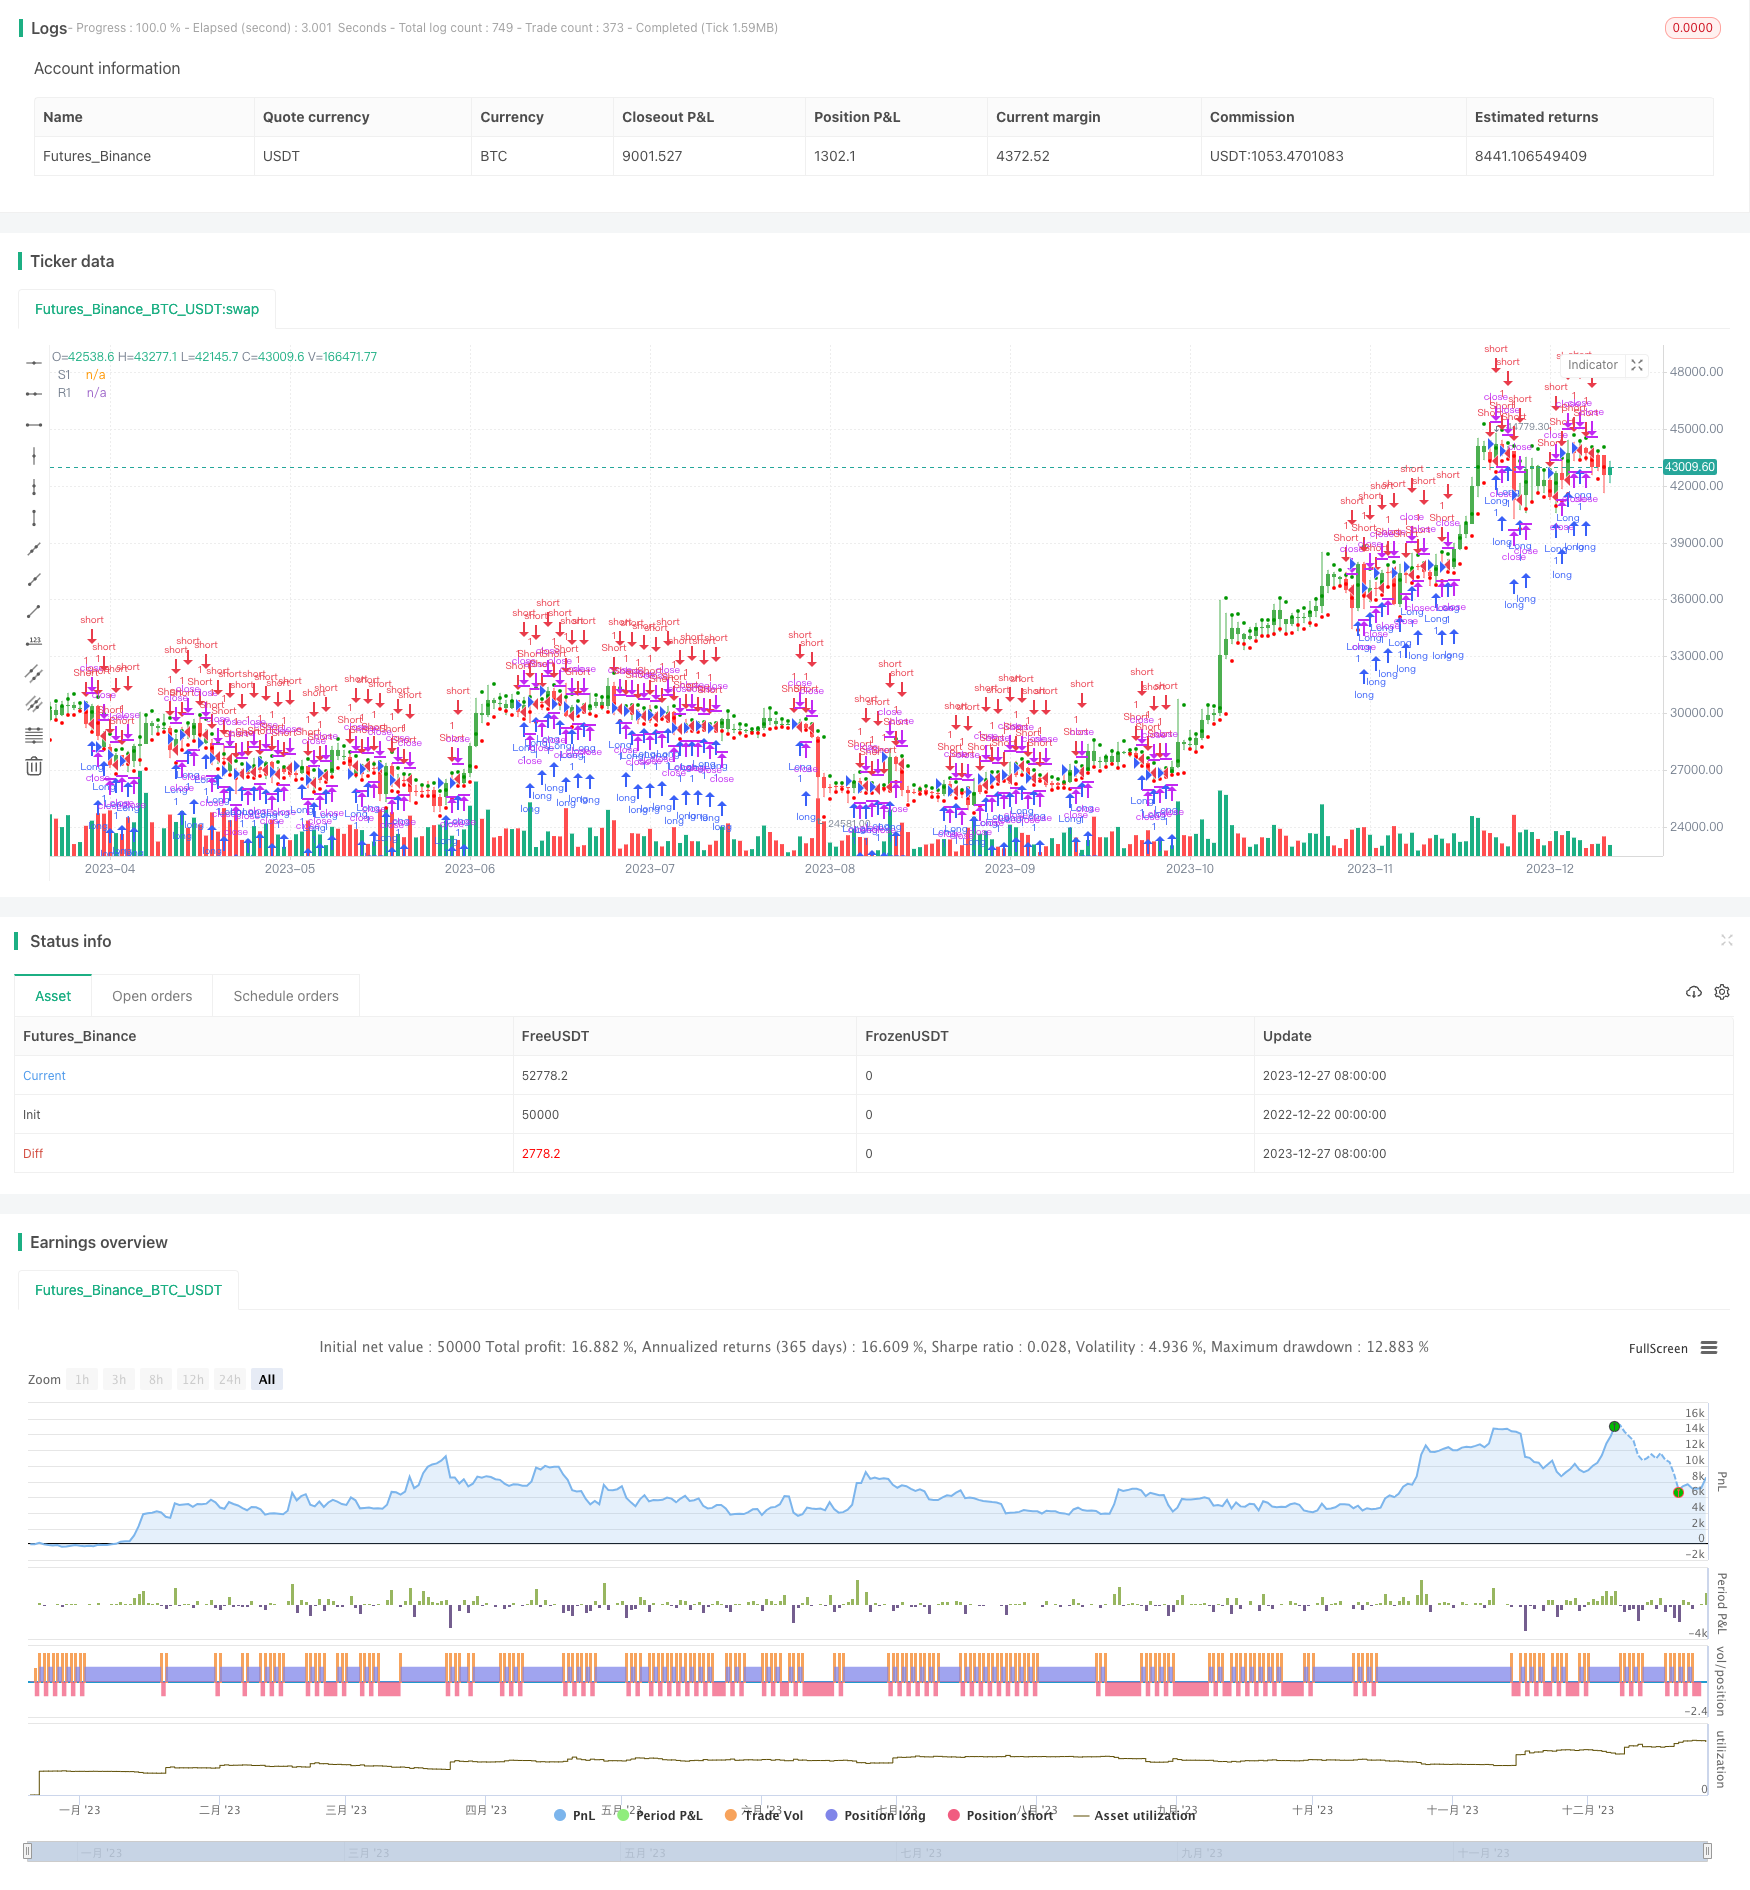
Descripción general
Esta estrategia se basa en los máximos, mínimos y resistencias de soporte calculados en el precio de cierre del día de negociación anterior para operar posiciones largas o cortas en el día de negociación actual. Haga más cuando el precio rompa la resistencia superior R1 y libre cuando el precio cae por debajo de la resistencia de soporte S1.
Principio de estrategia
- El soporte S1, la resistencia R1 y el punto central vPP se calculan a partir del precio máximo xHigh, el precio mínimo xLow y el precio de cierre xClose del día anterior.
vPP = (xHigh+xLow+xClose) / 3
vR1 = vPP+(vPP-xLow)
vS1 = vPP-(xHigh - vPP)
- Determina si el precio supera vR1 o vS1, si supera vR1 hace más, si cae vS1 hace vacío. El registro de POS hace más para hacer vacío.
pos = iff(close > vR1, 1,
iff(close < vS1, -1, nz(pos[1], 0)))
possig registra la dirección de la operación real. Si se activa la inversión de la operación reverse=true, la señal de negociación se revoca.
De acuerdo con la señal de possig, hacer más cuando se rompe vR1 y hacer vacío cuando se rompe vS1.
Ventajas estratégicas
- La estrategia utiliza indicadores de resistencia y soporte dinámicos para capturar las tendencias de ruptura.
- La resistencia de soporte se actualiza diariamente y es dinámica.
- Se puede elegir entre el comercio a la derecha o al revés, que se aplica a diferentes entornos de mercado.
- La idea de la estrategia es simple, clara y fácil de entender.
- La visualización muestra el soporte de la resistencia, y la intuición juzga el cambio de tendencia.
Análisis de riesgos
- Si la situación cambia, puede desencadenar varias señales innecesarias de compra y venta.
- En caso de un comportamiento de tendencia anormal, la resistencia de soporte puede extenderse después de la ruptura, causando pérdidas.
- El método de cálculo de los puntos centrales y los puntos de resistencia de soporte es más simple y se espera una optimización adicional.
La solución al riesgo:
- Ajuste adecuado del tamaño de las posiciones y control de las pérdidas individuales.
- Establezca un límite de pérdidas para evitar pérdidas superiores a las que pueda soportar.
- En combinación con otros indicadores de filtración de señales, evitar el comercio frecuente en situaciones de crisis.
Dirección de optimización
- Optimizar el método de cálculo de la resistencia de soporte para que sea más predictiva.
- La combinación de indicadores como tendencia, Momentum, etc., para evitar transacciones innecesarias.
- Aumentar las estrategias de stop loss y controlar las monedas y las pérdidas máximas.
- Combinado con métodos de aprendizaje automático, permite optimizar dinámicamente el cálculo de la resistencia de soporte.
Resumir
Esta estrategia se basa en un indicador de resistencia de soporte dinámico, para mantener posiciones en función de la dirección de la ruptura de precios. La estrategia es simple, fácil de entender y implementar, y puede capturar de manera efectiva los puntos de inflexión de la tendencia. Pero también existe cierto riesgo, que requiere una mayor optimización en combinación con otros indicadores para que la señal de negociación sea más precisa y confiable. En general, la estrategia es adecuada para ser utilizada como un indicador auxiliar de juicio, o como una de las estrategias básicas para cuantificar las operaciones.
//@version=2
////////////////////////////////////////////////////////////
//  Copyright by HPotter v1.0 14/06/2018
// This Pivot points is calculated on the current day.
// Pivot points simply took the high, low, and closing price from the previous period and
// divided by 3 to find the pivot. From this pivot, traders would then base their
// calculations for three support, and three resistance levels. The calculation for the most
// basic flavor of pivot points, known as ‘floor-trader pivots’, along with their support and
// resistance levels.
//
// You can change long to short in the Input Settings
// WARNING:
// - For purpose educate only
// - This script to change bars colors.
////////////////////////////////////////////////////////////
strategy(title="Dynamic Pivot Point Backtest", shorttitle="Dynamic Pivot Point", overlay = true)
reverse = input(false, title="Trade reverse")
xHigh  = request.security(syminfo.tickerid,"D", high[1])
xLow   = request.security(syminfo.tickerid,"D", low[1])
xClose = request.security(syminfo.tickerid,"D", close[1])
vPP = (xHigh+xLow+xClose) / 3
vR1 = vPP+(vPP-xLow)
vS1 = vPP-(xHigh - vPP)
pos = iff(close > vR1, 1,
       iff(close < vS1, -1, nz(pos[1], 0)))
possig = iff(reverse and pos == 1, -1,
          iff(reverse and pos == -1, 1, pos))
if (possig == 1)
    strategy.entry("Long", strategy.long)
if (possig == -1)
    strategy.entry("Short", strategy.short)
barcolor(possig == -1 ? red: possig == 1 ? green : blue )
plot(vS1, color=#ff0000, title="S1", style = circles, linewidth = 1)
plot(vR1, color=#009600, title="R1", style = circles, linewidth = 1)