Estrategia de stop loss dinámico con media móvil doble
Descripción general
La estrategia se basa en el cruce entre la media rápida y la media lenta para decidir si se toma una posición más baja. Se toma una posición más alta cuando la media rápida atraviesa la media lenta en la media rápida y se toma una posición más baja cuando la media rápida atraviesa la media lenta por debajo de la media rápida.
Principio de estrategia
La estrategia utiliza un promedio móvil simple rápido (SMA) y un SMA lento para decidir cuándo hacer una posición de equilibrio. Cuando el SMA rápido atraviesa el SMA lento, juzga que la tendencia se vuelve al alza y hace más; cuando el SMA rápido atraviesa el SMA lento, juzga que la tendencia se invierte y prepara una posición de equilibrio.
En busca de mayores ganancias, la estrategia introduce un mecanismo de seguimiento de la parada de pérdidas. Después de hacer más, en lugar de establecer una orden de parada de pérdidas en un precio fijo, se establece una orden de parada de pérdidas de seguimiento, que se sigue hacia arriba a medida que el precio aumenta, y cada vez que el precio aumenta una cierta proporción, el precio de parada de seguimiento se ajusta hacia arriba un cierto grado. Cuando el precio se reorienta y toca el precio de parada de seguimiento, se activa la orden de parada de pérdidas, para nivelar la posición.
En concreto, la fórmula para el seguimiento de los precios de parada es la siguiente:
Precio de seguimiento de pérdidas = precio × (1 - porcentaje de seguimiento de pérdidas)
El porcentaje de seguimiento de la pérdida de seguimiento se establece en la barra de parámetros de la estrategia. La estrategia calcula un nuevo precio de seguimiento de la pérdida de seguimiento cada vez que la línea K se cierra después de abrir la posición. El nuevo precio de seguimiento de la pérdida de seguimiento no puede ser inferior al precio de seguimiento de la pérdida de seguimiento de la línea K anterior, para asegurar que el precio de la pérdida de seguimiento solo se mueva hacia arriba y no hacia abajo.
Cuando el precio baja y toca el precio de seguimiento del stop loss, se activa la señal de posición plana y la posición utiliza la posición plana en el precio de mercado.
Ventajas estratégicas
- El uso de dos líneas de equilibrio para determinar la dirección de la tendencia es más eficaz en la retroalimentación.
- La adopción de un trazado de pérdidas para alcanzar mayores ganancias
- Período de línea media y amplitud de seguimiento de stop loss personalizables
- La línea de parada se desplaza constantemente hacia arriba en la tendencia al alza, asegurando la mayor parte de las ganancias
- En caso de cambio de tendencia, se puede detener rápidamente para evitar mayores pérdidas.
Riesgos y soluciones
- La hora de cruce de la línea media es incorrecta y puede causar señales virtuales. Se pueden probar diferentes parámetros para encontrar la combinación óptima de la línea media.
- El seguimiento de la parada de pérdidas es demasiado radical, lo que puede causar que la parada de pérdidas se rompa demasiado pronto. Se puede ajustar adecuadamente el parámetro de porcentaje de seguimiento de la parada de pérdidas
- Se recomienda combinar otros indicadores para juzgar la tendencia y evitar el comercio en situaciones de crisis
Dirección de optimización
- Se pueden probar diferentes parámetros de periodicidad lineal para encontrar la combinación óptima de parámetros
- Puede probar diferentes parámetros de seguimiento de pérdidas por ciento para encontrar el nivel óptimo de pérdidas
- Puede agregar otros indicadores para evaluar, suspender el comercio en situaciones de crisis y evitar ser afectado por eventos inesperados.
Resumir
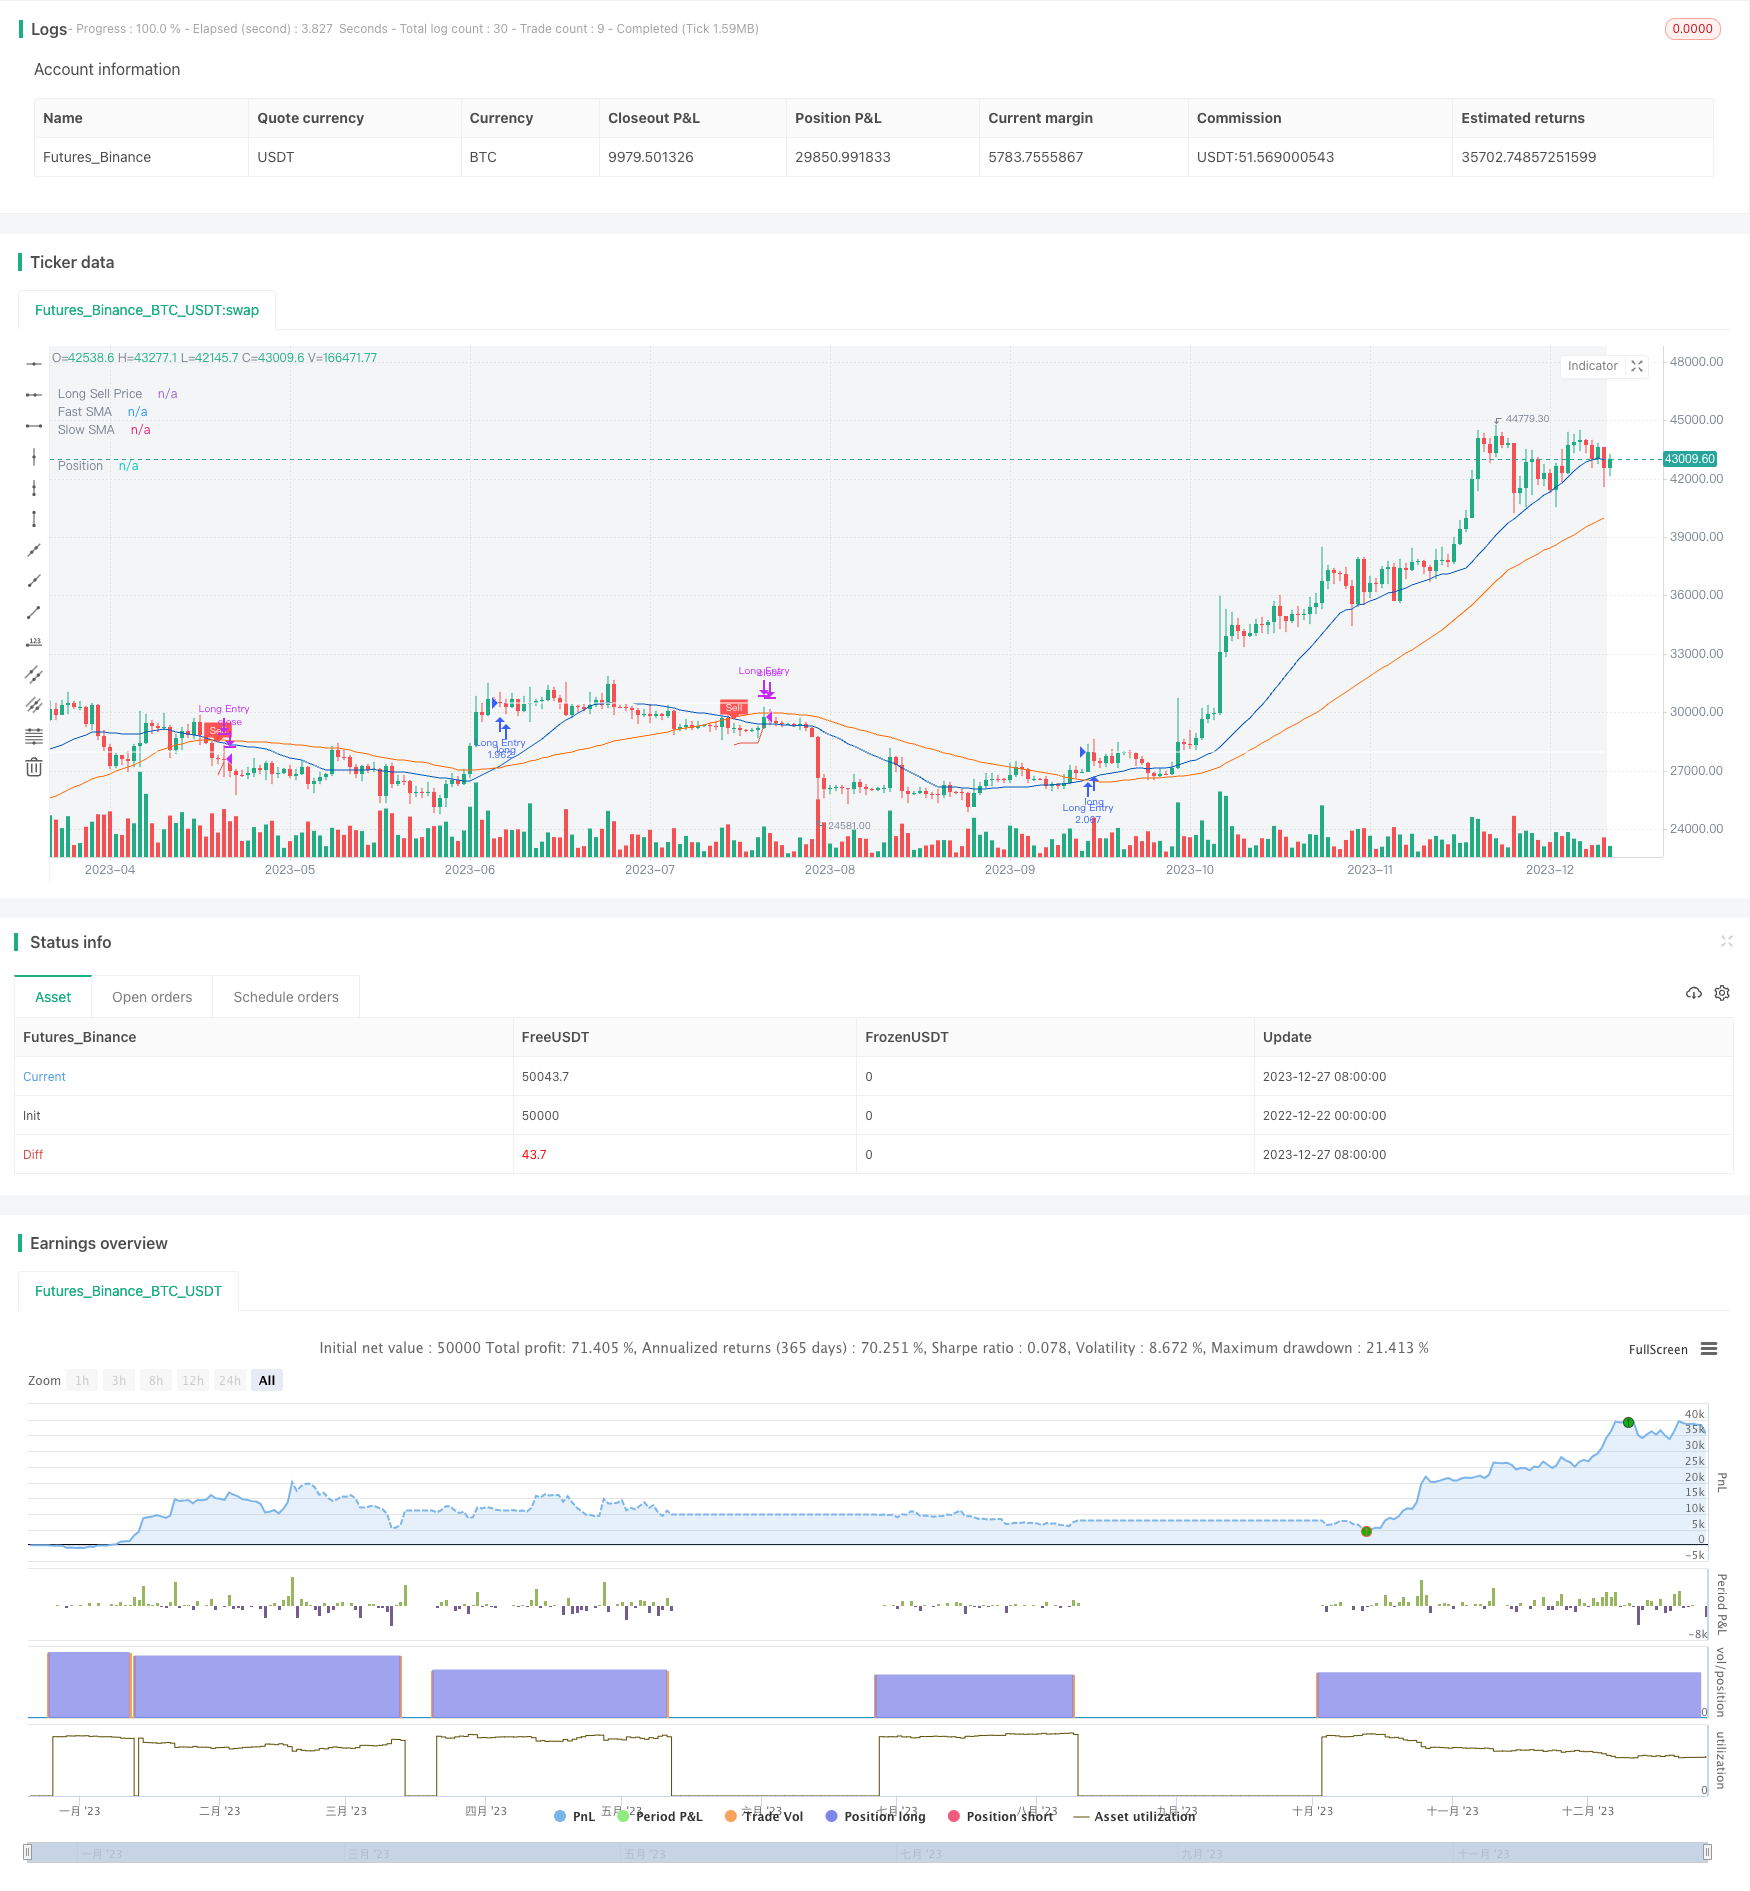
Esta estrategia combina el uso de indicadores de línea media para determinar la dirección de la tendencia, y el seguimiento de los mecanismos de detención de pérdidas para bloquear los beneficios, y se desempeña bien en los datos de entrenamiento. Se espera obtener ganancias estables mediante la optimización de la combinación de parámetros, el control del riesgo.
/*backtest
start: 2022-12-22 00:00:00
end: 2023-12-28 00:00:00
period: 1d
basePeriod: 1h
exchanges: [{"eid":"Futures_Binance","currency":"BTC_USDT"}]
*/

//@version=5
//
// ▒▒▒▒▒▒▒▒▒▒▒▒▒▒▒▒▒▒▒▒▒▒▒▒▒▒▒▒▒▒▒▒▒▒▒▒▒▒▒▒▒▒▒▒▒▒▒▒▒▒▒▒▒▒▒▒▒▒▒▒▒▒▒▒▒▒▒▒▒▒▒▒▒▒▒▒▒▒▒▒▒▒▒▒▒▒▒▒▒▒▒▒▒▒▒▒▒▒▒▒▒▒▒▒▒▒▒▒▒▒▒▒▒▒
//  -----------------------------------------------------------------------------
//  Copyright 2022 Iason Nikolas | jason5480
//  Trailing Buy script may be freely distributed under the MIT license.
//
//  Permission is hereby granted, free of charge,
//  to any person obtaining a copy of this software and associated documentation files (the "Software"),
//  to deal in the Software without restriction, including without limitation the rights to use, copy, modify, merge,
//  publish, distribute, sublicense, and/or sell copies of the Software, and to permit persons to whom the Software is furnished to do so,
//  subject to the following conditions:
//
//  The above copyright notice and this permission notice shall be included in all copies or substantial portions of the Software.
//
//  THE SOFTWARE IS PROVIDED "AS IS", WITHOUT WARRANTY OF ANY KIND,
//  EXPRESS OR IMPLIED, INCLUDING BUT NOT LIMITED TO THE WARRANTIES OF MERCHANTABILITY,
//  FITNESS FOR A PARTICULAR PURPOSE AND NONINFRINGEMENT. IN NO EVENT SHALL THE AUTHORS OR COPYRIGHT HOLDERS BE LIABLE FOR ANY CLAIM,
//  DAMAGES OR OTHER LIABILITY, WHETHER IN AN ACTION OF CONTRACT, TORT OR OTHERWISE, ARISING FROM,
//  OUT OF OR IN CONNECTION WITH THE SOFTWARE OR THE USE OR OTHER DEALINGS IN THE SOFTWARE.
//
//  -----------------------------------------------------------------------------
//
//  Authors:  @jason5480
//  Revision: v1.0.1
//  Date:     24-Feb-2022
//
//  Description
//  =============================================================================
//  This strategy will go long if fast MA crosses over slow MA.
//  If the 'Enable Trailing` is checked then the strategy instead of exiting from the position
//  directly it will follow the price upwards (percentagewise) with small steps
//  If the price drops by this percentage then the exit order will be executed
//
//  The strategy has the following parameters:
//
//  Fast SMA Length - How many candles back to calculte the fast SMA.
//  Slow SMA Length - How many candles back to calculte the slow SMA.
//  Enable Trailing - Enable or disable the trailing
//  Deviation % - The step to follow the price when the open position condition is met.
//  Source Exit Control - The source price to compare with the exit price to trigger the exit order when trailing.
//
//  -----------------------------------------------------------------------------
//  Disclaimer:
//    1. I am not licensed financial advisors or broker dealer. I do not tell you
//       when or what to buy or sell. I developed this software which enables you
//       execute manual or automated using TradingView. The
//       software allows you to set the criteria you want for entering and exiting
//       trades.
//    2. Do not trade with money you cannot afford to lose.
//    3. I do not guarantee consistent profits or that anyone can make money with no
//       effort. And I am not selling the holy grail.
//    4. Every system can have winning and losing streaks.
//    5. Money management plays a large role in the results of your trading. For
//       example: lot size, account size, broker leverage, and broker margin call
//       rules all have an effect on results. Also, your Take Profit and Stop Loss
//       settings for individual pair trades and for overall account equity have a
//       major impact on results. If you are new to trading and do not understand
//       these items, then I recommend you seek education materials to further your
//       knowledge.
//
//    YOU NEED TO FIND AND USE THE TRADING SYSTEM THAT WORKS BEST FOR YOU AND YOUR
//    TRADING TOLERANCE.
//
//    I HAVE PROVIDED NOTHING MORE THAN A TOOL WITH OPTIONS FOR YOU TO TRADE WITH THIS PROGRAM ON TRADINGVIEW.
//
//    I accept suggestions to improve the script.
//    If you encounter any problems I will be happy to share with me.
//  -----------------------------------------------------------------------------
//
// ▒▒▒▒▒▒▒▒▒▒▒▒▒▒▒▒▒▒▒▒▒▒▒▒▒▒▒▒▒▒▒▒▒▒▒▒▒▒▒▒▒▒▒▒▒▒▒▒▒▒▒▒▒▒▒▒▒▒▒▒▒▒▒▒▒▒▒▒▒▒▒▒▒▒▒▒▒▒▒▒▒▒▒▒▒▒▒▒▒▒▒▒▒▒▒▒▒▒▒▒▒▒▒▒▒▒▒▒▒▒▒▒▒▒
// SETUP ============================================================================================================

strategy(title = 'Trailing Sell',
         shorttitle = 'TS',
         overlay = true,
         pyramiding = 0,
         default_qty_type = strategy.percent_of_equity,
         default_qty_value = 100,
         initial_capital = 100000)

//
// ▒▒▒▒▒▒▒▒▒▒▒▒▒▒▒▒▒▒▒▒▒▒▒▒▒▒▒▒▒▒▒▒▒▒▒▒▒▒▒▒▒▒▒▒▒▒▒▒▒▒▒▒▒▒▒▒▒▒▒▒▒▒▒▒▒▒▒▒▒▒▒▒▒▒▒▒▒▒▒▒▒▒▒▒▒▒▒▒▒▒▒▒▒▒▒▒▒▒▒▒▒▒▒▒▒▒▒▒▒▒▒▒▒▒
// FILTERS ==========================================================================================================

// INPUT ============================================================================================================
usefromDate = input.bool(defval = true, title = 'From', inline = "From Date", group = "Filters")
fromDate = input(defval = timestamp('01 Jan 2021 00:00 UTC'), title = '', inline = "From Date", group = 'Filters')
usetoDate = input.bool(defval = false, title = 'To ', inline = "To Date", group = "Filters")
toDate = input(defval = timestamp('31 Dec 2121 23:59 UTC'), title = '', inline = "To Date", group = 'Filters')

// LOGIC ============================================================================================================
isWithinPeriod() => true // create function "within window of time"

// PLOT =============================================================================================================
bgcolor(color = isWithinPeriod() ? color.new(color.gray, 90) : na, title = 'Period')

//
// ▒▒▒▒▒▒▒▒▒▒▒▒▒▒▒▒▒▒▒▒▒▒▒▒▒▒▒▒▒▒▒▒▒▒▒▒▒▒▒▒▒▒▒▒▒▒▒▒▒▒▒▒▒▒▒▒▒▒▒▒▒▒▒▒▒▒▒▒▒▒▒▒▒▒▒▒▒▒▒▒▒▒▒▒▒▒▒▒▒▒▒▒▒▒▒▒▒▒▒▒▒▒▒▒▒▒▒▒▒▒▒▒▒▒
// STRATEGY =========================================================================================================

// INPUT ============================================================================================================
fastMALen = input.int(defval = 21, title = 'Fast/Slow SMA Length', inline = 'MA Length', group = 'Strategy')
slowMALen = input.int(defval = 49, title = '', tooltip = 'How many candles back to calculte the fast/slow SMA.', inline = 'MA Length', group = 'Strategy')

// LOGIC ============================================================================================================
fastMA = ta.sma(close, fastMALen)
slowMA = ta.sma(close, slowMALen)

bool openLongPosition = isWithinPeriod() and ta.crossover(fastMA, slowMA)
bool closeLongPosition = ta.crossunder(fastMA, slowMA)

// PLOT =============================================================================================================
var fastColor = color.new(#0056BD, 0)
plot(series = fastMA, title = 'Fast SMA', color = fastColor, linewidth = 1, style = plot.style_line)
var slowColor = color.new(#FF6A00, 0)
plot(series = slowMA, title = 'Slow SMA', color = slowColor, linewidth = 1, style = plot.style_line)

plotshape(series = closeLongPosition and strategy.position_size > 0 ? fastMA : na, title = 'Sell', text = 'Sell', style = shape.labeldown, location = location.absolute, color = color.new(color.red, 0), textcolor = color.new(color.white, 0), size = size.tiny)

//
// ▒▒▒▒▒▒▒▒▒▒▒▒▒▒▒▒▒▒▒▒▒▒▒▒▒▒▒▒▒▒▒▒▒▒▒▒▒▒▒▒▒▒▒▒▒▒▒▒▒▒▒▒▒▒▒▒▒▒▒▒▒▒▒▒▒▒▒▒▒▒▒▒▒▒▒▒▒▒▒▒▒▒▒▒▒▒▒▒▒▒▒▒▒▒▒▒▒▒▒▒▒▒▒▒▒▒▒▒▒▒▒▒▒▒
// EXIT ============================================================================================================

// INPUT ============================================================================================================
enableTrailing = input.bool(defval = true, title = 'Enable Trailing', tooltip = 'Enable or disable the trailing for exit position.', group = 'Exit')
devExitPerc = input.float(defval = 3.0, title = 'Deviation %', minval = 0.01, maxval = 100, step = 0.05, tooltip = 'The step to follow the price when the open position condition is met.', group = 'Exit') / 100
ctrLongExitSrc = input.source(defval = low, title = 'Source Exit Control', tooltip = 'The source price to compare with the exit price to trigger the exit order when trailing.', group = 'Exit')

// LOGIC ============================================================================================================
var bool exitLongPosition = false

int barsSinceOpenLong = nz(ta.barssince(openLongPosition), 999999)
int barsSinceCloseLong = nz(ta.barssince(closeLongPosition), 999999)
int barsSinceExitLong = nz(ta.barssince(exitLongPosition), 999999)
bool closeLongIsActive = barsSinceOpenLong >= barsSinceCloseLong
bool exitLongIsPending = barsSinceExitLong >= barsSinceCloseLong
bool tryExitLongPosition = isWithinPeriod() and closeLongIsActive and exitLongIsPending

float longExitPrice = na
longExitPrice := if closeLongPosition and strategy.position_size > 0
    close * (1 - devExitPerc)
else if tryExitLongPosition
    math.max(high * (1 - devExitPerc), nz(longExitPrice[1], 999999))
else
    na

exitLongPosition := enableTrailing ? isWithinPeriod() and ta.crossunder(closeLongPosition ? close : ctrLongExitSrc, longExitPrice) : closeLongPosition

// PLOT =============================================================================================================
var sellPriceColor = color.new(#e25141, 0)
plot(series = enableTrailing ? longExitPrice : na, title = 'Long Sell Price', color = sellPriceColor, linewidth = 1, style = plot.style_linebr)

//
// ▒▒▒▒▒▒▒▒▒▒▒▒▒▒▒▒▒▒▒▒▒▒▒▒▒▒▒▒▒▒▒▒▒▒▒▒▒▒▒▒▒▒▒▒▒▒▒▒▒▒▒▒▒▒▒▒▒▒▒▒▒▒▒▒▒▒▒▒▒▒▒▒▒▒▒▒▒▒▒▒▒▒▒▒▒▒▒▒▒▒▒▒▒▒▒▒▒▒▒▒▒▒▒▒▒▒▒▒▒▒▒▒▒▒
// POSITION ORDERS ==================================================================================================

// LOGIC ============================================================================================================
// getting into LONG position
strategy.entry(id = 'Long Entry', direction = strategy.long, when = openLongPosition, alert_message = 'Long(' + syminfo.ticker + '): Started')
// submit close order on trend reversal
strategy.close(id = 'Long Entry', when = exitLongPosition, comment = 'Close Long', alert_message = 'Long(' + syminfo.ticker + '): Closed at market price')

// PLOT =============================================================================================================
var posColor = color.new(color.white, 0)
plot(series = strategy.position_avg_price, title = 'Position', color = posColor, linewidth = 1, style = plot.style_linebr)

// ==================================================================================================================