Estrategia de zona de transición
Descripción general
La estrategia de intervalo de transición es una estrategia de negociación de líneas cortas basada en intervalos de fluctuación de precios. Utiliza intervalos de fluctuación que se forman en los precios durante un período de tiempo determinado para juzgar la tendencia del mercado y entrar en una posición de venta / cancelación cuando se rompe el intervalo.
Principio de estrategia
La estrategia construye un intervalo de fluctuación de precios calculando los máximos y mínimos de las líneas K de N-root anteriores. Cuando la línea K más reciente penetra este intervalo, se determina que la tendencia se ha invertido y se genera una señal de negociación.
Concretamente, la estrategia sigue el máximo y mínimo de la última N-raíz de la línea K ((parámetros ajustables N), donde:
- El precio mínimo = el punto más bajo en la línea de N raíz K pasado
- El precio más alto = el punto más alto en la línea N raíz K anterior
Esto crea una zona de fluctuación de los precios.
Cuando el precio de cierre de la línea K más reciente es superior al precio más alto de la franja, indica una ruptura de la franja y genera una señal de multitarea; cuando el precio de cierre de la línea K más reciente es inferior al precio más bajo de la franja, indica una ruptura de la franja y genera una señal de brecha.
Además, la estrategia también incluye filtros de color y filtros de entidad. El filtro de color filtra la señal según el color de la línea K; el filtro de entidad filtra la señal según el tamaño de la entidad de la línea K. Esto puede filtrar algunas señales falsas.
Ventajas estratégicas
La estrategia tiene las siguientes ventajas:
- Capturar el intervalo de precios, determinar el punto de inflexión de la tendencia, hacer más deuda al descubierto con precisión
- Filtración de color y de entidad, que puede filtrar falsas señales
- La lógica de la política es simple y clara, y los parámetros son fáciles de entender y ajustar
- Más parámetros ajustables para optimizar las estrategias
Análisis de riesgos
La estrategia también tiene sus riesgos:
- La configuración incorrecta de los parámetros puede provocar transacciones demasiado frecuentes y generar tarifas de transacción excesivas
- Rango de intervalo mal configurado, puede causar demasiadas falsas señales de ruptura de intervalo
- La predicción de la franja de precios es menos efectiva cuando las cosas fluctúan mucho
- No se puede manejar la brecha de precios
Estos riesgos pueden reducirse mediante ajustes en los parámetros de intervalo y la optimización de las condiciones de filtración de la señal.
Dirección de optimización
La estrategia puede ser optimizada en las siguientes direcciones:
- El rango de los rangos de precios se ajusta dinámicamente, en lugar de una línea N-K fija
- La inclusión de la lógica de stop loss para reducir el riesgo de pérdidas
- Optimización de parámetros de filtro para mejorar la calidad de la señal
- Aumentar la lógica de manejo de las brechas de precios
- Combinación de señales de juicio de varios períodos de tiempo para evitar ser engañado
Resumir
La estrategia de la zona de transición es una estrategia de comercio de línea corta más simple y práctica en general. Se puede aprovechar rápidamente la oportunidad de mercado mediante la determinación de los puntos de cambio de tendencia a través de la zona de precios. También hay algunos riesgos que deben tenerse en cuenta.
/*backtest
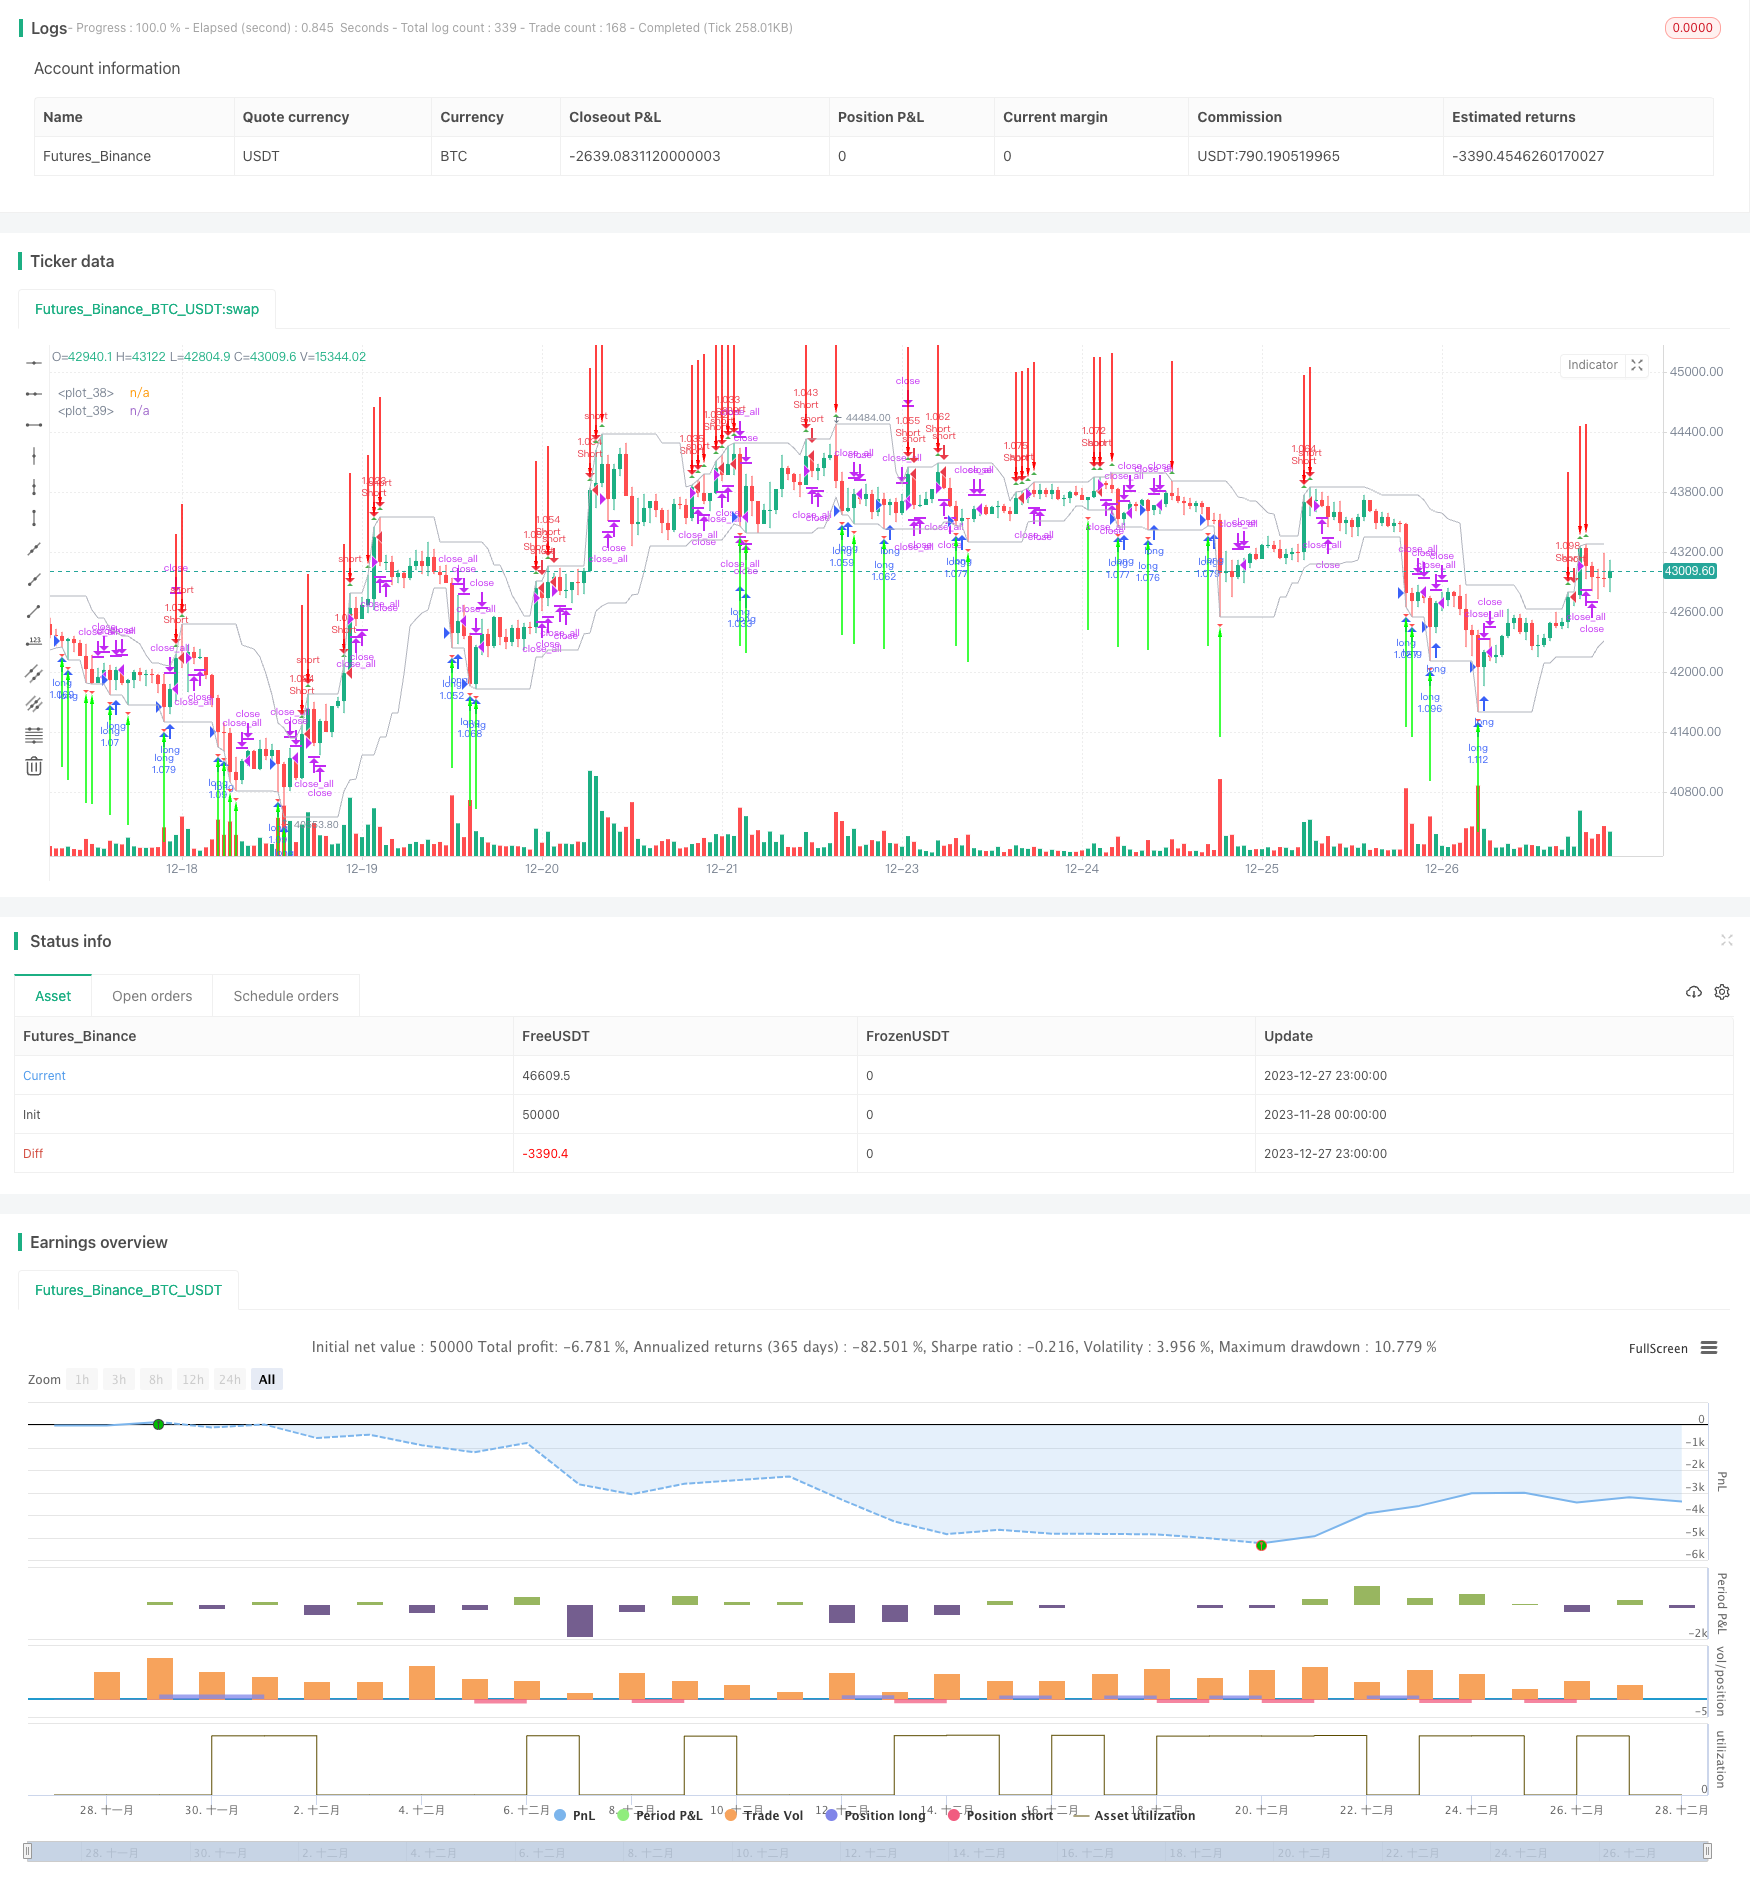
start: 2023-11-28 00:00:00
end: 2023-12-28 00:00:00
period: 1h
basePeriod: 15m
exchanges: [{"eid":"Futures_Binance","currency":"BTC_USDT"}]
*/
//Noro
//2018
//@version=2
strategy("Noro's Transient Zones Strategy v1.0", shorttitle = "TZ str 1.0", overlay=true, default_qty_type = strategy.percent_of_equity, default_qty_value = 100, pyramiding = 0)
//Settings
needlong = input(true, defval = true, title = "Long")
needshort = input(true, defval = true, title = "Short")
capital = input(100, defval = 100, minval = 1, maxval = 10000, title = "Capital, %")
usecol = input(true, defval = true, title = "Use Color-Filter")
usebod = input(true, defval = true, title = "Use Body-Filter")
h_left = input(title = "H left", defval = 10)
h_right = -1
sample_period = input(title = "Sample bars for % TZ", defval = 5000)
show_ptz = input(title = "Show PTZ", type = bool, defval = true)
show_channel = input(title = "Show channel", type = bool, defval = true)
fromyear = input(2018, defval = 2018, minval = 1900, maxval = 2100, title = "From Year")
toyear = input(2100, defval = 2100, minval = 1900, maxval = 2100, title = "To Year")
frommonth = input(01, defval = 01, minval = 01, maxval = 12, title = "From Month")
tomonth = input(12, defval = 12, minval = 01, maxval = 12, title = "To Month")
fromday = input(01, defval = 01, minval = 01, maxval = 31, title = "From day")
today = input(31, defval = 31, minval = 01, maxval = 31, title = "To day")
//By Jurij w/ TZ percent occurrence by SPYderCrusher
//barCount = nz(barCount[1]) + 1
//check history and realtime PTZ
h_left_low = lowest(h_left)
h_left_high = highest(h_left)
newlow = low <= h_left_low
newhigh = high >= h_left_high
plotshape(newlow and show_ptz, style=shape.triangledown, location=location.belowbar, color=red)
plotshape(newhigh and show_ptz, style=shape.triangleup, location=location.abovebar, color=green)
channel_high = plot(show_channel ? h_left_low : 0, color=silver)
channel_low = plot (show_channel ? h_left_high : 0, color=silver)
//check true TZ back in history
central_bar_low = low[h_right + 1]
central_bar_high = high[h_right + 1]
full_zone_low = lowest(h_left + h_right + 1)
full_zone_high = highest(h_left + h_right + 1)
central_bar_is_highest = central_bar_high >= full_zone_high
central_bar_is_lowest = central_bar_low <= full_zone_low
plotarrow(central_bar_is_highest ? -1 : 0, offset=-h_right-1)
plotarrow(central_bar_is_lowest ? 1 : 0, offset=-h_right-1)
//Color Filter
bar = close > open ? 1 : close < open ? -1 : 0
//Body Filter
nbody = abs(close - open)
abody = sma(nbody, 10)
body = nbody > abody / 3 or usebod == false
//Signals
up1 = central_bar_is_lowest and body and (bar == -1 or usecol == false)
dn1 = central_bar_is_highest and body and (bar == 1 or usecol == false)
exit = ((strategy.position_size > 0 and close > open) or (strategy.position_size < 0 and close < open)) and body
//Trading
lot = strategy.position_size == 0 ? strategy.equity / close * capital / 100 : lot[1]
if up1
if strategy.position_size < 0
strategy.close_all()
strategy.entry("long", strategy.long, needlong == false ? 0 : lot, when=(time > timestamp(fromyear, frommonth, fromday, 00, 00) and time < timestamp(toyear, tomonth, today, 23, 59)))
if dn1
if strategy.position_size > 0
strategy.close_all()
strategy.entry("Short", strategy.short, needshort == false ? 0 : lot, when=(time > timestamp(fromyear, frommonth, fromday, 00, 00) and time < timestamp(toyear, tomonth, today, 23, 59)))
if time > timestamp(toyear, tomonth, today, 23, 59) or exit
strategy.close_all()