Estrategia de seguimiento de tendencias de media móvil de Kaufman adaptativa
Descripción general
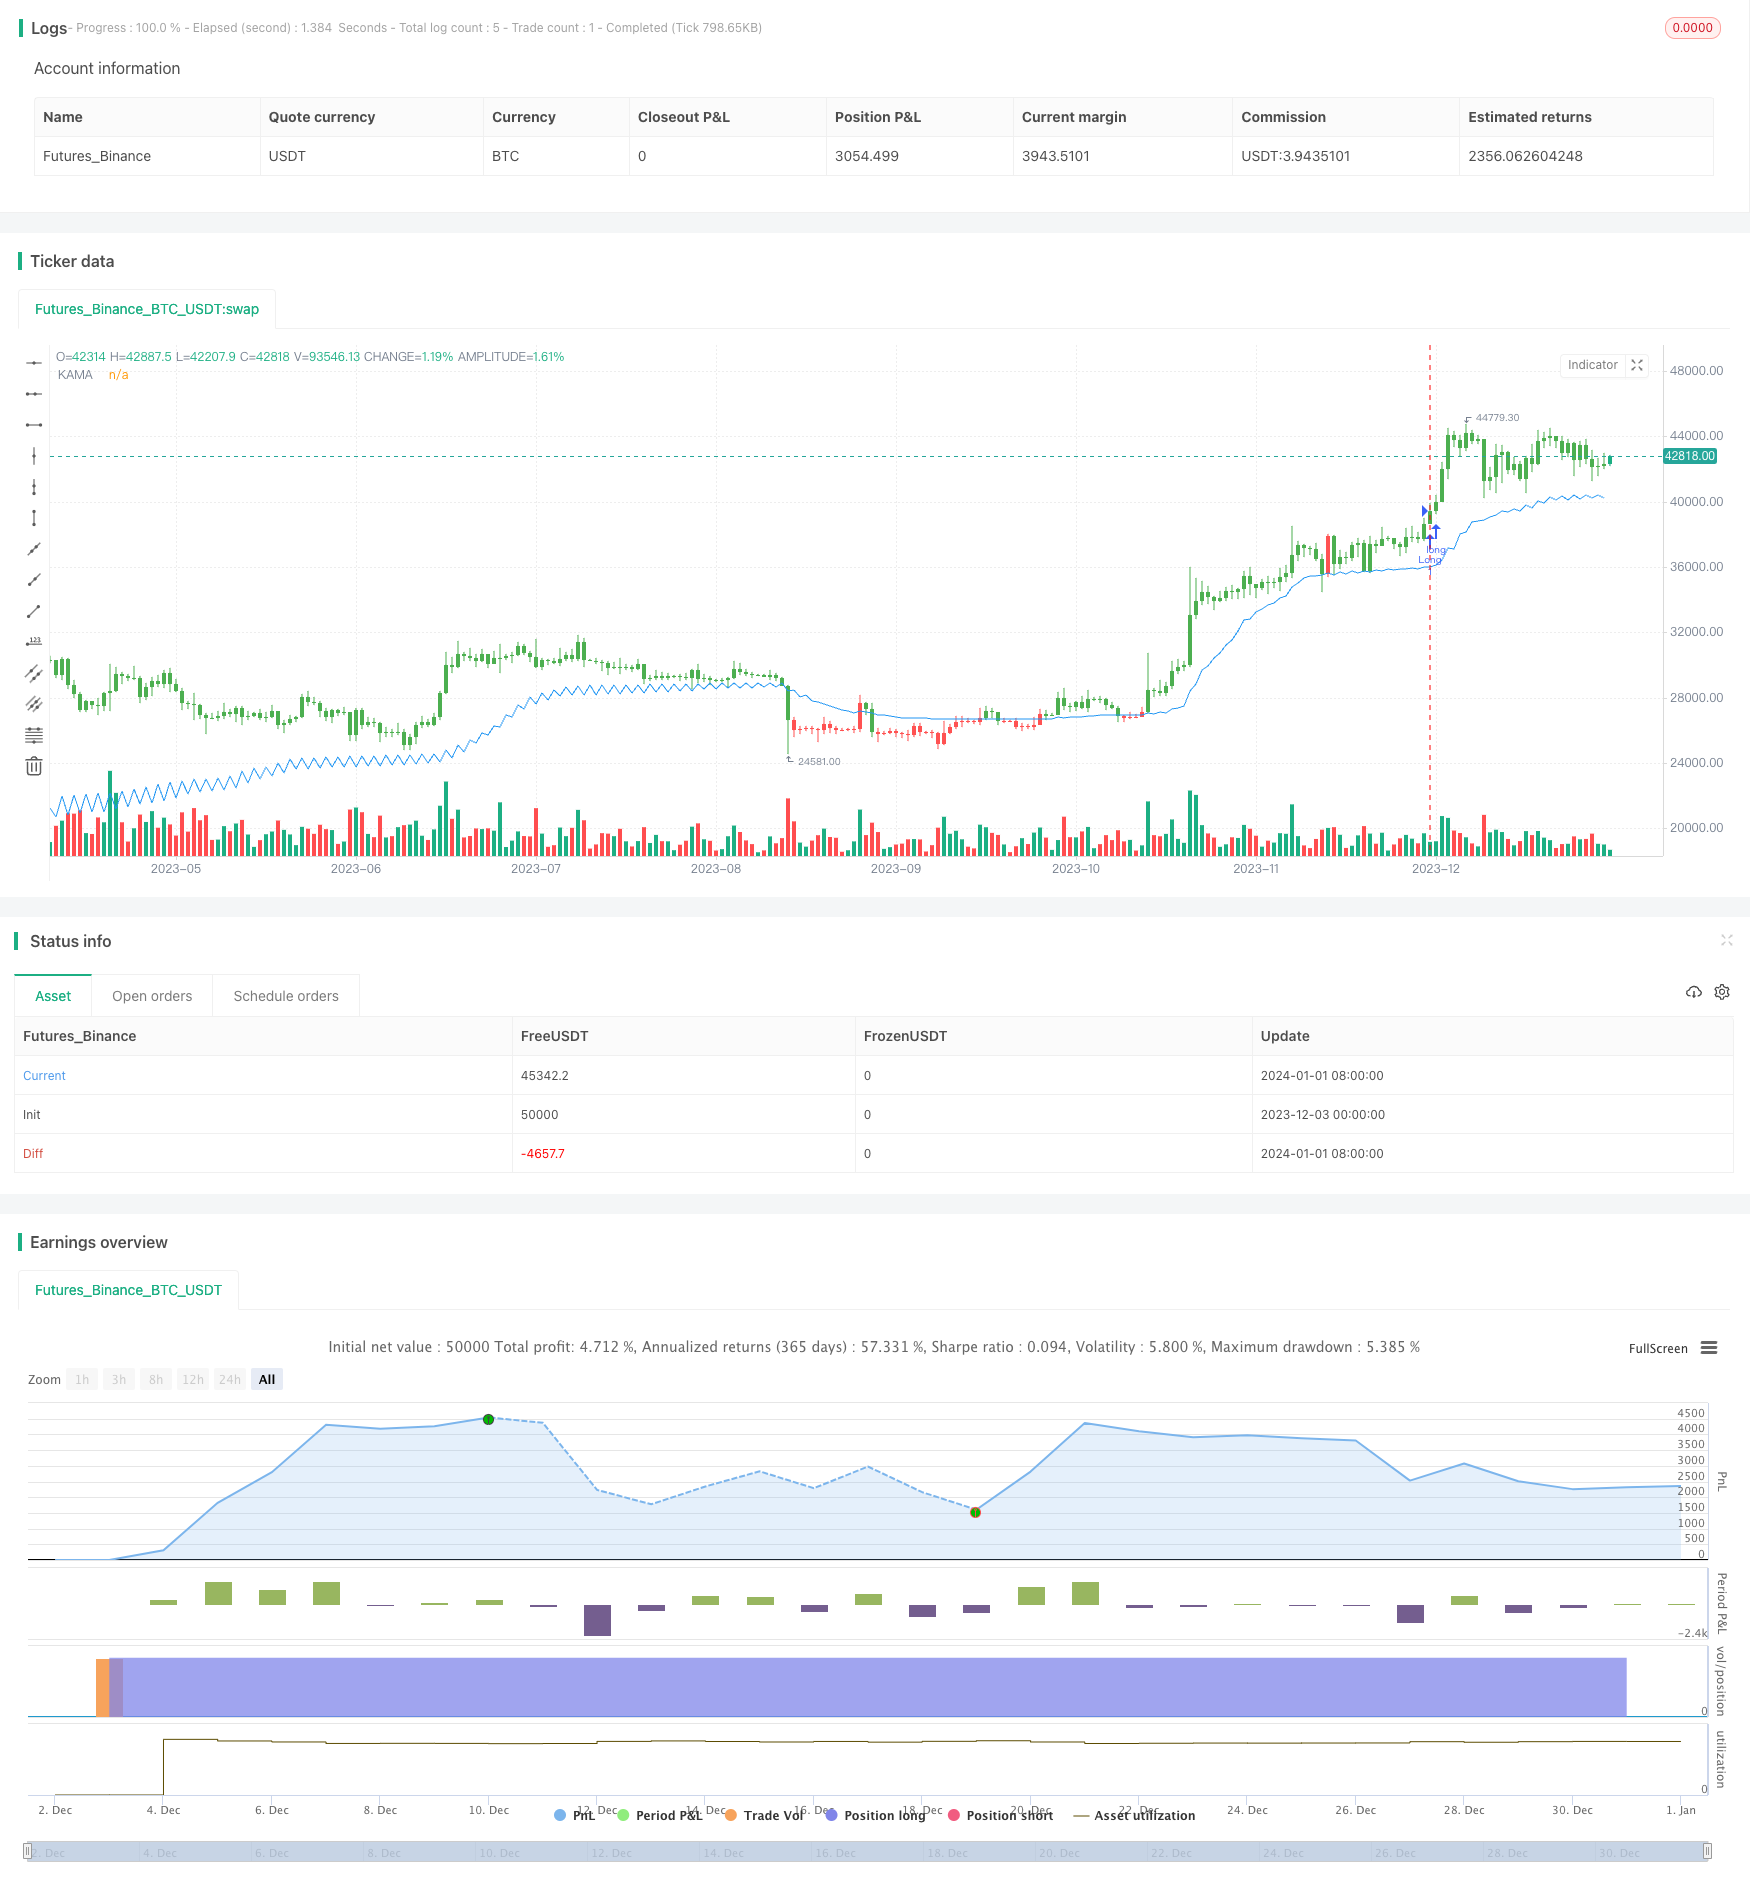
La estrategia utiliza el indicador de media móvil adaptada Kaufman (KAMA) para seguir la tendencia de los precios y lograr una venta baja y alta y obtener ganancias.
Principio de estrategia
La fórmula de cálculo para el indicador de las medias móviles adaptadas a Kaufman (KAMA) es:
nAMA = nz(nAMA[1]) + nsmooth * (Close - nz(nAMA[1]))

其中:

nsmooth = (nefratio * (nfastend - nslowend) + nslowend)^2

nefratio = nsignal / nnoise

nsignal = |Close - Close[Length]|

nnoise = sum(|Close - Close[1]|, Length)

nfastend = 0.666

nslowend = 0.0645
El conjunto de indicadores tiene en cuenta la volatilidad del mercado y la tendencia de los cambios de precios, lo que permite un seguimiento más rápido de las tendencias de los precios. En concreto:
- Cuando la volatilidad del mercado es menor, nsmooth se acerca a nslowend, y la línea KAMA cambia lentamente, lo que inhibe el ruido del mercado.
- Cuando las fluctuaciones del mercado se intensifican y las tendencias aparecen, nsmooth se acerca a nfastend, la línea KAMA cambia rápidamente y sigue la tendencia.
Al comparar la relación entre el precio y el KAMA, se puede determinar la dirección de la tendencia del precio para decidir hacer más caídas.
Ventajas estratégicas
La mayor ventaja de esta estrategia es que el uso de indicadores de medias móviles adaptables para rastrear los cambios en la tendencia de los precios puede reducir el impacto del ruido de manera efectiva. Las ventajas específicas son las siguientes:
- El índice KAMA reduce el ruido del mercado y reduce el número de combinaciones de transacciones innecesarias.
- El índice KAMA puede responder rápidamente a las tendencias de los cambios en los precios y rastrear el efecto.
- Las reglas para la toma de decisiones estratégicas son simples, claras, fáciles de entender e implementar.
- Se puede configurar para invertir y adaptarse a diferentes entornos de mercado.
Riesgo estratégico
La estrategia también tiene sus riesgos:
- En situaciones de convulsiones, el indicador KAMA puede presentar señales de error. Se puede optimizar el efecto del indicador ajustando los parámetros.
- Hay retrasos en el seguimiento y se puede haber pasado por alto una reversión de precios a corto plazo. El diagnóstico puede combinarse con otros indicadores, según corresponda.
- Sin tener en cuenta las comisiones de transacción y los puntos de deslizamiento, el efecto del disco duro es menor que el de la retroalimentación.
Dirección de optimización de la estrategia
La estrategia también puede ser optimizada en los siguientes aspectos:
- Optimización de los parámetros KAMA para mejorar la sensibilidad de seguimiento de los indicadores.
- Aumentar el mecanismo de stop loss para controlar las pérdidas máximas de una sola transacción.
- En combinación con otros indicadores, las señales de filtración mejoran la precisión de la toma de decisiones.
- Añadir un mecanismo de reingreso para seguir las tendencias.
Resumir
Esta estrategia utiliza el indicador de media móvil adaptado a Kaufman para seguir la tendencia de los precios, las reglas de decisión son simples y claras, y el funcionamiento en el entorno es fácil. El indicador reprime el ruido y responde rápidamente a los cambios en los precios, y el seguimiento es efectivo.
/*backtest
start: 2023-12-03 00:00:00
end: 2024-01-02 00:00:00
period: 1d
basePeriod: 1h
exchanges: [{"eid":"Futures_Binance","currency":"BTC_USDT"}]
*/

//@version=2
////////////////////////////////////////////////////////////
//  Copyright by HPotter v1.0 25/08/2017
// Everyone wants a short-term, fast trading trend that works without large
// losses. That combination does not exist. But it is possible to have fast
// trading trends in which one must get in or out of the market quickly, but
// these have the distinct disadvantage of being whipsawed by market noise
// when the market is volatile in a sideways trending market. During these
// periods, the trader is jumping in and out of positions with no profit-making
// trend in sight. In an attempt to overcome the problem of noise and still be
// able to get closer to the actual change of the trend, Kaufman developed an
// indicator that adapts to market movement. This indicator, an adaptive moving
// average (AMA), moves very slowly when markets are moving sideways but moves
// swiftly when the markets also move swiftly, change directions or break out of
// a trading range.
//
// You can change long to short in the Input Settings
// Please, use it only for learning or paper trading. Do not for real trading.
////////////////////////////////////////////////////////////
strategy(title="Kaufman Moving Average Adaptive (KAMA)", shorttitle="Kaufman Moving Average Adaptive (KAMA)", overlay = true)
Length = input(21, minval=1)
xPrice = close
xvnoise = abs(xPrice - xPrice[1])
nfastend = 0.666
nslowend = 0.0645
reverse = input(false, title="Trade reverse")
nsignal = abs(xPrice - xPrice[Length])
nnoise = sum(xvnoise, Length)
nefratio = iff(nnoise != 0, nsignal / nnoise, 0)
nsmooth = pow(nefratio * (nfastend - nslowend) + nslowend, 2)
nAMA = nz(nAMA[1]) + nsmooth * (xPrice - nz(nAMA[1]))
pos = iff(close[1] > nAMA, 1,
	   iff(close[1] < nAMA, -1, nz(pos[1], 0)))
possig = iff(reverse and pos == 1, -1,
          iff(reverse and pos == -1, 1, pos))
if (possig == 1)
    strategy.entry("Long", strategy.long)
if (possig == -1)
    strategy.entry("Short", strategy.short)
barcolor(possig == -1 ? red: possig == 1 ? green : blue )
plot(nAMA, color=blue, title="KAMA")