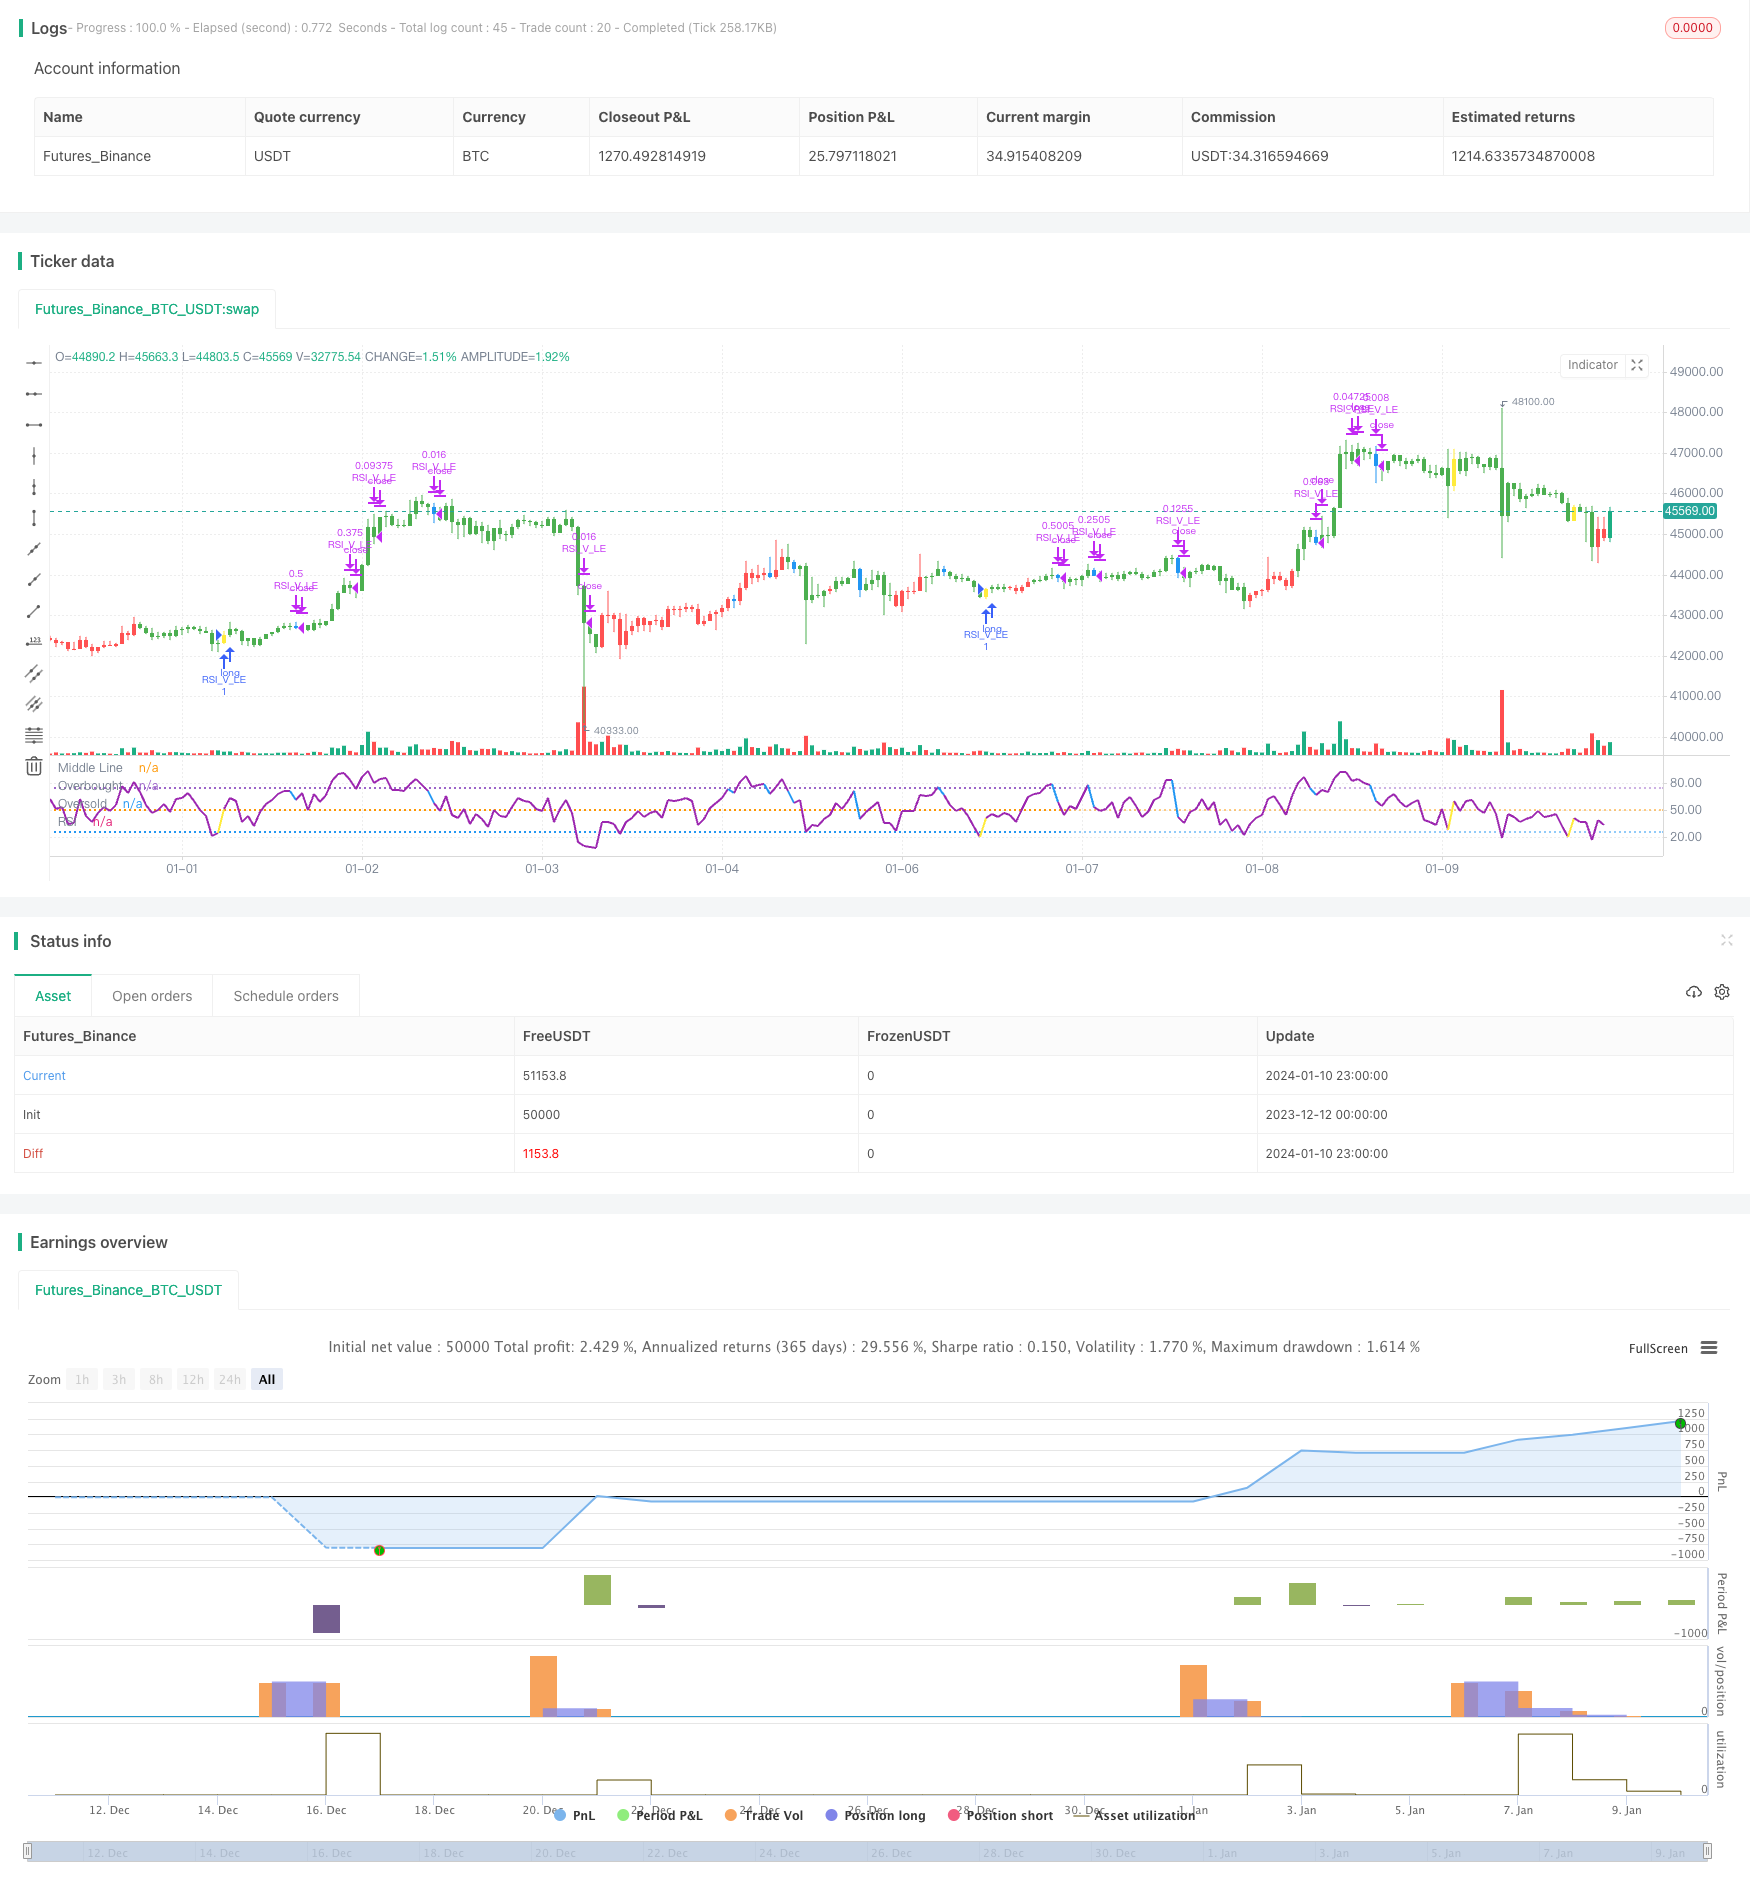
Estrategia de ganancias a corto plazo basada en el patrón RSI V
Fecha de creación:
2024-01-12 13:52:55
Última modificación:
2024-01-12 13:52:55
Copiar:
2
Número de Visitas:
869
1
Seguir
1750
Seguidores
Descripción general
Esta estrategia se basa en la forma V del indicador RSI, en combinación con el filtro de la línea media EMA, para formar una estrategia de ganancias de línea corta más confiable. Puede capturar las oportunidades de que se formen rebotes en las zonas de sobreventa y hacer más con precisión a través de la señal de forma V del indicador RSI, con el objetivo de obtener ganancias en la línea corta.
Principio de estrategia
- El uso de la línea de 20 días sobre la línea de 50 días como la línea larga para juzgar
- El RSI forma una forma de V, lo que indica una oportunidad de rebote por sobreventa
- El mínimo de la primera línea K es menor que el mínimo de las dos líneas K anteriores.
- El RSI de la línea K actual es mayor que el RSI de las dos líneas K anteriores
- RSI sobre el desgaste de 30 como una señal de forma de V para hacer más
- El stop loss está establecido por debajo del 8% del precio de entrada.
- El RSI cruza los 70 para iniciar la posición y el stop loss se traslada al precio de entrada
- El RSI cruza los 90 y comienza en 3⁄4 de unidad
- El RSI cruza 10 / detener el disparo, todo se cierra
Análisis de las ventajas
- Utilice la línea media de la EMA para determinar la dirección de la tendencia general y evitar operaciones de contratiempo
- El RSI V determina la oportunidad de rebote en las zonas de sobreventa para capturar la tendencia de reversión
- Control de riesgos en el mecanismo de suspensión múltiple
Análisis de riesgos
- La caída de la bolsa podría no detenerse y causar grandes pérdidas
- La señal de forma RSI V puede estar equivocada y causar pérdidas innecesarias
Dirección de optimización
- Optimización de los parámetros del RSI en busca de una forma más fiable del RSI V
- En combinación con otros indicadores para determinar la fiabilidad de la señal de inversión
- Optimización de las estrategias de detención de pérdidas, evitando al mismo tiempo que sean demasiado radicales
Resumir
Esta estrategia integra el filtro EMA de la línea uniforme y el juicio de la forma RSI V, formando un conjunto de estrategias de operación de líneas cortas más fiables. Puede aprovechar eficazmente las oportunidades de rebote de las zonas de sobreventa y obtener ganancias en las líneas cortas.
Código Fuente de la Estrategia
/*backtest
start: 2023-12-12 00:00:00
end: 2024-01-11 00:00:00
period: 1h
basePeriod: 15m
exchanges: [{"eid":"Futures_Binance","currency":"BTC_USDT"}]
*/

// This source code is subject to the terms of the Mozilla Public License 2.0 at https://mozilla.org/MPL/2.0/
// © mohanee

//@version=4
//strategy("RSI V Pattern", overlay=true)
strategy(title="RSI V Pattern", overlay=false )

//Strategy Rules
//ema20 is above ema50  --- candles are colored  green on the chart
//RSI value sharply coming up which makes a V shape ,  colored in yellow on the chart
//RSI V pattern should occur from below 30

len = input(title="RSI Period", minval=1, defval=5)
stopLoss = input(title="Stop Loss %", minval=1, defval=8)

myRsi = rsi(close,len)

longEmaVal=ema(close,50)
shortEmaVal=ema(close,20)

//plot emas
//plot(longEmaVal, title="Long EMA" ,linewidth=2, color=color.orange, trackprice=true)
//plot(shortEmaVal, title="Short EMA" ,linewidth=2, color=color.green, trackprice=true)


longCondition =  ema(close,20)>ema(close,50)   and (low[1]<low[2] and  low[1]<low[3]) and (myRsi>myRsi[1] and myRsi>myRsi[2] ) and crossover(myRsi,30) //  (   and myRsi<60)

//(myRsi<60 and myRsi>30)  and myRsi>myRsi[1] and (myRsi[1]<myRsi[2]  or  myRsi[1]<myRsi[3]) and (myRsi[2]<30)  and (myRsi[3]<30 and myRsi[4]>=30)


barcolor(shortEmaVal>longEmaVal?color.green:color.red)
//longCondition = crossover(sma(close, 14), sma(close, 28))
barcolor(longCondition?color.yellow:na)
strategy.entry("RSI_V_LE", strategy.long, when=longCondition )
//stoploss value at 10%
stopLossValue=strategy.position_avg_price -  (strategy.position_avg_price*stopLoss/100)
//stopLossValue=valuewhen(longCondition,low,3)


//takeprofit at RSI highest  reading
//at RSI75 move the stopLoss to entry price
moveStopLossUp=strategy.position_size>0 and crossunder(myRsi,70)
barcolor(moveStopLossUp?color.blue:na)
stopLossValue:=crossover(myRsi,70) ? strategy.position_avg_price:stopLossValue

//stopLossValue:=moveStopLossUp?strategy.position_avg_price:stopLossValue
rsiPlotColor=longCondition ?color.yellow:color.purple
rsiPlotColor:= moveStopLossUp ?color.blue:rsiPlotColor
plot(myRsi, title="RSI", linewidth=2, color=rsiPlotColor)
//longCondition?color.yellow:#8D1699)
hline(50, title="Middle Line", linestyle=hline.style_dotted)
obLevel = hline(75, title="Overbought", linestyle=hline.style_dotted)
osLevel = hline(25, title="Oversold", linestyle=hline.style_dotted)
fill(obLevel, osLevel, title="Background", color=#9915FF, transp=90)


//when RSI crossing down 70 , close 1/2 position and move stop loss to average entry price
strategy.close("RSI_V_LE",  qty=strategy.position_size*1/2, when=strategy.position_size>0 and crossunder(myRsi,70))

//when RSI reaches high reading 90 and crossing down close 3/4 position
strategy.close("RSI_V_LE",  qty=strategy.position_size*3/4, when=strategy.position_size>0 and crossunder(myRsi,90))


//close everything when Rsi goes down below to 10 or stoploss hit
//just keeping RSI cross below 10 , can work as stop loss , which also keeps you long in the trade ... however sharp declines could  make large loss
//so I combine RSI goes below 10 OR stoploss hit  , whichever comes first - whole posiition closed
longCloseCondition=crossunder(myRsi,10)  or close<stopLossValue
strategy.close("RSI_V_LE", qty=strategy.position_size,when=longCloseCondition )