Estrategia de reversión de tendencia a corto plazo
Descripción general
La estrategia de reversión de seguimiento de tendencias es una estrategia de negociación de tendencias a corto plazo basada en los futuros de 15 minutos de NQ. Busca oportunidades de negociación mediante la identificación de las ondas de tendencia y los patrones de reversión. La estrategia es simple y efectiva y es adecuada para los operadores activos de línea corta.
Principio de estrategia
La estrategia se basa principalmente en los siguientes principios:
El EMA de 8 períodos se utiliza como el principal indicador de filtración de tendencias, el EMA superior es favorable y el EMA inferior es negativo.
La identificación de determinadas formas de reversión de la línea K como señales de entrada, incluidas las señales de visión múltiple de la línea de sol largo después de la línea de sol corto y las señales de visión vacía de la línea de sol corto después de la línea de sol largo, que sugieren que la tendencia puede comenzar a revertir.
El punto de entrada se establece como el punto más alto o más bajo de la línea K inversa, y el punto de parada se establece como el punto más alto o más bajo de la línea K inversa, para lograr un alto y eficiente índice de riesgo-beneficio.
La eficacia de la señal de reversión se determina mediante la relación de entidades de la línea K, por ejemplo, si el precio de apertura de la línea negativa es superior al de la entidad de la línea K anterior, la entidad contiene completamente reglas para filtrar el ruido.
Las estrategias que operan solo en períodos de negociación específicos, evitan períodos especiales como los meses de cambio de los principales contratos del mercado, y evitan que las situaciones anormales provoquen pérdidas innecesarias.
Análisis de las ventajas
La estrategia tiene las siguientes ventajas:
Las señales estratégicas son sencillas, eficaces y fáciles de aprender y aplicar.
Basado en las tendencias y las inversiones, evitar el doble asesinato de los mercados de bueyes y osos.
El riesgo está controlado, los paros son razonables y son útiles para la administración de fondos.
La demanda de datos es pequeña y es adecuada para todo tipo de software y plataformas.
La frecuencia de las operaciones es alta y es adecuada para los inversores que se interesan por las operaciones activas de corto plazo.
Riesgos y contramedidas
La estrategia también tiene sus riesgos, y los principales son:
Las oportunidades de reversión son insuficientes, las señales son menores. Se puede relajar adecuadamente las reglas de juicio de reversión.
Se puede agregar más indicadores de filtración para un juicio conjunto.
Hay inestabilidad en el disco nocturno y el horario no convencional. Se puede configurar para que funcione solo en el horario comercial de los Estados Unidos.
El espacio para la optimización de parámetros es limitado. Se puede probar con técnicas como el aprendizaje automático para encontrar mejores parámetros.
Dirección de optimización
La estrategia también tiene un cierto margen de mejora, y las principales direcciones son:
Prueba de EMAs de períodos más largos para mejorar el juicio de tendencias.
Aumentar el índice BPI como un indicador adicional de filtración de tendencias.
Utiliza tecnologías como el aprendizaje automático para optimizar la entrada y el punto de parada.
Aumentar el posicionamiento basado en la volatilidad y el mecanismo de ajuste dinámico del stop loss.
El arbitraje multivariado es un intento de dispersar aún más el riesgo sistémico de una sola variedad.
Resumir
La estrategia de inversión de seguimiento de tendencias en general es una estrategia de línea corta muy práctica, con pocos parámetros simples, fácil de manejar, que puede controlar bien el riesgo personal, adecuada para los comerciantes de línea corta activos. La estrategia tiene cierto espacio de optimización, invertir un cierto esfuerzo de investigación y desarrollo puede hacer que funcione de manera programada, incluso para fondos de línea media y larga, y tiene un buen potencial de desarrollo.
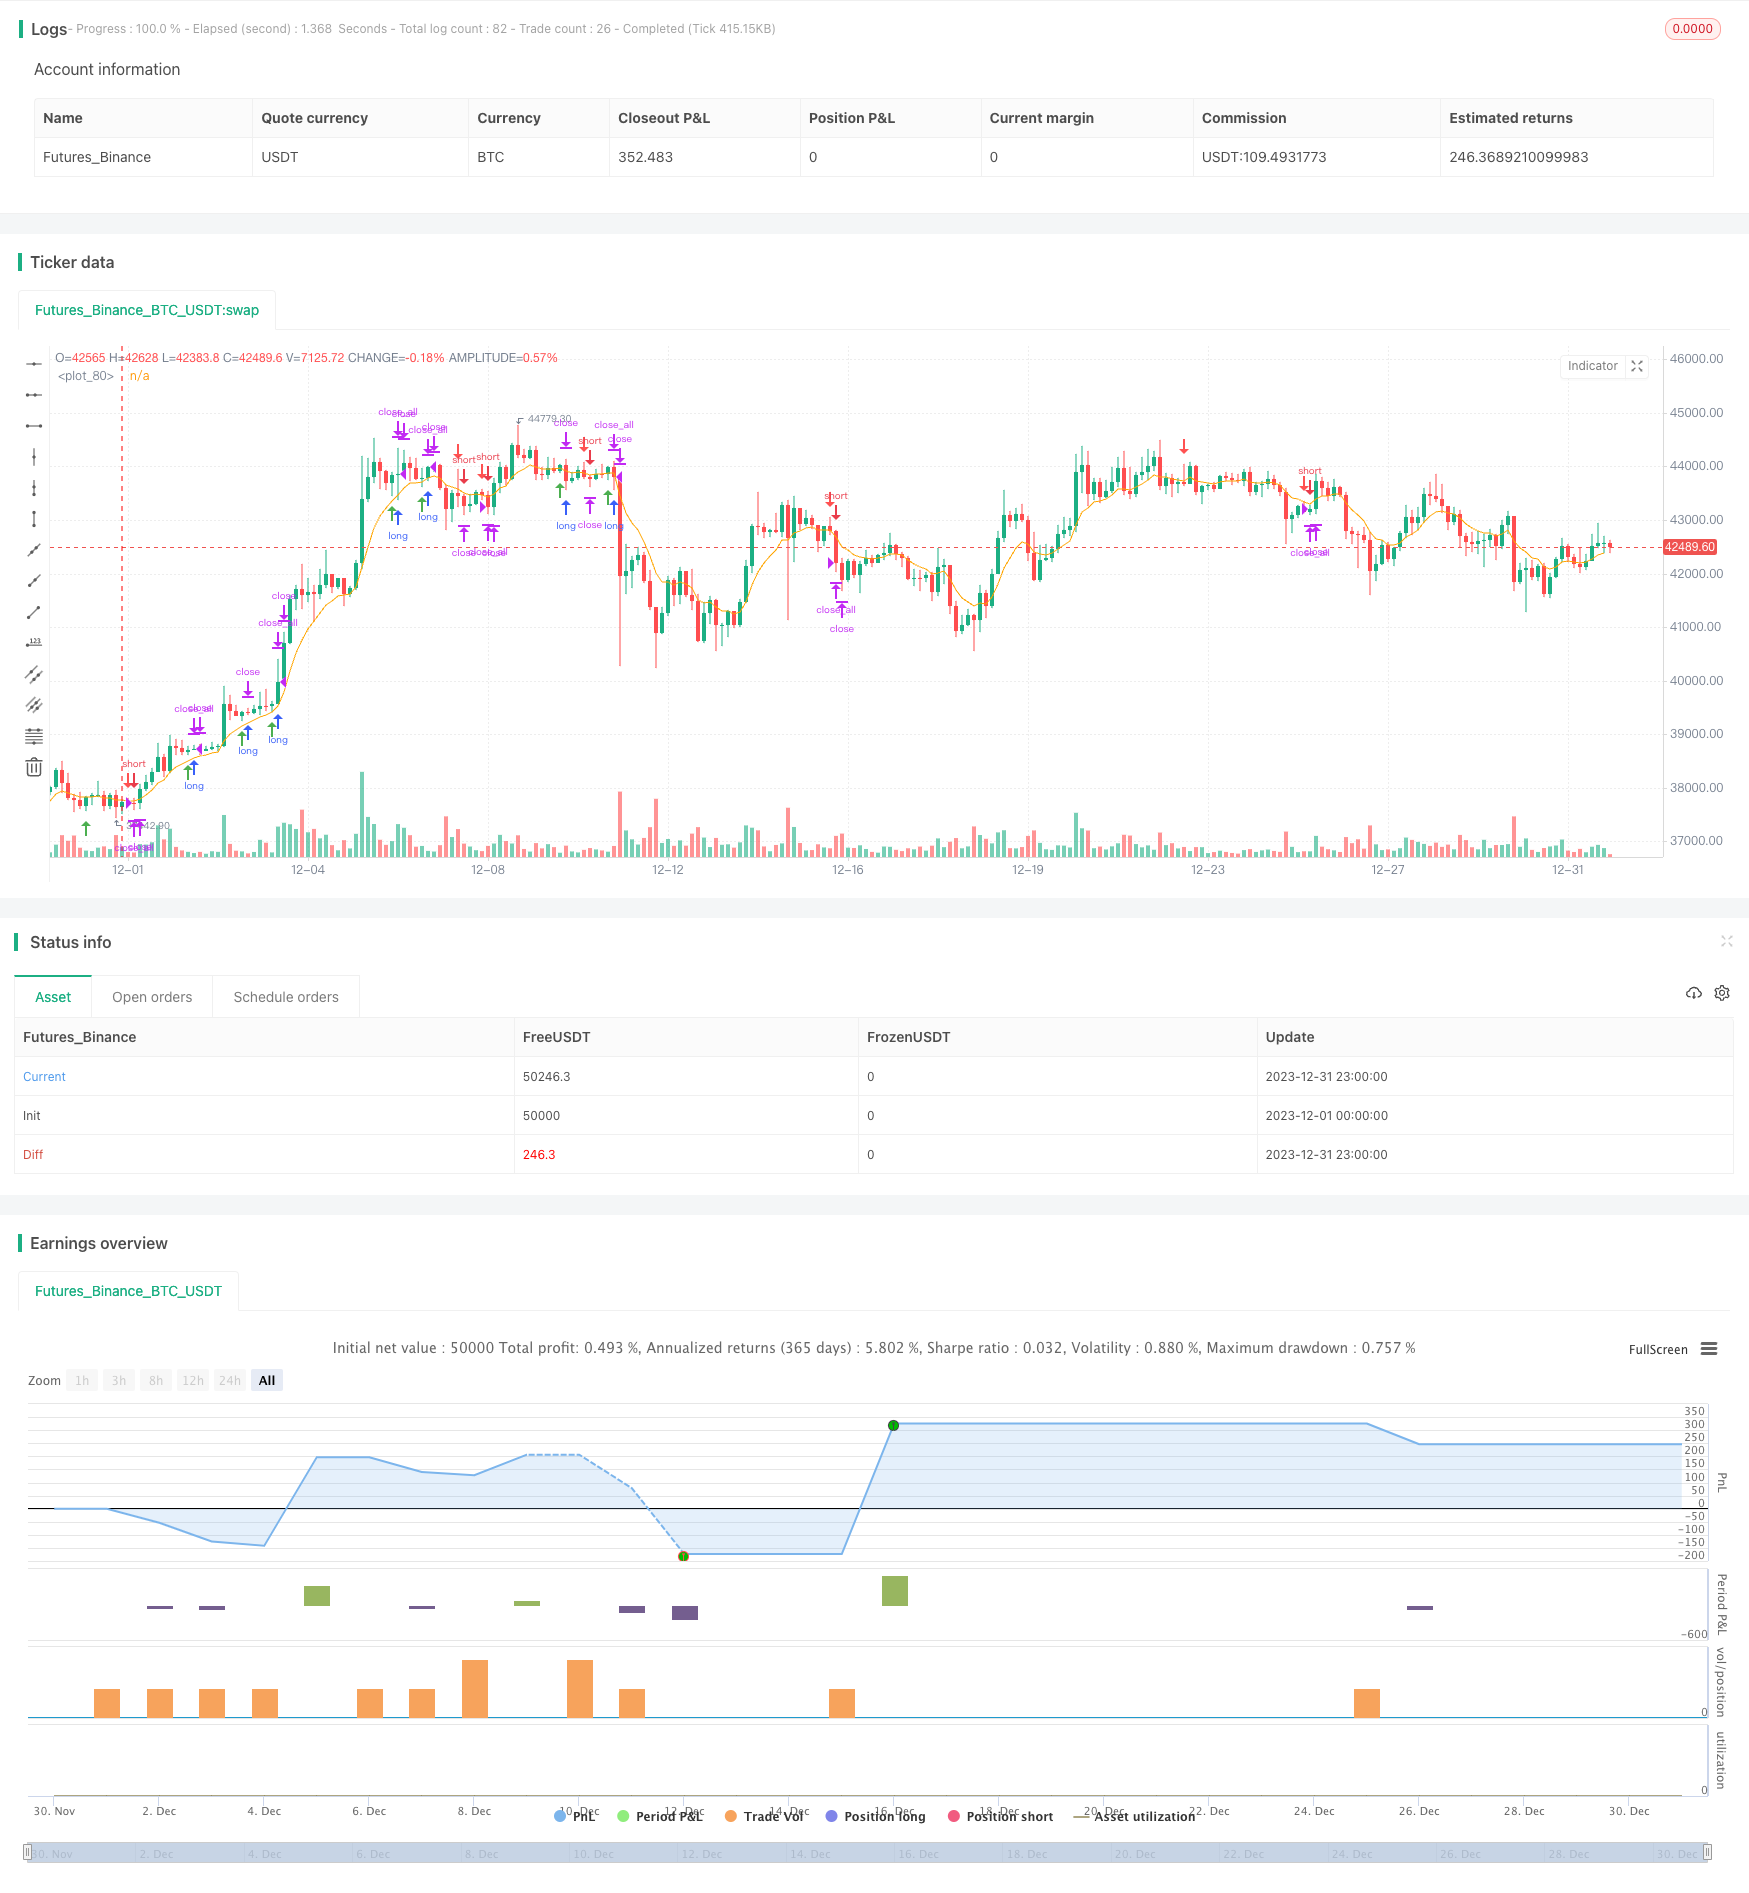
/*backtest
start: 2023-12-01 00:00:00
end: 2023-12-31 23:59:59
period: 3h
basePeriod: 15m
exchanges: [{"eid":"Futures_Binance","currency":"BTC_USDT"}]
*/

// This Pine Script™ code is subject to the terms of the Mozilla Public License 2.0 at https://mozilla.org/MPL/2.0/
// © bdrex95

//@version=5

// Rob Reversal Strategy - Official
// Using Rob Reversal Indicator: Original
// Description
// This indicator is based on the strategy created by Trader Rob on the NQ 15m chart.
//
// Timeframe for trading is 8:30am-1:15pm Central.
//
// Above the EMA line, look for a long position. You will have a short candle, then a long candle that opens below the short candle. It will have a lower high and a lower low. Once the long candle closes, your entry will be 1 tick above the wick (green line) and stop loss will be at the bottom of the bottom wick (red line).
//
// Below the EMA line, look for a short position. You will have a long candle, then a short candle that opens above the long candle. It will have a higher high and a higher low. Once the short candle closes, your entry will be 1 tick below the wick (green line) and stop loss will be at the top of the top wick (red line).
//

strategy("Trader Rob Reversal Strategy NQ 15min", shorttitle="Official Rob Rev Strat", overlay=true)


//--- Session Input ---
sess = input(defval = "0930-1415", title="Trading Session")
t = time(timeframe.period, sess)
sessionOpen = na(t) ? false : true

flat_time = input(defval = "1515-1558", title="Close All Open Trades")
ft = time(timeframe.period, flat_time)
flatOpen = na(ft) ? false : true


// Calculate start/end date and time condition
startDate = input(timestamp('2018-12-24T00:00:00'),group = "ALL STRATEGY SETTINGS BELOW")
finishDate = input(timestamp('2029-02-26T00:00:00'),group = "ALL STRATEGY SETTINGS BELOW")
time_cond = true


emaColor = input.color(color.orange, title="EMA Color")
emaLength = input.int(8, title="EMA Length")


emaInd = ta.ema(close, emaLength)


rr = input(1.0,"Enter RR",group = "TP/SL CONDITION INPUTS HERE")


sellShapeInput = input.string("Arrow", title="Sell Entry Shape", options=["Arrow", "Triangle"])
buyShapeInput = input.string("Arrow", title="Buy Entry Shape", options=["Arrow", "Triangle"])


sellShapeOption = switch sellShapeInput
    "Arrow" => shape.arrowdown
    "Triangle" => shape.triangledown

buyShapeOption = switch buyShapeInput
    "Arrow" => shape.arrowup
    "Triangle" => shape.triangleup


O = open
C = close
H = high
L = low


sellEntry = (C[1] > O[1]) and (C < O) and (H[1] < H) and (C < H[1]) and (C > L[1]) and (L > L[1]) and (C < emaInd) and sessionOpen and time_cond
buyEntry = (C[1] < O[1]) and (C > O) and (H[1] > H) and (L[1] > L) and (C < H[1]) and (C > L[1]) and (C > emaInd) and sessionOpen and time_cond


sellEntry_index = ta.valuewhen(sellEntry,bar_index,0)
sellEntry_hi = ta.valuewhen(sellEntry,high,0)
sellEntry_low = ta.valuewhen(sellEntry,low,0)
buyEntry_index = ta.valuewhen(buyEntry,bar_index,0)
buyEntry_hi = ta.valuewhen(buyEntry,high,0)
buyEntry_lo = ta.valuewhen(buyEntry,low,0)


plotshape(buyEntry, color = color.green, location = location.belowbar, style = buyShapeOption, size = size.small)
plotshape(sellEntry, color = color.red, location = location.abovebar, style = sellShapeOption, size = size.small)
plot(emaInd, color=emaColor)


// Risk Management
entry_price_long = (buyEntry_hi + syminfo.mintick)
entry_price_short = (sellEntry_low - syminfo.mintick)
long_sl_price = (buyEntry_lo-syminfo.mintick)
short_sl_price = (sellEntry_hi + syminfo.mintick)
long_tp_price = ((entry_price_long - long_sl_price)*rr) + entry_price_long
short_tp_price = entry_price_short - ((short_sl_price - entry_price_short)*rr)


long_sl_ticks = (entry_price_long - long_sl_price) / syminfo.mintick
short_sl_ticks = (short_sl_price - entry_price_short) / syminfo.mintick


long_tp_ticks = (long_tp_price - entry_price_long) / syminfo.mintick
short_tp_ticks = (entry_price_short - short_tp_price) / syminfo.mintick


// Positions
if (buyEntry)
    strategy.entry("Long", strategy.long,stop = H + syminfo.mintick)
if strategy.position_size > 0
    strategy.exit("Long Ex","Long", loss = long_sl_ticks, profit = long_tp_ticks, comment_loss = "SL Long", comment_profit = "TP Long")


if (sellEntry)
    strategy.entry("Short", strategy.short,stop = L - syminfo.mintick)
if strategy.position_size < 0
    strategy.exit("Short Ex","Short",loss = short_sl_ticks, profit = short_tp_ticks, comment_loss = "SL Short", comment_profit = "TP Short")


// Cancel order if close beyond ema
if (C < emaInd)
    strategy.cancel("Long")


if (C > emaInd)
    strategy.cancel("Short")


// Go flat at close (for futures funded account)
if strategy.position_size > 0 and flatOpen
    strategy.close_all(comment = "EOD Flat")
if strategy.position_size < 0 and flatOpen
    strategy.close_all(comment = "EOD Flat")

//END