Estrategia de NoroBands posicional de impulso

1
Follow
1788
Followers
Descripción general
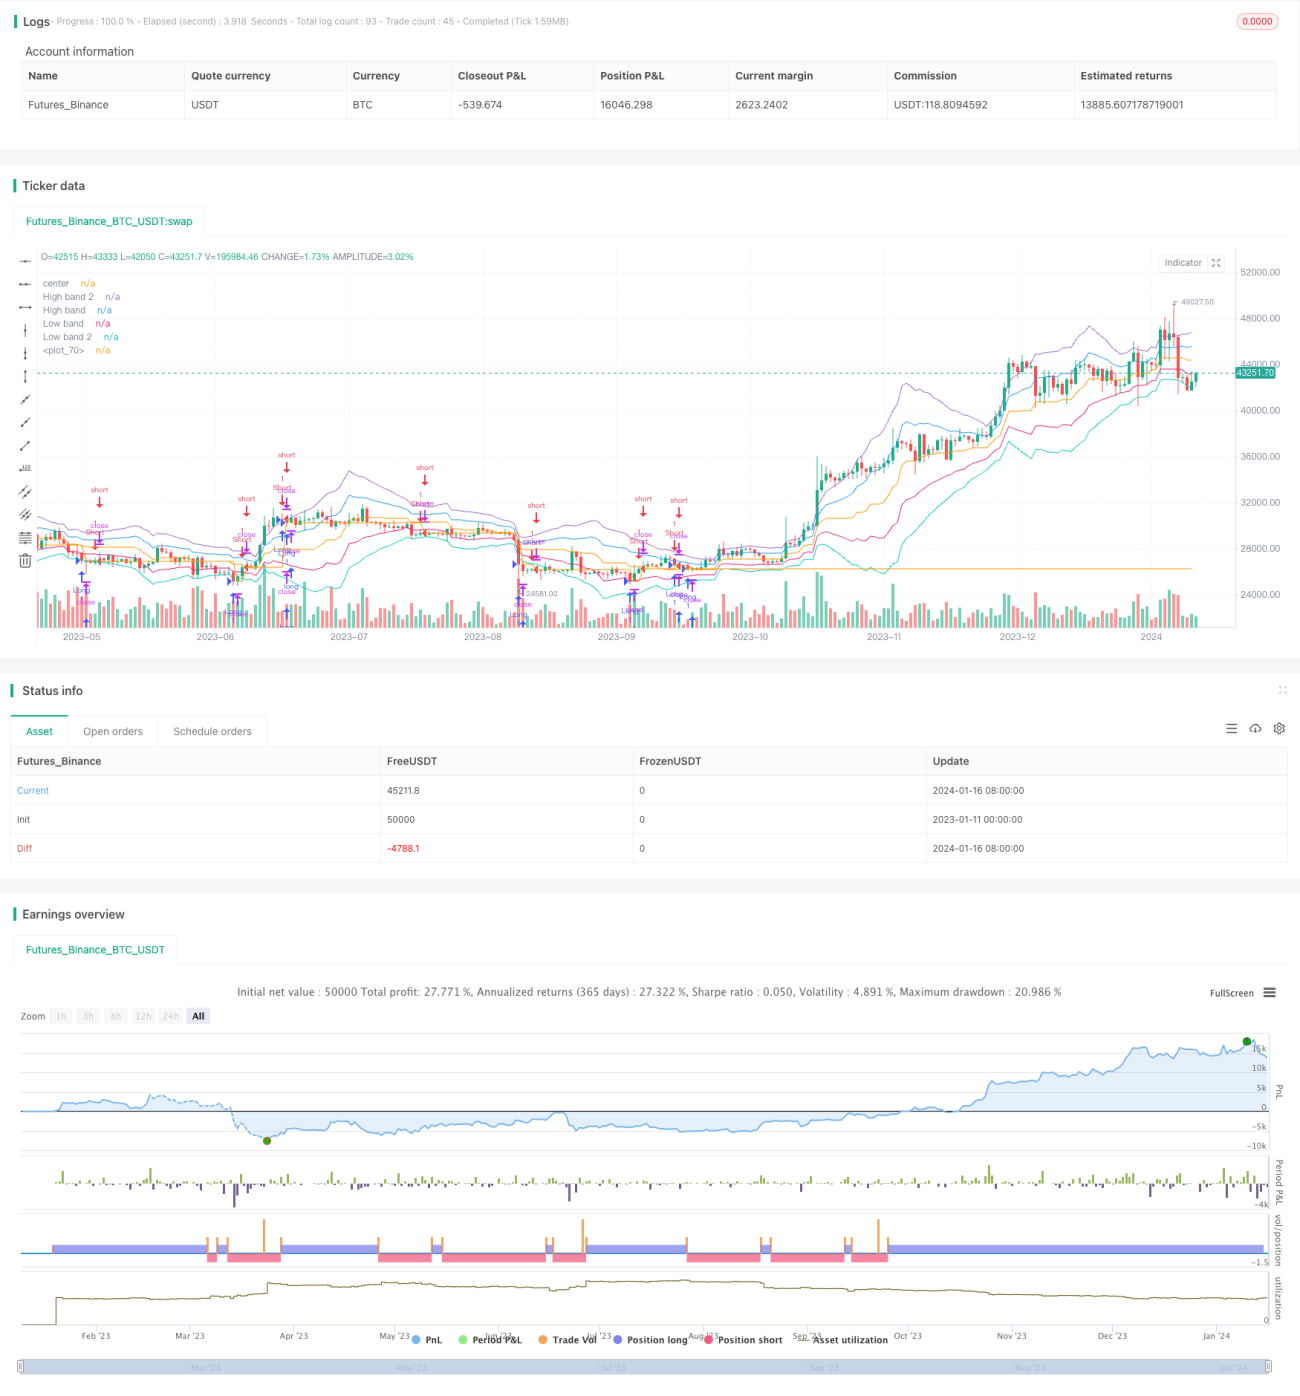
La estrategia es una estrategia de ruptura dinámica basada en la teoría de bandas de Noro combinada con la técnica de la cuantificación. Se forma una señal de compra y venta mediante el cálculo de varios indicadores, como la línea media, el RSI, la banda y el color del toro, y se realiza una ruptura de banda.
Principio de estrategia
- Se calcula la subida y bajada de la banda a través de la amplitud real promedio. La subida y bajada de la banda son señales de alza y la bajada de la banda son señales de baja.
- El indicador RSI juzga las zonas de sobrecompra y sobreventa, donde el RSI está por debajo de los 30 puntos positivos y por encima de los 70 puntos negativos.
- La dirección de la dinámica de los precios se determina a través de la ruptura entre los precios más altos y más bajos.
- El color del toro y el oso es el que determina si el mercado es alcista o no. El verde es el mercado alcista, con alza; el rojo es el mercado alcista, con baja.
- La combinación de equilánea y desviación de juicio emite una señal de negociación.
Análisis de las ventajas
- Combinación de varios indicadores para una mayor precisión.
- La combinación de la teoría de bandas y la técnica de la cuantificación hace que la estrategia sea más eficaz.
- La ruptura de la dinámica combinada con el comercio inverso aumenta el margen de ganancias.
- Escalable y adaptable a las necesidades del mercado.
Análisis de riesgos
- La configuración de los parámetros necesita ser optimizada y probada constantemente.
- La respuesta a la interrupción de la red en tiempo real puede resultar en pérdidas.
- Las transacciones son más frecuentes y son más susceptibles a las comisiones y puntos de deslizamiento.
- Los parámetros de la banda deben ajustarse a su debido tiempo para adaptarse a los diferentes períodos.
Dirección de optimización
- Verificación de varios períodos de tiempo para encontrar la combinación óptima de parámetros.
- Aumentar las estrategias de stop loss y reducir las pérdidas individuales.
- La gestión de las posiciones aumenta la rentabilidad.
- Optimización automática de parámetros en combinación con el aprendizaje profundo.
Resumir
Esta estrategia integra la aplicación de varios indicadores técnicos cuantitativos típicos para lograr una rentabilidad eficiente a través de la combinación de indicadores de movimiento y indicadores de inversión. Al mismo tiempo, se utiliza la teoría de la amplitud de onda real promedio para encontrar un punto de entrada razonable. Se puede considerar un ejemplo de combinación de indicadores técnicos y teoría.
Source
Pine
Strategy parameters
Related strategies
Comment
All comments (0)
No data
- 1