Siga pacientemente la estrategia de seguimiento de tendencias.
Descripción general
La estrategia de seguimiento de tendencias con paciencia es una estrategia de seguimiento de tendencias. Utiliza una combinación de indicadores de las medias móviles para determinar la dirección de la tendencia y, en combinación con el indicador de sobreventa y sobreventa CCI, emite una señal de negociación. La estrategia persigue una gran tendencia y puede evitarse de manera efectiva en situaciones de crisis.
Principio de estrategia
La estrategia utiliza una combinación de EMAs de 21 y 55 ciclos para determinar la dirección de la tendencia. Cuando la EMA a corto plazo está por encima de la EMA a largo plazo se define como una tendencia alcista y cuando la EMA a corto plazo está por debajo de la EMA a largo plazo se define como una tendencia descendente.
El indicador CCI se utiliza para determinar sobreventa y sobreventa. La línea de sobrevención de 100 en el CCI es la señal de venta por debajo y la línea de sobrevención de 100 en el CCI es la señal de venta por encima. La estrategia se divide en tres niveles de intensidad de la señal de negociación según las diferentes líneas de venta por encima de la venta por encima de la venta del indicador CCI.
Cuando se considera una tendencia alcista, si el indicador CCI emite una fuerte señal de venta por encima de la parte inferior, se realiza una entrada de más cabeza. Cuando se considera una tendencia descendente, si el indicador CCI emite una fuerte señal de venta por encima de la parte superior, se realiza una entrada de cabeza vacía.
La línea de parada se establece como un indicador de SuperTrend y el objetivo de ganancias se establece como un número fijo de puntos.
Análisis de las ventajas
La estrategia tiene las siguientes ventajas:
- Seguir las tendencias y evitar ser engañados
- El índice CCI puede ayudar a determinar el punto de inflexión
- La línea de parada de SuperTrend es razonable
- Detención fija y parada fija, el riesgo controlado
Análisis de riesgos
El principal riesgo de esta estrategia es:
- La probabilidad de error en las tendencias generales
- Probabilidad de que el indicador CCI emita una señal falsa
- Probabilidad de que el punto de parada sea demasiado bajo o demasiado profundo para causar un daño innecesario
- La probabilidad de que el parón fijo no pueda seguir la tendencia de ganar
Para estos riesgos, se puede optimizar mediante el ajuste de los parámetros de ciclo EMA, los parámetros de CCI y el punto de parada de stop loss. Al mismo tiempo, es necesario introducir más indicadores para la validación de la señal de estrategia.
Dirección de optimización
La estrategia se ha optimizado en los siguientes aspectos:
Prueba más combinaciones de indicadores para encontrar mejores indicadores de tendencias y de verificación de señales.
Utilizar el stop loss de ATR dinámico para seguir mejor las tendencias y controlar el riesgo.
Introducción de modelos de aprendizaje automático basados en el entrenamiento de datos históricos para determinar la probabilidad de tendencias.
Adaptación y optimización de los parámetros de las diferentes variedades.
Resumir
La estrategia de seguimiento de tendencias de paciencia en su conjunto es una estrategia de seguimiento de tendencias muy práctica. Utiliza las medias móviles para determinar la dirección de la tendencia general, el indicador CCI encuentra señales de punto de reversión y el establecimiento de la línea de parada de tendencia súper es razonable. La estrategia puede optimizarse aún más mediante la verificación de la combinación de parámetros y múltiples indicadores.
/*backtest
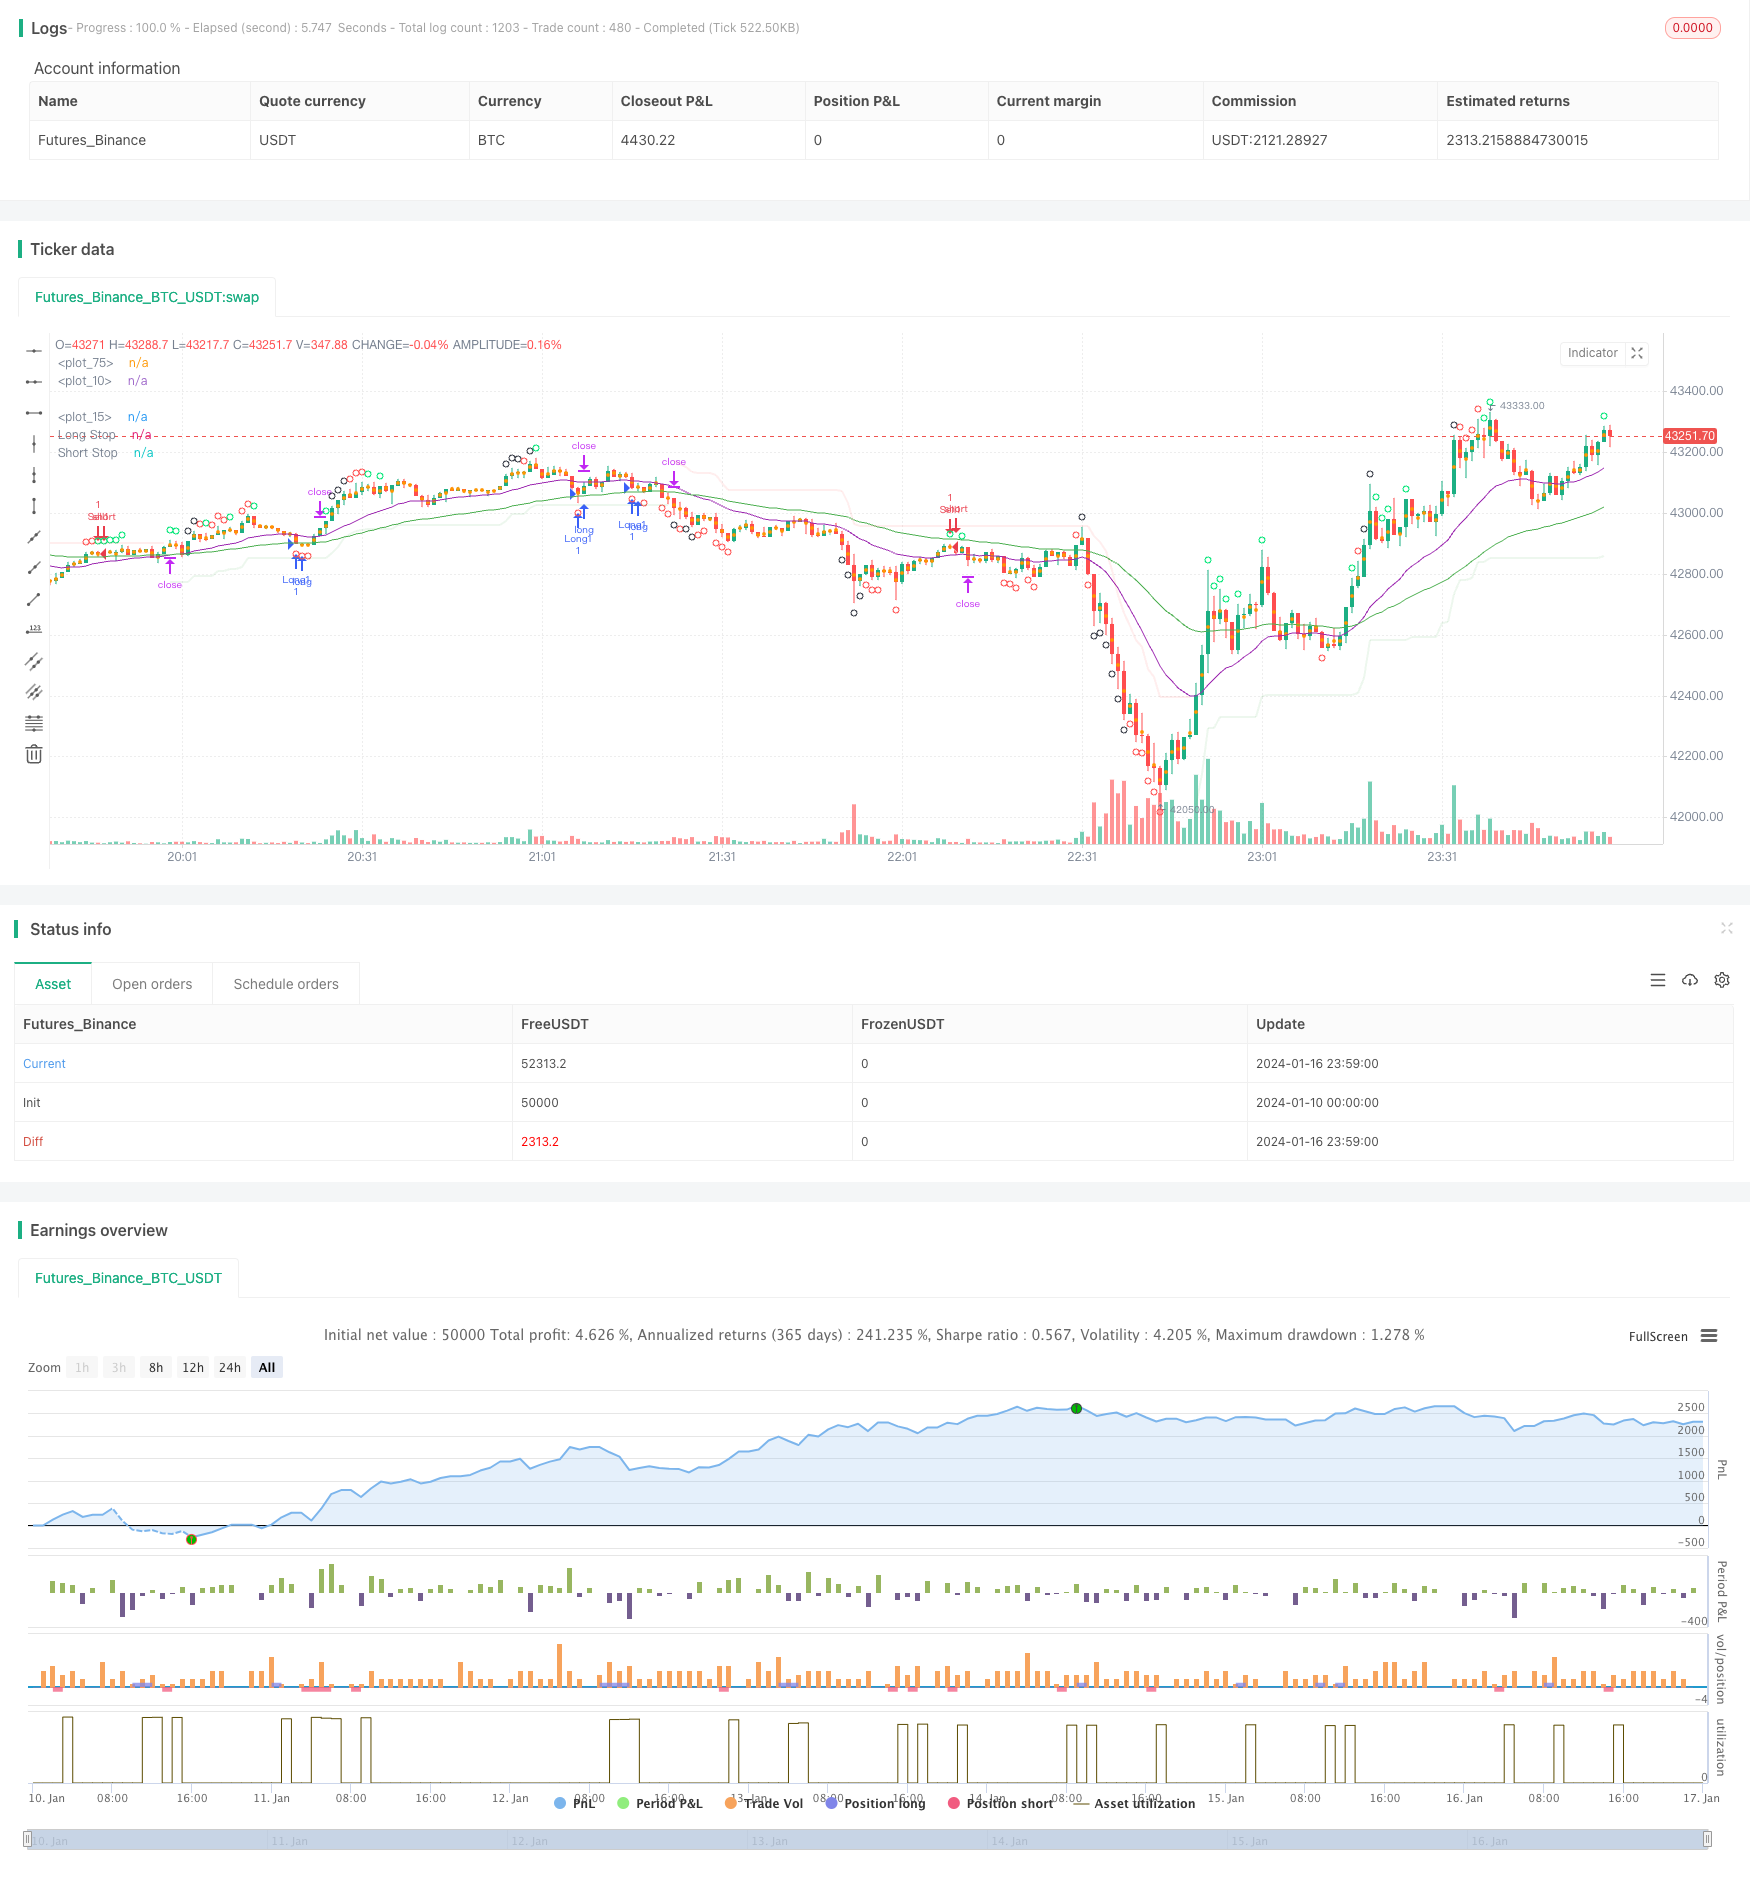
start: 2024-01-10 00:00:00
end: 2024-01-17 00:00:00
period: 1m
basePeriod: 1m
exchanges: [{"eid":"Futures_Binance","currency":"BTC_USDT"}]
*/
// This source code is subject to the terms of the Mozilla Public License 2.0 at https://mozilla.org/MPL/2.0/
// © greenmask9
//@version=4
strategy("Patient Trendfollower (7) Strategy", overlay=true)
// 21 EMA
emalength = input(21, title="Short EMA")
emashort = ema(close, emalength)
plot(emashort, color = color.purple, linewidth=1)
// 55 EMA
emalength2 = input(55, title="Long EMA")
ema = ema(close, emalength2)
plot(ema, color = color.green, linewidth=1)
//CCI calculation and inputs
lengthcci = input(20, minval=1, title="Overbought/sold detector period")
src = input(close, title="Overbought/sold detector source")
ma = sma(src, lengthcci)
ccivalue = (src - ma) / (0.015 * dev(src, lengthcci))
//CCI plotting
ccioverbought = input(defval=100, title="Overbought level 1")
ccioverbought2 = input(defval=140, title="Overbought level 2")
ccioverbought3 = input(defval=180, title="Overbought level 3")
ccioversold = input(defval=-100, title="Oversold level 1")
ccioversold2 = input(defval=-140, title="Oversold level 2")
ccioversold3 = input(defval=-180, title="Oversold level 3")
cciOB = (ccivalue >= ccioverbought and ccivalue < ccioverbought2)
plotshape(cciOB, title= "Overbought", location=location.abovebar, color=color.lime, transp=0, style=shape.circle)
cciOS = (ccivalue <= ccioversold and ccivalue > ccioversold2)
plotshape(cciOS, title= "Oversold", location=location.belowbar, color=color.lime, transp=0, style=shape.circle)
cciOB2 = (ccivalue >= ccioverbought2 and ccivalue < ccioverbought3)
plotshape(cciOB2, title= "Overbought", location=location.abovebar, color=color.red, transp=0, style=shape.circle)
cciOS2 = (ccivalue <= ccioversold and ccivalue > ccioversold3)
plotshape(cciOS2, title= "Oversold", location=location.belowbar, color=color.red, transp=0, style=shape.circle)
cciOB3 = (ccivalue >= ccioverbought3)
plotshape(cciOB3, title= "Overbought", location=location.abovebar, color=color.black, transp=0, style=shape.circle)
cciOS3 = (ccivalue <= ccioversold3)
plotshape(cciOS3, title= "Oversold", location=location.belowbar, color=color.black, transp=0, style=shape.circle)
//Supertrend
length = input(title="ATR Period", type=input.integer, defval=55)
mult = input(title="ATR Multiplier", type=input.float, step=0.1, defval=5.0)
wicks = input(title="Take Wicks into Account ?", type=input.bool, defval=true)
illuminate = input(title="Illuminate Trend", type=input.bool, defval=true)
atr = mult * atr(length)
longStop = hl2 - atr
longStopPrev = nz(longStop[1], longStop)
longStop := (wicks ? low[1] : close[1]) > longStopPrev ? max(longStop, longStopPrev) : longStop
shortStop = hl2 + atr
shortStopPrev = nz(shortStop[1], shortStop)
shortStop := (wicks ? high[1] : close[1]) < shortStopPrev ? min(shortStop, shortStopPrev) : shortStop
dir = 1
dir := nz(dir[1], dir)
dir := dir == -1 and (wicks ? high : close) > shortStopPrev ? 1 : dir == 1 and (wicks ? low : close) < longStopPrev ? -1 : dir
longColor = color.new(color.green, 90)
shortColor = color.new(color.red, 90)
noneColor = color.new(color.white, 100)
longStopPlot = plot(dir == 1 ? longStop : na, title="Long Stop", style=plot.style_linebr, linewidth=2, color=longColor)
shortStopPlot = plot(dir == 1 ? na : shortStop, title="Short Stop", style=plot.style_linebr, linewidth=2, color=shortColor)
midPricePlot = plot(ohlc4, title="", style=plot.style_circles, linewidth=0)
longFillColor = illuminate ? (dir == 1 ? longColor : noneColor) : noneColor
shortFillColor = illuminate ? (dir == -1 ? shortColor : noneColor) : noneColor
fill(midPricePlot, longStopPlot, title="Long State Filling", color=longFillColor)
fill(midPricePlot, shortStopPlot, title="Short State Filling", color=shortFillColor)
//entries
uptrend = emashort>ema and dir == 1
upsignal = ccivalue<=ccioversold and ccivalue>ccioversold2
upsignal2 = ccivalue<=ccioversold2 and ccivalue>ccioversold3
upsignal3 = ccivalue<=ccioversold3
downtrend = emashort<ema and dir == -1
downsignal = ccivalue>=ccioverbought and ccivalue<ccioverbought2
downsignal2 = ccivalue>=ccioverbought2 and ccivalue<ccioverbought3
downsignal3 = ccivalue>=ccioverbought3
//adapts to the current bar, I need to save the bars number when the condition for buy was true, static number is spread
spread = input (0.00020, title="Spread")
upstoploss = longStop - spread
downstoploss = shortStop + spread
strategy.initial_capital = 50000
ordersize=floor(strategy.initial_capital/close)
testlong = input(title="Test longs", type=input.bool, defval=true)
testshort = input(title="Test shorts", type=input.bool, defval=true)
//new
degree = input(title="Test level 1 overbought/sold levels", type=input.bool, defval=true)
degree2 = input(title="Test level 2 overbought/sold levels", type=input.bool, defval=false)
degree3 = input(title="Test level 3 overbought/sold levels", type=input.bool, defval=false)
statictarget = input(title="Use static target", type=input.bool, defval=true)
statictargetvalue = input(title="Static target in pips", type=input.integer, defval=400)
//timetrade = input(title="Open trades only withing specified time", type=input.bool, defval=true)
//timtrade = input()
//přidat možnost TP podle ATR a sl podle ATR
buy1 = uptrend and upsignal and strategy.opentrades==0 and testlong and degree
x1 = barssince (buy1)
if (buy1)
//bodlo by zakázat atrtarget v tomto případě
if (statictarget)
strategy.entry("Long1", strategy.long, ordersize)
strategy.exit( "Exitlong", from_entry="Long1" , profit=statictargetvalue,stop=upstoploss[x1])
buy2 = uptrend and upsignal2 and strategy.opentrades==0 and testlong and degree2
x2 = barssince (buy2)
if (buy2)
//bodlo by zakázat atrtarget v tomto případě
if (statictarget)
strategy.entry("Long2", strategy.long, ordersize)
strategy.exit( "Exitlong", from_entry="Long2" , profit=statictargetvalue,stop=upstoploss[x2])
buy3 = uptrend and upsignal3 and strategy.opentrades==0 and testlong and degree3
x3 = barssince (buy3)
if (buy3)
//bodlo by zakázat atrtarget v tomto případě
if (statictarget)
strategy.entry("Long3", strategy.long, ordersize)
strategy.exit( "Exitlong", from_entry="Long3" , profit=statictargetvalue,stop=upstoploss[x3])
sell1 = downtrend and downsignal and strategy.opentrades==0 and testshort and degree
y1 = barssince (sell1)
if (sell1)
if (statictarget)
strategy.entry("Sell1", strategy.short, ordersize)
strategy.exit( "Exitshort", from_entry="Sell1" , profit=statictargetvalue,stop=downstoploss[y1])
sell2 = downtrend and downsignal2 and strategy.opentrades==0 and testshort and degree2
y2 = barssince (sell2)
if (sell2)
if (statictarget)
strategy.entry("Sell2", strategy.short, ordersize)
strategy.exit( "Exitshort", from_entry="Sell2" , profit=statictargetvalue,stop=downstoploss[y2])
sell3 = downtrend and downsignal3 and strategy.opentrades==0 and testshort and degree3
y3 = barssince (sell3)
if (sell3)
if (statictarget)
strategy.entry("Sell3", strategy.short, ordersize)
strategy.exit( "Exitshort", from_entry="Sell3" , profit=statictargetvalue,stop=downstoploss[y3])