Estrategia de cobertura de fondo
Descripción general
La estrategia de reajuste de brecha es una estrategia típica de compra-venta baja y alta. Utiliza el indicador RSI para identificar puntos de venta excesiva, emite una señal de compra después de que el precio baje hasta un cierto punto y acumula tokens a un precio más bajo; cuando el precio vuelve a subir, se obtiene un cierre de ganancias estableciendo que el RSI salga de la depreciación.
Principio de estrategia
La estrategia se basa principalmente en el indicador RSI para identificar puntos de venta exagerada. El rango normal del indicador RSI es entre 0 y 100. Se emite una señal de compra cuando el indicador RSI cae por debajo del umbral de entrada establecido de 35 y se emite una señal de venta cuando el indicador RSI vuelve a subir hasta el umbral de salida establecido por encima de 65.
Además, la estrategia también introdujo un promedio móvil simple de 100 ciclos para formar condiciones de combinación con el indicador RSI, que solo desencadenaría una señal de compra cuando el precio cayera por debajo del promedio móvil y el RSI entrara en la zona de sobreventa. Esto puede filtrar eficazmente algunas brechas falsas y reducir las transacciones innecesarias.
Ventajas estratégicas
- Utiliza el RSI para identificar de manera efectiva los puntos de venta excesiva y de compra excesiva, para obtener mejores costos de compra en los puntos de inversión
- La combinación de las medias móviles con filtros para evitar señales erróneas
- El objetivo de esta estrategia es que los inversores de la región puedan aprovechar las tendencias al alza.
Riesgos estratégicos y soluciones
- Hay un cierto retraso y se puede perder la oportunidad de una rápida reversión.
- Reducir adecuadamente el ciclo de cálculo del RSI y acelerar la reacción del indicador
- En situaciones de crisis, las pérdidas de liquidación podrían ser mayores.
- Ajustar el ciclo de las medias móviles, o cancelar las medias móviles
- Relajación adecuada de los parámetros de entrada y salida del RSI
Dirección de optimización de la estrategia
- Prueba de optimización de parámetros de diferentes monedas y períodos de tiempo
- Intentar combinar con otros indicadores, como el MACD, las bandas de Brin, etc.
- Ajuste dinámico de los parámetros del RSI o de las medias móviles
- Optimización de las estrategias de gestión de posiciones
Resumir
La estrategia de compensación de la ruptura del fondo es una estrategia de venta baja y alta que es sólida y práctica en general. Mediante el doble filtrado del RSI y el promedio móvil, se pueden suprimir de manera efectiva las señales falsas y, con parámetros optimizados, se puede obtener un menor costo de mantenimiento. Al mismo tiempo, se optimizan adecuadamente los parámetros del indicador y se ajusta la estrategia de posición, con la esperanza de obtener una mayor eficiencia en el uso de fondos.
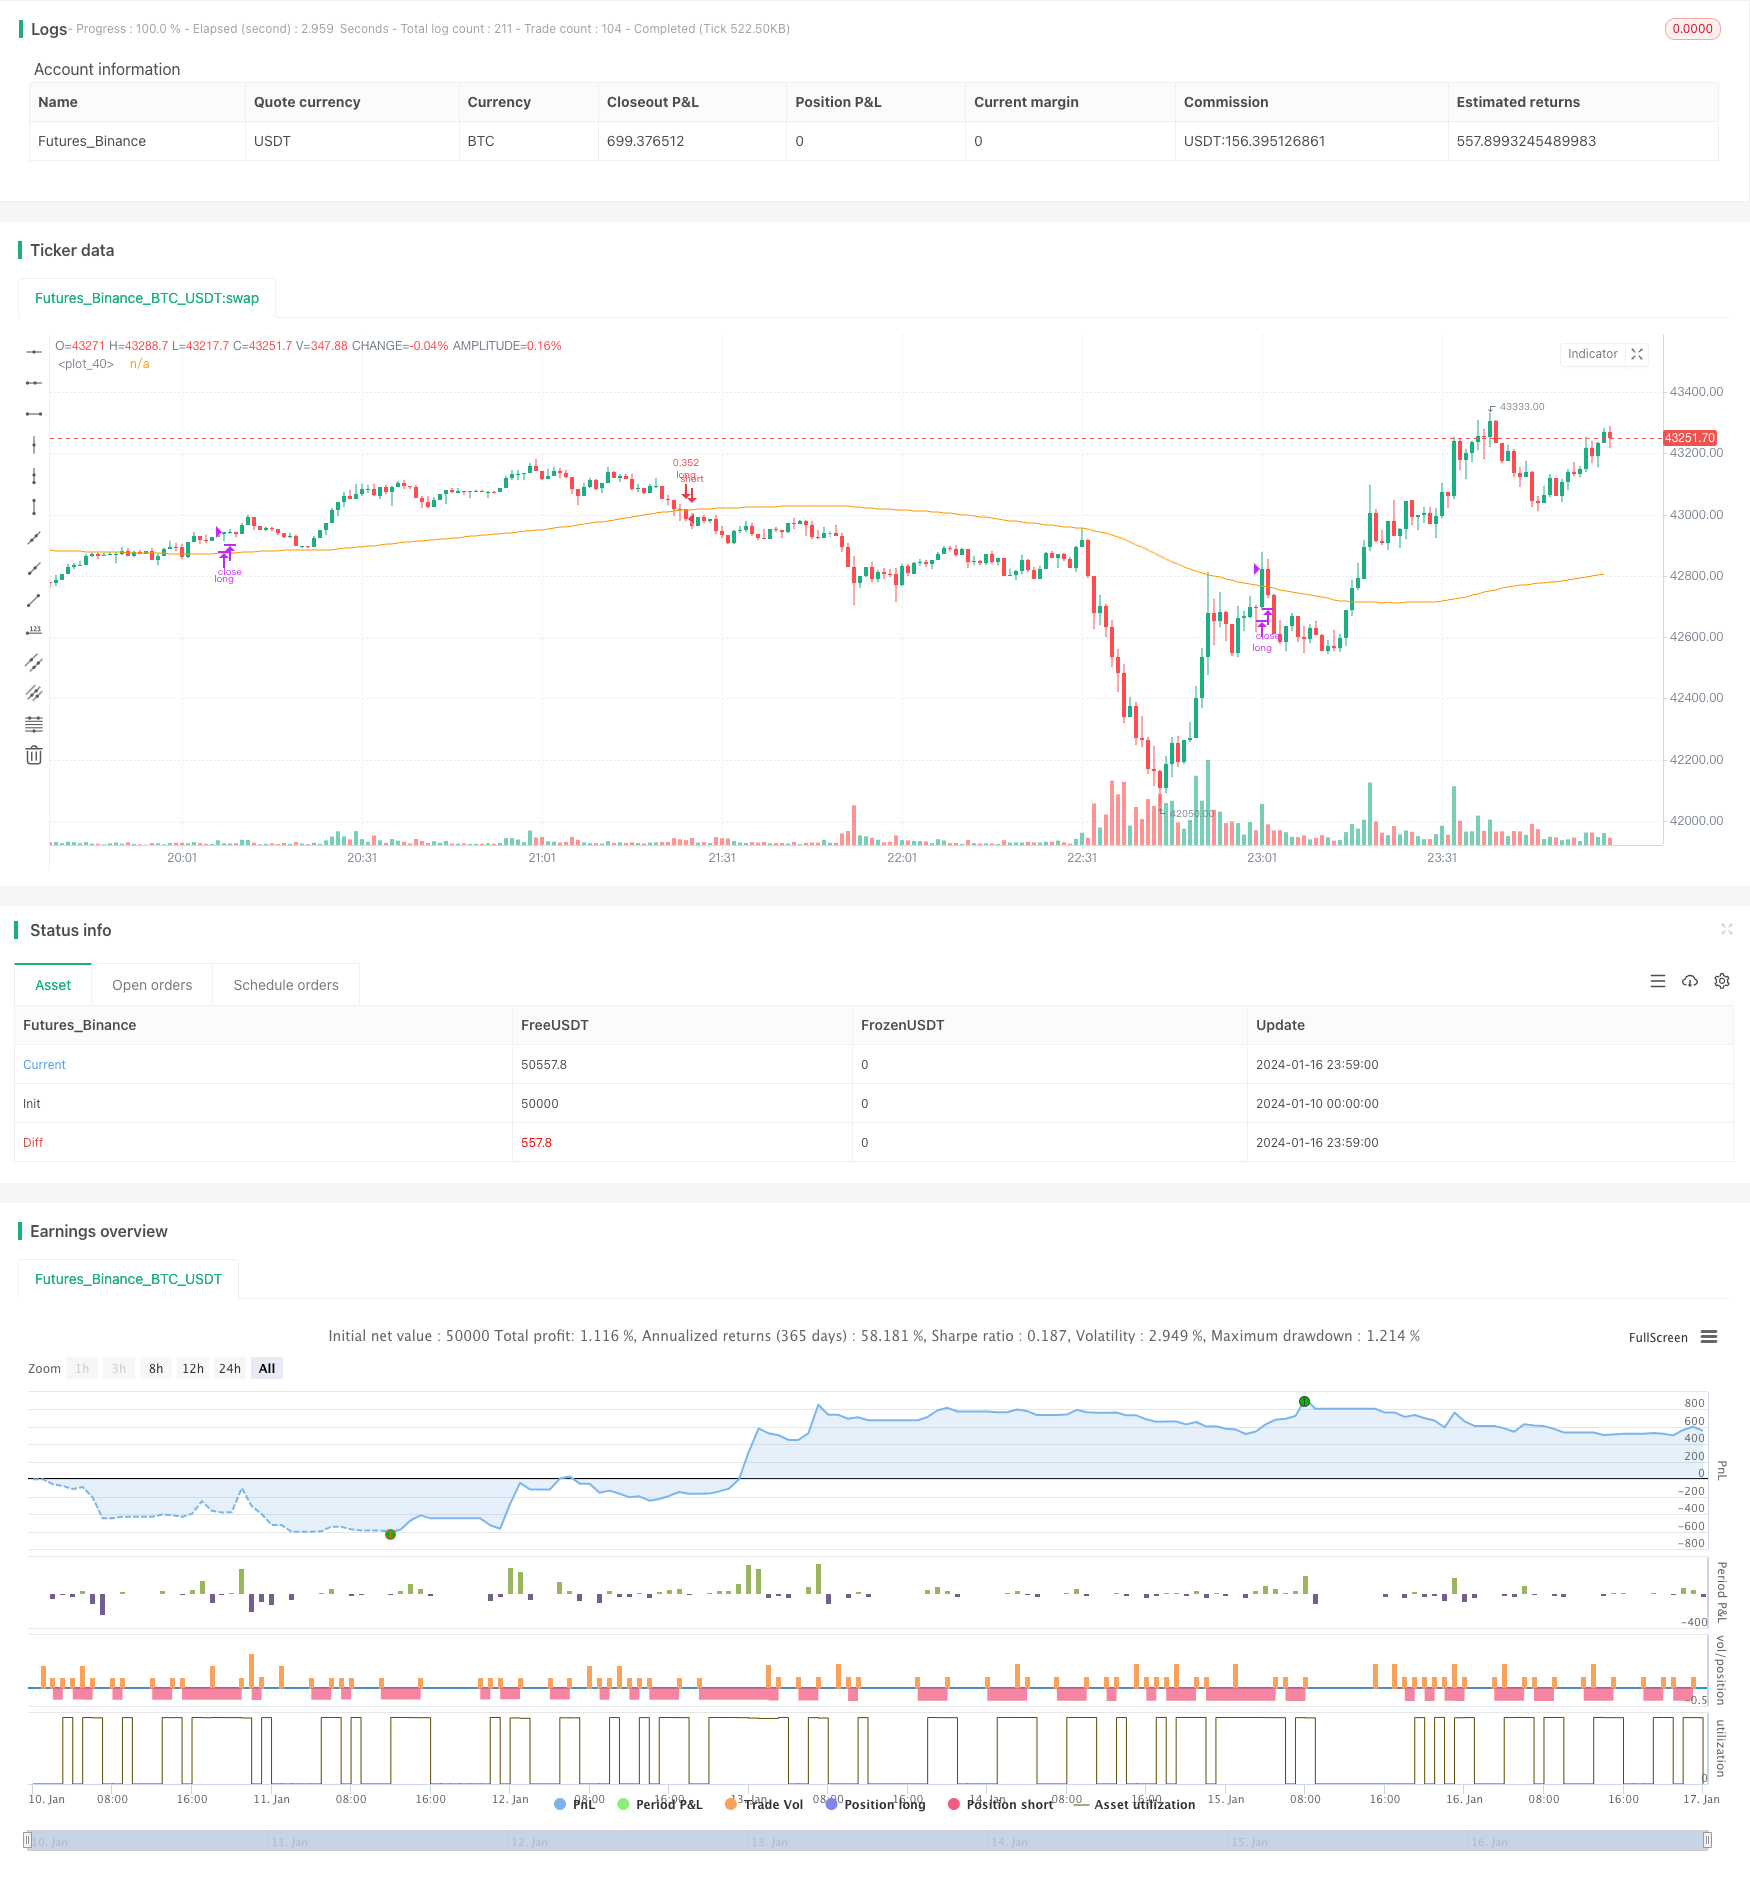
/*backtest
start: 2024-01-10 00:00:00
end: 2024-01-17 00:00:00
period: 1m
basePeriod: 1m
exchanges: [{"eid":"Futures_Binance","currency":"BTC_USDT"}]
*/

// This source code is subject to the terms of the Mozilla Public License 2.0 at https://mozilla.org/MPL/2.0/
// © Coinrule

//@version=4
strategy(shorttitle='Optimized RSI Strategy',title='Optimized RSI Strategy - Buy The Dips (by Coinrule)', overlay=true, initial_capital = 1000, default_qty_type = strategy.percent_of_equity, default_qty_type = strategy.percent_of_equity, default_qty_value = 30, commission_type=strategy.commission.percent, commission_value=0.1)

//Backtest dates
fromMonth = input(defval = 1,    title = "From Month",      type = input.integer, minval = 1, maxval = 12)
fromDay   = input(defval = 1,    title = "From Day",        type = input.integer, minval = 1, maxval = 31)
fromYear  = input(defval = 2020, title = "From Year",       type = input.integer, minval = 1970)
thruMonth = input(defval = 1,    title = "Thru Month",      type = input.integer, minval = 1, maxval = 12)
thruDay   = input(defval = 1,    title = "Thru Day",        type = input.integer, minval = 1, maxval = 31)
thruYear  = input(defval = 2112, title = "Thru Year",       type = input.integer, minval = 1970)

showDate  = input(defval = true, title = "Show Date Range", type = input.bool)

start     = timestamp(fromYear, fromMonth, fromDay, 00, 00)        // backtest start window
finish    = timestamp(thruYear, thruMonth, thruDay, 23, 59)        // backtest finish window
window()  => true       // create function "within window of time"


// RSI inputs and calculations
lengthRSI = (14)
RSI = rsi(close, lengthRSI)

RSI_entry = input(35, title = 'RSI Entry', minval=1)
RSI_exit = input(65, title = 'RSI Close', minval=1)

//Calculate Moving Averages
movingaverage_signal = sma(close, input(100))

//Entry
strategy.entry(id="long", long = true, when = RSI< RSI_entry and close < movingaverage_signal and window())

//Exit
//RSI
strategy.close("long", when = RSI > RSI_exit and window())

plot (movingaverage_signal)