Estrategia de seguimiento de tendencias que combina doble EMA y RSI
Descripción general
La estrategia utiliza el doble EMA y el RSI para identificar la tendencia de los precios en combinación y entrar en juego a la hora de un giro en la dirección de la tendencia. En concreto, la estrategia utiliza el EMA de un período más largo para determinar la dirección de la tendencia mayor, mientras que el RSI utiliza el RSI para determinar el fenómeno de sobreventa de sobreventa a corto plazo.
Principio de estrategia
Utiliza la EMA de 200 períodos para determinar la dirección de la tendencia general. El precio cruza la línea EMA superior como una señal de alza, y la línea EMA inferior como una señal de baja.
El indicador RSI está configurado para 10 períodos. Si el RSI pasa de 40 para una señal de venta excesiva y 60 para una señal de compra excesiva.
Cuando la tendencia principal es al alza (cuando el precio está por encima de la línea EMA), si se produce una señal de venta por encima de 40 por debajo del indicador RSI, haga una entrada adicional.
Cuando la tendencia general es a la baja (precio por debajo de la línea EMA), si se produce una señal de sobrecompra de 60 en el indicador RSI, hacer una entrada en el mercado.
El Stop Loss es 4 veces el ATR. El Stop Loss es 2 veces el ATR.
Análisis de las ventajas
La mayor ventaja de esta estrategia es la combinación de tendencia y reversión al mismo tiempo, la posibilidad de entrar en juego a tiempo cuando la tendencia se retira, por lo que se puede obtener un mejor rendimiento. Las ventajas concretas son las siguientes:
El uso de sistemas de doble EMA para determinar la dirección de las tendencias principales permite un seguimiento eficaz de las tendencias de precios.
El indicador RSI puede identificar sobrecompras y sobreventas en el corto plazo, ayudando a determinar cuándo entrar en el mercado.
El stop loss se establece a través del indicador ATR, que puede ajustar el stop loss en función de la volatilidad del mercado, lo que es favorable para el control del riesgo.
Siguiendo estrictamente los principios de la tendencia de negociación, se puede reducir la transacción innecesaria y reducir el riesgo sistemático.
Análisis de riesgos
El principal riesgo de esta estrategia es:
En el proceso de debilitamiento de la oscilación de la tendencia, puede producirse una señal de negociación errónea.
En casos extremos, los paros establecidos por el indicador ATR pueden ser demasiado grandes o demasiado pequeños y requieren un ajuste dinámico. También se puede considerar la sustitución por otros paros.
La frecuencia de las señales de transacción puede ser alta, por lo que es necesario tener en cuenta si se ajusta a las preferencias de frecuencia de transacción.
Se debe prestar atención a si los parámetros del RSI están configurados adecuadamente y se debe optimizar los parámetros cuando sea necesario.
Dirección de optimización
Las principales áreas de optimización de la estrategia son las siguientes:
Se pueden probar otros indicadores de tendencia, como el MACD, para ayudar a determinar la dirección de la tendencia.
Se pueden probar otros indicadores de reversión, como KDJ, bandas de Brin y otros en combinación con el RSI, en busca de mejores señales de negociación.
Se pueden introducir algoritmos de aprendizaje automático para lograr el stop loss y el stop stop dinámico mediante la adaptación de los parámetros.
Se pueden combinar más factores de evaluación, como indicadores de emoción, la superficie de la noticia, para mejorar la estabilidad general del sistema.
Resumir
En general, esta estrategia es una estrategia de línea corta muy típica que combina el seguimiento de la tendencia y el indicador de reversión. Al usar el doble EMA para juzgar la tendencia general, al mismo tiempo que utiliza la característica de reversión del indicador RSI para capturar la oportunidad de pullback en la tendencia. En principio, esta estrategia combina las ventajas de diferentes indicadores juntos, FORM tiene un buen efecto complementario.
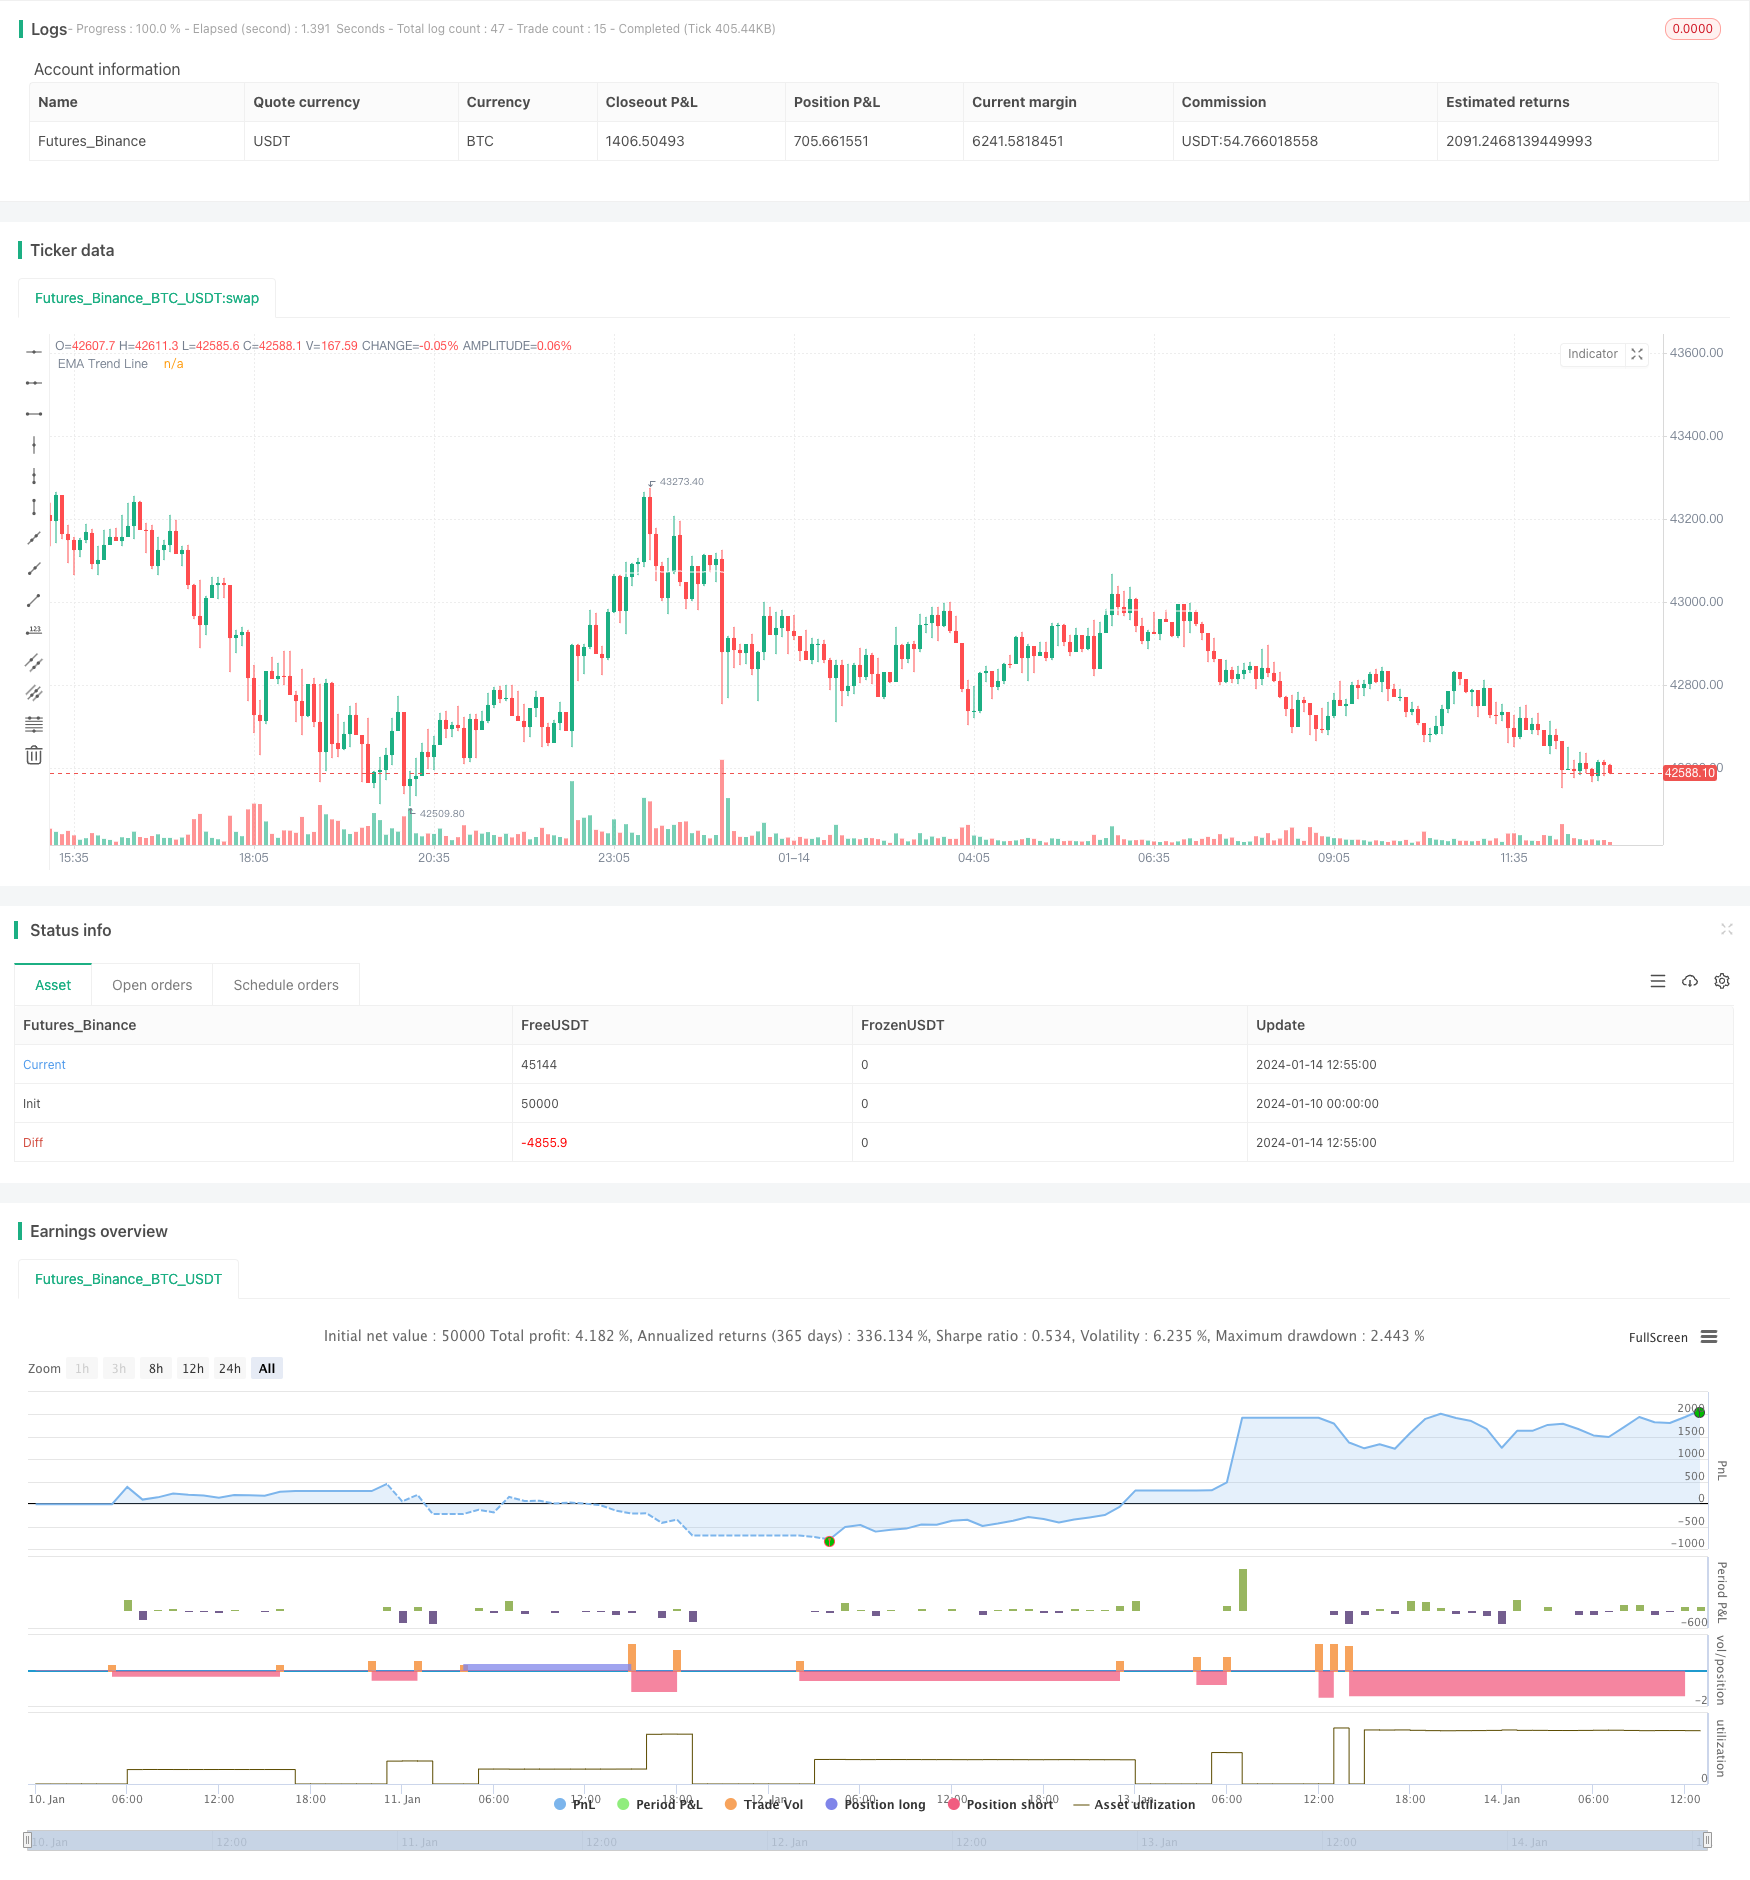
/*backtest
start: 2024-01-10 00:00:00
end: 2024-01-14 13:00:00
period: 5m
basePeriod: 1m
exchanges: [{"eid":"Futures_Binance","currency":"BTC_USDT"}]
*/

// This source code is subject to the terms of the Mozilla Public License 2.0 at https://mozilla.org/MPL/2.0/
// © kevinmck100

// @description
// This strategy is intended to be used as a base template for building new strategies.
//
// It incorporates the following features:
//
//      - Risk management:  Configurable X% loss per stop loss
//                          Configurable R:R ratio
//
//      - Trade entry:      Calculated position size based on risk tolerance
//
//      - Trade exit:       Stop Loss currently configurable ATR multiplier but can be replaced based on strategy
//                          Take Profit calculated from Stop Loss using R:R ratio
//
//      - Backtesting:      Configurable backtesting range by date
//
//      - Trade drawings:   TP/SL boxes drawn for all trades. Can be turned on and off
//                          Trade exit information labels. Can be turned on and off
//                          NOTE: Trade drawings will only be applicable when using overlay strategies
//
//      - Debugging:        Includes section with useful debugging techniques
//
// Strategy conditions:
//
//      - Trade entry:      LONG:   C1: Price is above EMA line
//                                  C2: RSI is crossing out of oversold area
//                          SHORT:  C1: Price is below EMA line
//                                  C2: RSI is crossing out of overbought area
//
//      - Trade exit:       Stop Loss:      Stop Loss ATR multiplier is hit
//                          Take Profit:    R:R multiplier * Stop Loss is hit
//
// The idea is to use RSI to catch pullbacks within the main trend. Note that
// this strategy is intended to be a simple base strategy for building upon.
// It was not designed to be traded in its current form.

//@version=5
INITIAL_CAPITAL = 1000
DEFAULT_COMMISSION = 0.02
MAX_DRAWINGS = 500
IS_OVERLAY = true

strategy("Risk Management Strategy Template", "Strategy Template", overlay = IS_OVERLAY, initial_capital = INITIAL_CAPITAL, currency = currency.NONE, max_labels_count = MAX_DRAWINGS, max_boxes_count = MAX_DRAWINGS, max_lines_count = MAX_DRAWINGS, default_qty_type = strategy.cash, commission_type = strategy.commission.percent, commission_value = DEFAULT_COMMISSION)

// =============================================================================
// INPUTS
// =============================================================================

// ------------------------ Replacable section - Start -------------------------
// ------------------
// Indicator Settings
// ------------------
emaLength           = input.int (200,   "EMA Length          ",             group = "Indicators: Settings",         inline = "IS1", minval = 1,                 tooltip = "EMA line to identify trend direction. Above EMA trend line is bullish. Below EMA trend line is bearish")
rsiLength           = input.int (10,    "RSI Length            ",           group = "Indicators: Settings",         inline = "IS2", minval = 1)

// ----------------------
// Trade Entry Conditions
// ----------------------
rsiOverbought       = input.int (60,    "RSI Overbought        ",           group = "Strategy: Conditions",         inline = "SC1", minval = 50, maxval = 100,  tooltip = "RSI overbought level used to identify pullbacks within the main trend. RSI crossing BELOW this level triggers a SHORT when in a DOWN trend")
rsiOversold         = input.int (40,    "RSI Oversold          ",           group = "Strategy: Conditions",         inline = "SC2", minval = 0,  maxval = 50,   tooltip = "RSI overbought level used to identify pullbacks within the main trend. RSI crossing ABOVE this level triggers a LONG when in an UP trend")

// ---------------------
// Trade Exit Conditions
// ---------------------
atrLength           = input.int  (14,   "Stop Loss ATR Length      ",       group = "Strategy: Exit Conditions",    inline = "EC1", minval = 0,                 tooltip = "Length of ATR used to calculate Stop Loss.")
slAtrMultiplier     = input.float(4,    "Stop Loss ATR Multiplier     ",    group = "Strategy: Exit Conditions",    inline = "EC2", minval = 0, step = 0.1,     tooltip = "Size of StopLoss is determined by multiplication of ATR value. Take Profit is derived from this also by multiplying the StopLoss value by the Risk:Reward multiplier.")
// ------------------------- Replacable section - End --------------------------

// ---------------
// Risk Management
// ---------------
riskReward          = input.float(2,    "Risk : Reward        1 :",         group = "Strategy: Risk Management",    inline = "RM1", minval = 0, step = 0.1,     tooltip = "Previous high or low (long/short dependant) is used to determine TP level. 'Risk : Reward' ratio is then used to calculate SL based of previous high/low level.\n\nIn short, the higher the R:R ratio, the smaller the SL since TP target is fixed by previous high/low price data.")
accountRiskPercent  = input.float(1,    "Portfolio Risk %         ",        group = "Strategy: Risk Management",    inline = "RM1", minval = 0, step = 0.1,     tooltip = "Percentage of portfolio you lose if trade hits SL.\n\nYou then stand to gain\n  Portfolio Risk % * Risk : Reward\nif trade hits TP.")

// ----------
// Date Range
// ----------
startYear           = input.int (2022,  "Start Date       ",                group = 'Strategy: Date Range',         inline = 'DR1', minval    = 1900, maxval = 2100)
startMonth          = input.int (1,     "",                                 group = 'Strategy: Date Range',         inline = 'DR1', options   = [1, 2, 3, 4, 5, 6, 7, 8, 9, 10, 11, 12])
startDate           = input.int (1,     "",                                 group = 'Strategy: Date Range',         inline = 'DR1', options   = [1, 2, 3, 4, 5, 6, 7, 8, 9, 10, 11, 12, 13, 14, 15, 16, 17, 18, 19, 20, 21, 22, 23, 24, 25, 26, 27, 28, 29, 30, 31])
endYear             = input.int (2100,  "End Date      ",                   group = 'Strategy: Date Range',         inline = 'DR2', minval    = 1900, maxval = 2100)
endMonth            = input.int (1,     "",                                 group = 'Strategy: Date Range',         inline = 'DR2', options   = [1, 2, 3, 4, 5, 6, 7, 8, 9, 10, 11, 12])
endDate             = input.int (1,     "",                                 group = 'Strategy: Date Range',         inline = 'DR2', options   = [1, 2, 3, 4, 5, 6, 7, 8, 9, 10, 11, 12, 13, 14, 15, 16, 17, 18, 19, 20, 21, 22, 23, 24, 25, 26, 27, 28, 29, 30, 31])

// ----------------
// Drawing Settings
// ----------------
showTpSlBoxes       = input.bool(false,  "Show TP / SL Boxes",               group = "Strategy: Drawings",           inline = "D1",  tooltip = "Show or hide TP and SL position boxes.\n\nNote: TradingView limits the maximum number of boxes that can be displayed to 500 so they may not appear for all price data under test.")
showLabels          = input.bool(false, "Show Trade Exit Labels",           group = "Strategy: Drawings",           inline = "D2",  tooltip = "Useful labels to identify Profit/Loss and cumulative portfolio capital after each trade closes.\n\nAlso note that TradingView limits the max number of 'boxes' that can be displayed on a chart (max 500). This means when you lookback far enough on the chart you will not see the TP/SL boxes. However you can check this option to identify where trades exited.")

// =============================================================================
// INDICATORS
// =============================================================================

// ------------------------ Replacable section - Start -------------------------
// ---
// EMA
// ---
ema = ta.ema(close, emaLength)
plot(ema, "EMA Trend Line", color.white)

// ---
// RSI
// ---
rsi = ta.rsi(close, rsiLength)
// ------------------------- Replacable section - End --------------------------


// =============================================================================
// STRATEGY LOGIC
// =============================================================================

// ---------
// FUNCTIONS
// ---------

percentAsPoints(pcnt) =>
    math.round(pcnt / 100 * close / syminfo.mintick)

calcStopLossPrice(pointsOffset, isLong) =>
    priceOffset = pointsOffset * syminfo.mintick
    if isLong
        close - priceOffset
    else
        close + priceOffset

calcProfitTrgtPrice(pointsOffset, isLong) =>
    calcStopLossPrice(-pointsOffset, isLong)


printLabel(barIndex, msg) => label.new(barIndex, close, msg)

printTpSlHitBox(left, right, slHit, tpHit, entryPrice, slPrice, tpPrice) =>
    if showTpSlBoxes
        box.new (left = left,   top = entryPrice,   right = right,  bottom = slPrice,   bgcolor = slHit ? color.new(color.red, 60)   : color.new(color.gray, 90), border_width = 0)
        box.new (left = left,   top = entryPrice,   right = right,  bottom = tpPrice,   bgcolor = tpHit ? color.new(color.green, 60) : color.new(color.gray, 90), border_width = 0)
        line.new(x1 = left,     y1 = entryPrice,    x2 = right,     y2 = entryPrice,    color = color.new(color.yellow, 20))
        line.new(x1 = left,     y1 = slPrice,       x2 = right,     y2 = slPrice,       color = color.new(color.red, 20))
        line.new(x1 = left,     y1 = tpPrice,       x2 = right,     y2 = tpPrice,       color = color.new(color.green, 20))

printTpSlNotHitBox(left, right, entryPrice, slPrice, tpPrice) =>
    if showTpSlBoxes
        box.new (left = left,   top = entryPrice,   right = right,  bottom = slPrice,   bgcolor = color.new(color.gray, 90), border_width = 0)
        box.new (left = left,   top = entryPrice,   right = right,  bottom = tpPrice,   bgcolor = color.new(color.gray, 90), border_width = 0)
        line.new(x1 = left,     y1 = entryPrice,    x2 = right,     y2 = entryPrice,    color = color.new(color.yellow, 20))
        line.new(x1 = left,     y1 = slPrice,       x2 = right,     y2 = slPrice,       color = color.new(color.red, 20))
        line.new(x1 = left,     y1 = tpPrice,       x2 = right,     y2 = tpPrice,       color = color.new(color.green, 20))

printTradeExitLabel(x, y, posSize, entryPrice, pnl) =>
    if showLabels
        labelStr = "Position Size: " + str.tostring(math.abs(posSize), "#.##") + "\nPNL: " + str.tostring(pnl, "#.##") + "\nCapital: " + str.tostring(strategy.equity, "#.##") + "\nEntry Price: " + str.tostring(entryPrice, "#.##")
        label.new(x = x, y = y, text = labelStr, color = pnl > 0 ? color.new(color.green, 60) : color.new(color.red, 60), textcolor = color.white, style = label.style_label_down)

// ----------
// CONDITIONS
// ----------

inDateRange         = time >= timestamp(syminfo.timezone, startYear, startMonth, startDate, 0, 0) and time < timestamp(syminfo.timezone, endYear, endMonth, endDate, 0, 0)

// ------------------------ Replacable section - Start -------------------------
// Condition 1: Price above EMA indicates bullish trend, price below EMA indicates bearish trend
bullEma             = close > ema
bearEma             = close < ema

// Condition 2: RSI crossing back from overbought/oversold indicates pullback within trend
bullRsi             = ta.crossover  (rsi, rsiOversold)
bearRsi             = ta.crossunder (rsi, rsiOverbought)

// Combine all entry conditions
goLong              = inDateRange and bullEma and bullRsi
goShort             = inDateRange and bearEma and bearRsi
// ------------------------- Replacable section - End --------------------------

// Trade entry and exit variables
var tradeEntryBar   = bar_index
var profitPoints    = 0.
var lossPoints      = 0.
var slPrice         = 0.
var tpPrice         = 0.
var inLong          = false
var inShort         = false

// Entry decisions
openLong            = (goLong and not inLong)
openShort           = (goShort and not inShort)
flippingSides       = (goLong and inShort) or (goShort and inLong)
enteringTrade       = openLong or openShort
inTrade             = inLong or inShort

// ------------------------ Replacable section - Start -------------------------
// Exit calculations
atr                 = ta.atr(atrLength)
slAmount            = atr * slAtrMultiplier
slPercent           = math.abs((1 - (close - slAmount) / close) * 100)
tpPercent           = slPercent * riskReward
// ------------------------- Replacable section - End --------------------------

// Risk calculations
riskAmt             = strategy.equity * accountRiskPercent / 100
entryQty            = math.abs(riskAmt / slPercent * 100)  / close

if openLong
    if strategy.position_size < 0
        printTpSlNotHitBox(tradeEntryBar + 1, bar_index + 1, strategy.position_avg_price, slPrice, tpPrice)
        printTradeExitLabel(bar_index + 1, math.max(tpPrice, slPrice), strategy.position_size, strategy.position_avg_price, strategy.openprofit)
    strategy.entry("Long", strategy.long, qty = entryQty, alert_message = "Long Entry")
    enteringTrade   := true
    inLong          := true
    inShort         := false

if openShort
    if strategy.position_size > 0
        printTpSlNotHitBox(tradeEntryBar + 1, bar_index + 1, strategy.position_avg_price, slPrice, tpPrice)
        printTradeExitLabel(bar_index + 1, math.max(tpPrice, slPrice), strategy.position_size, strategy.position_avg_price, strategy.openprofit)
    strategy.entry("Short", strategy.short, qty = entryQty, alert_message = "Short Entry")
    enteringTrade   := true
    inShort         := true
    inLong          := false

if enteringTrade
    profitPoints    := percentAsPoints(tpPercent)
    lossPoints      := percentAsPoints(slPercent)
    slPrice         := calcStopLossPrice(lossPoints, openLong)
    tpPrice         := calcProfitTrgtPrice(profitPoints, openLong)
    tradeEntryBar   := bar_index

strategy.exit("TP/SL", profit = profitPoints, loss = lossPoints, comment_profit = "TP Hit", comment_loss = "SL Hit", alert_profit = "TP Hit Alert", alert_loss = "SL Hit Alert")

// =============================================================================
// DRAWINGS
// =============================================================================

// -----------
// TP/SL Boxes
// -----------

slHit           = (inShort and high >= slPrice) or (inLong  and low <= slPrice)
tpHit           = (inLong  and high >= tpPrice) or (inShort and low <= tpPrice)
exitTriggered   = slHit or tpHit
entryPrice      = strategy.closedtrades.entry_price (strategy.closedtrades - 1)
pnl             = strategy.closedtrades.profit      (strategy.closedtrades - 1)
posSize         = strategy.closedtrades.size        (strategy.closedtrades - 1)

// Print boxes for trades closed at profit or loss
if (inTrade and exitTriggered)
    inShort    := false
    inLong     := false
    printTpSlHitBox(tradeEntryBar + 1, bar_index, slHit, tpHit, entryPrice, slPrice, tpPrice)
    printTradeExitLabel(bar_index, math.max(tpPrice, slPrice), posSize, entryPrice, pnl)

// Print TP/SL box for current open trade
if barstate.islastconfirmedhistory and strategy.position_size != 0
    printTpSlNotHitBox(tradeEntryBar + 1, bar_index + 1, strategy.position_avg_price, slPrice, tpPrice)

// =============================================================================
// DEBUGGING
// =============================================================================

// Data window plots
plotchar(slPrice,    "Stop Loss Price",     "")
plotchar(tpPrice,    "Take Profit Price",   "")

// Label plots
plotDebugLabels = false
if plotDebugLabels
    if bar_index == tradeEntryBar
        printLabel(bar_index, "Position size: " + str.tostring(entryQty * close, "#.##"))