Estrategia de trading cuantitativo basada en Ichimoku Kinko Hyo y el índice direccional promedio
Descripción general
La estrategia utiliza un indicador técnico combinado de la tabla de equilibrio a primera vista y el índice de dirección promedio (ADX) para identificar tendencias en los precios de las acciones y puntos de resistencia de soporte clave para emitir señales de compra y venta. La estrategia está diseñada para capturar grandes fluctuaciones de precios en situaciones de tendencia.
Principio de estrategia
La tabla de equilibrio visual contiene tres promedios móviles de la línea de conversión anterior, la línea de referencia y la línea de retardo. Cuando el precio cruza la línea de conversión anterior y la línea de referencia por encima, emite una señal de compra; cuando el precio cruza las dos líneas por debajo, emite una señal de venta. Además, la tabla de equilibrio visual también identifica las áreas de resistencia de soporte clave a través de un gráfico en la nube.
El ADX se utiliza para determinar la intensidad de la tendencia de los precios. Cuando +DI y -DI están claramente separados, indica la tendencia; cuando +DI y -DI están cerca, indica la tendencia de la reestructuración. Esta estrategia emite una señal de negociación solo cuando el ADX es mayor que 20 para evitar la captura de falsas rupturas en el período de reestructuración.
El uso combinado de la evaluación de tendencias de la tabla de equilibrio a primera vista y el filtro de la ADX sobre la fuerza de la tendencia, puede identificar de manera efectiva los segmentos de tendencia con mayor volatilidad de los precios.
Ventajas estratégicas
- El uso de una combinación de dos indicadores hace que las señales de negociación sean más fiables
- El uso de ADX evita transacciones erróneas en el balance
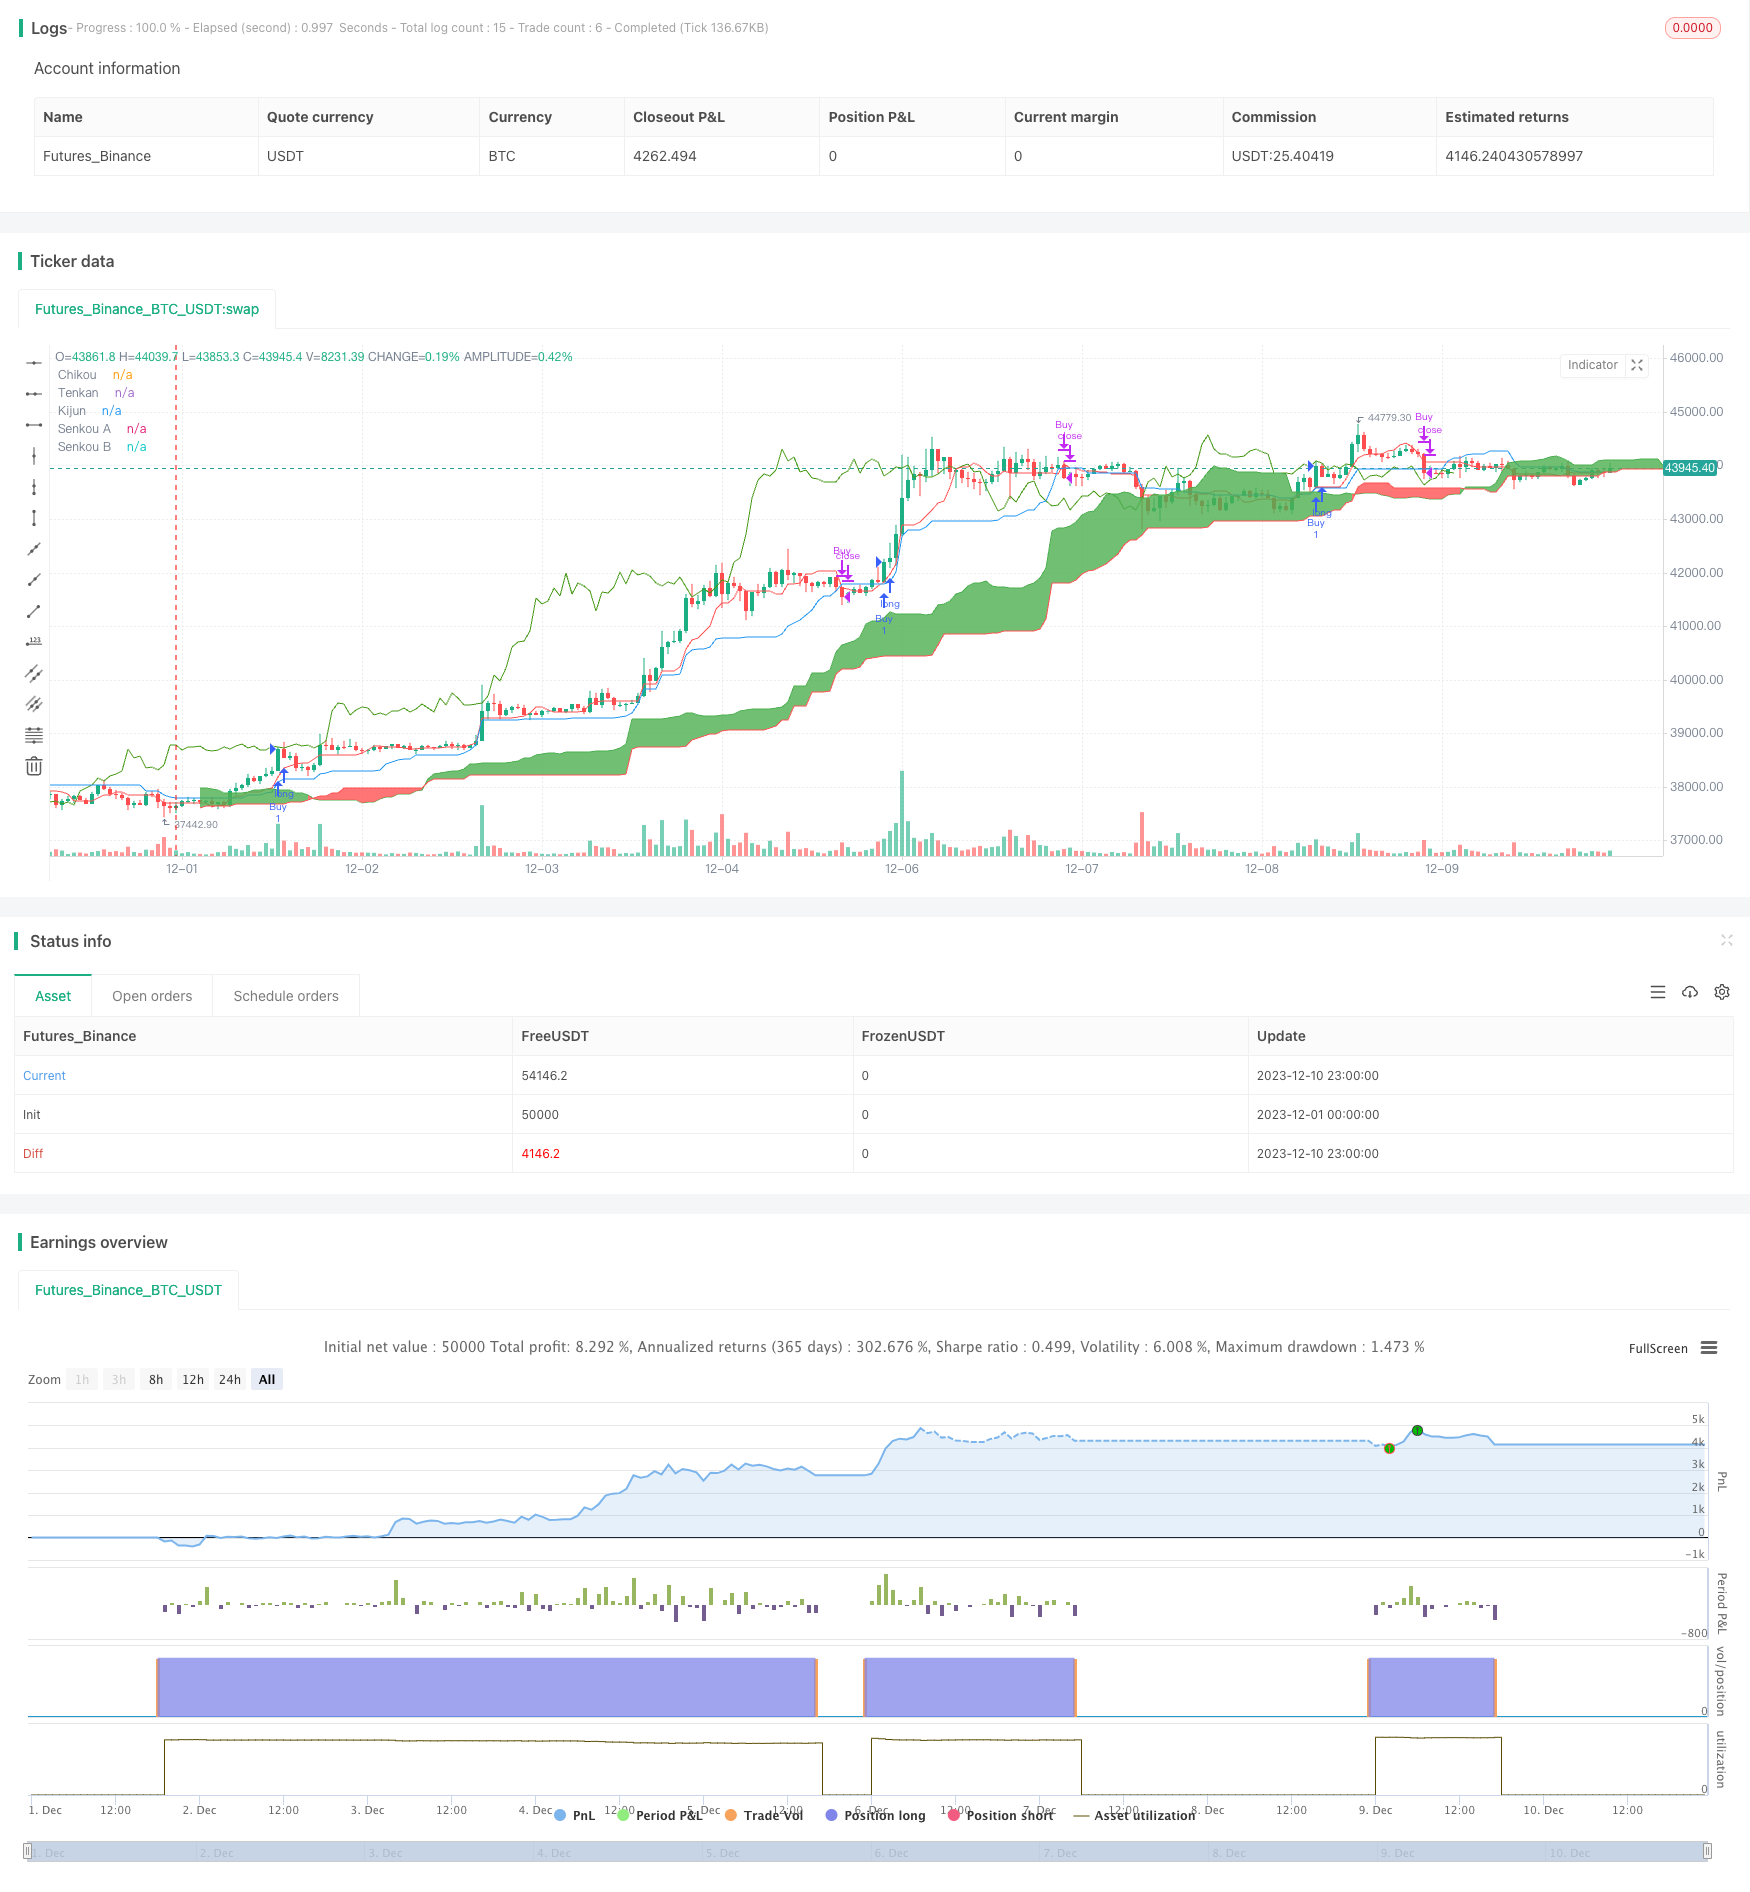
- El rendimiento de la retroalimentación es bueno, los beneficios son más altos que los riesgos
Análisis de riesgos
- Esta estrategia es más adecuada para las acciones de tendencia, donde las señales pueden ser menos para las acciones consolidadas.
- La propia tabla de equilibrio de un solo vistazo tiene problemas de retraso en la respuesta y puede perder la oportunidad de una rápida reversión.
- El ADX no es perfecto en su evaluación de la situación, y puede equivocarse.
Dirección de optimización
- Se pueden probar diferentes combinaciones de parámetros, como el ajuste de la línea de conversión, el ciclo de la línea de referencia
- Se puede optimizar aún más con otros indicadores como MACD, KD, etc.
- Se pueden estudiar diferentes reglas o condiciones de filtración de ADX
Resumir
La estrategia capta la tendencia a través de la combinación efectiva de la tabla de equilibrio a primera vista y el ADX. Basándose en la optimización de parámetros y reglas adicionales, la estrategia puede obtener un mejor rendimiento de retorno y de liquidez.
/*backtest
start: 2023-12-01 00:00:00
end: 2023-12-10 23:59:59
period: 1h
basePeriod: 15m
exchanges: [{"eid":"Futures_Binance","currency":"BTC_USDT"}]
*/

//@version=4
strategy(title="Ichimoku + ADX", shorttitle="Ichimoku & ADX Backtest", overlay=true)

//------------------------------
//------------------------------
// ICHIMOKU
//------------------------------
//------------------------------

conversionPeriods = input(9, minval=1, title="Conversion Line Periods"),
basePeriods = input(26, minval=1, title="Base Line Periods")
laggingSpan2Periods = input(52, minval=1, title="Lagging Span 2 Periods"),
displacement = input(26, minval=1, title="Displacement")

donchian(len) => avg(lowest(len), highest(len))

Tenkan = donchian(conversionPeriods)
Kijun = donchian(basePeriods)
SSA = avg(Tenkan, Kijun)
SSB = donchian(laggingSpan2Periods)

SSAdisp = SSA[displacement]
SSBdisp = SSB[displacement]

// Plot Ichimoku
// --------------------

plot(Tenkan, color=color.red, title="Tenkan")
plot(Kijun, color=color.blue, title="Kijun")
plot(close, offset = -displacement + 1, color=#459915, title="Chikou")


p1 = plot(SSA, offset = displacement - 1, color=color.green,
 title="Senkou A")
p2 = plot(SSB, offset = displacement - 1, color=color.red,
 title="Senkou B")
fill(p1, p2, color = SSA > SSB ? color.green : color.red)

//------------------------------
//------------------------------
// ADX
//------------------------------
//------------------------------

adxlen = input(14, title="ADX Smoothing")
dilen = input(14, title="DI Length")
keyLevel = input(23, title="key level for ADX")
dirmov(len) =>
	up = change(high)
	down = -change(low)
	truerange = rma(tr, len)
	plus = fixnan(100 * rma(up > down and up > 0 ? up : 0, len) / truerange)
	minus = fixnan(100 * rma(down > up and down > 0 ? down : 0, len) / truerange)
	[plus, minus]

adx(dilen, adxlen) =>
	[plus, minus] = dirmov(dilen)
	sum = plus + minus
	adx = 100 * rma(abs(plus - minus) / (sum == 0 ? 1 : sum), adxlen)
	[adx, plus, minus]

[sig, up, down] = adx(dilen, adxlen)

// Plot ADX
// --------------------

//plot(sig, color=color.black, title="ADX")
//plot(up, color=color.green, title="+DI",linewidth=2, style=plot.style_columns, transp=40)
//plot(down, color=color.red, title="-DI",linewidth=2, style=plot.style_columns, transp=40)
//plot(keyLevel, color=color.white, title="Key Level")


//------------------------------
//------------------------------
// STRATEGY
//------------------------------
//------------------------------

// Buy & Sell Signals
// --------------------

// ADX
ABuy1 = up > keyLevel and up - down >5 and sig > down and sig < keyLevel * 2
ASell1 = down > keyLevel and down - up >5 and sig > up and sig < keyLevel * 2


// ICHIMOKU

Bull = close >= max(SSAdisp, SSBdisp)
Bear = close <= min(SSAdisp, SSBdisp)

//  1. Bull
Buy1 = (close >= max(SSAdisp, SSBdisp)) ? 1 : 0
Buy2 = (Tenkan - Kijun >= 0.001) ? 1 : 0
Buy3 = SSA > SSB ? 1 : 0
Buy4 = sig > 20 ? 1 : 0
Buy4a = close - close[displacement] >=0.001 ? 1:0
Buy5 = Buy1 and Buy2 and Buy3 and Buy4 and Buy4a and not(Buy1[1] and Buy2[1] and Buy3[1])

//  1. Bear
Sell1 = (close <= min(SSAdisp, SSBdisp)) ? 1 : 0
Sell2 = (Kijun - Tenkan >= 0.001) ? 1 : 0
Sell3 = SSA < SSB ? 1 : 0
Sell4 = sig > 20 ? 1 : 0
Sell4a = close <= close[displacement]
Sell5 = Sell1 and Sell2 and Sell3 and Sell4 and Sell4a and not(Sell1[1] and Sell2[1] and Sell3[1])


// CONSOLIDATED

buysignal = Buy5
buyexitsignal = crossunder(close,Kijun)

sellsignal = Sell5
sellexitsignal = crossover(close,Kijun)

longCondition = buysignal
shortCondition = sellsignal

// Plot Indicators
// --------------------

// ----- Buy & Sell

//plotshape(longCondition, title = "Buy Signal", text ="BUY", textcolor =#FFFFFF , style=shape.labelup, size = size.tiny, location=location.belowbar, color = #1B8112, transp = 0)
//plotshape(shortCondition, title = "Short Signal", text ="SHORT", textcolor =#FFFFFF , style=shape.labeldown, size = size.tiny, location=location.abovebar, color = #000000, transp = 0)

// ----- Ichimoku Signals

//plotshape(Sell2, title = "Sell Signal", text ="Kumo Twist", textcolor =#FFFFFF , style=shape.labelup, size = size.tiny, location=location.top, color = color.black, transp = 0)
//plotshape(Sell3, title = "Sell Signal", text ="TK/KJ", textcolor =#FFFFFF , style=shape.labelup, size = size.tiny, location=location.bottom, color = color.black, transp = 0)

//plotshape(Buy4, title = "Buy Signal", text ="Kumo Twist", textcolor =#FFFFFF , style=shape.diamond, size = size.tiny, location=location.belowbar, color = color.blue, transp = 0)
//plotshape(Buy3, title = "Buy Signal", text ="TK/KJ", textcolor =#FFFFFF , style=shape.circle, size = size.tiny, location=location.abovebar, color = color.green, transp = 0)
//plotshape(Buy4, title = "Buy Signal", text ="TK/KJ", textcolor =#FFFFFF , style=shape.circle, size = size.tiny, location=location.belowbar, color = color.red, transp = 0)


//plotshape(buyexitsignal, title = "Buy Exit", style=shape.triangledown, size = size.tiny, location=location.abovebar, color = color.green, transp = 0)
//plotshape(sellexitsignal, title = "Buy Exit", style=shape.triangleup, size = size.tiny, location=location.belowbar, color = color.black, transp = 0)

//------------------------------
//------------------------------
// EXECUTION
//------------------------------
//------------------------------


// Test Range
// --------------------

// === INPUT BACKTEST RANGE ===
FromMonth = input(defval = 2, title = "From Month", minval = 1, maxval = 12)
FromDay   = input(defval = 1, title = "From Day", minval = 1, maxval = 31)
FromYear  = input(defval = 2015, title = "From Year", minval = 2017)
ToMonth   = input(defval = 1, title = "To Month", minval = 1, maxval = 12)
ToDay     = input(defval = 1, title = "To Day", minval = 1, maxval = 31)
ToYear    = input(defval = 9999, title = "To Year", minval = 2017)

// === FUNCTION EXAMPLE ===
start     = timestamp(FromYear, FromMonth, FromDay, 00, 00)  // backtest start window
finish    = timestamp(ToYear, ToMonth, ToDay, 23, 59)        // backtest finish window
window()  => true // create function "within window of time"

// Orders
// --------------------


if longCondition
    strategy.entry("Buy", strategy.long, when=window())

if buyexitsignal
    strategy.close("Buy")

if shortCondition
    strategy.entry("Sell", strategy.short, when=window())

if sellexitsignal
    strategy.close("Sell")