Estrategia de retroceso basada en el impulso
Descripción general
Esta estrategia tiene como objetivo identificar oportunidades potenciales de retroceso en el mercado. La estrategia utiliza un sistema de doble línea: un promedio móvil a largo plazo (MA1) y un promedio móvil a corto plazo (MA2). El objetivo principal es indicar una oportunidad potencial de retroceso en una gran tendencia cuando el precio de cierre está por debajo de MA1 pero por encima de MA2.
Principio de estrategia
La estrategia utiliza dos promedios móviles: MA1 (la línea larga) y MA2 (la línea corta). La idea es que si el precio en el corto plazo retrocede y prueba el soporte de la tendencia a largo plazo, puede ser una oportunidad de hacer más. En concreto, si el precio de cierre es superior al soporte a largo plazo, MA1 indica que la tendencia general sigue siendo buena; y si el precio de cierre cae por encima de la media a corto plazo, MA2, pero se mantiene estable por encima de la media a largo plazo, MA1, es una oportunidad típica de retorno.
Análisis de las ventajas
La estrategia tiene las siguientes ventajas:
- Realización sencilla, fácil de entender y con flexibilidad para ajustar los parámetros
- Identificar las tendencias y evitar el comercio en contra
- Filtros de tiempo personalizables para evitar anomalías del mercado en un período de tiempo específico
- El tamaño de las posiciones se puede ajustar para satisfacer diferentes preferencias de riesgo
- La adopción de un mecanismo de stop loss para limitar el riesgo de pérdidas
Análisis de riesgos
La estrategia también tiene los siguientes riesgos:
- Los precios siguen bajando y no hay manera de detenerlos
- La tendencia se ha invertido y los niveles de soporte se han roto
- Los mercados se vieron afectados por fuertes fluctuaciones y un desvío de la media móvil.
- La mala elección del período de tiempo, la pérdida de oportunidades de negocio
En consecuencia, se puede optimizar y mejorar en los siguientes aspectos:
- Optimización de los parámetros de las medias móviles para mejorar la calidad de las señales de negociación
- Optimización de los niveles de stop loss para obtener ganancias con la premisa de minimizar el riesgo
- Ajuste el filtro de tiempo para orientarse a las mejores horas de negociación
- Prueba de variedades y entornos de mercado
Dirección de optimización
La estrategia puede ser optimizada en los siguientes aspectos:
- Optimización de los parámetros de las medias móviles para encontrar la mejor combinación de parámetros
- Prueba de diferentes mecanismos de deterioro, como el deterioro de seguimiento, el deterioro de la oscilación, etc.
- Añadir otros filtros, como filtros de volumen de transacciones, filtros de fluctuación, etc.
- Aumentar los mecanismos de gestión de la posición, como la adición de la horca dorada y la deducción de la horca muerta
- Mecanismo de frenado automático
- Realizar una revisión y calcular los indicadores clave para determinar los parámetros óptimos
Resumir
Esta estrategia es en general una estrategia de retorno de línea corta simple y práctica. Utiliza dos líneas de igualdad para identificar oportunidades de retroceso y establecer un stop loss móvil para controlar el riesgo. La estrategia es fácil de entender y implementar, los parámetros se pueden ajustar con flexibilidad para satisfacer diferentes preferencias de riesgo.
/*backtest
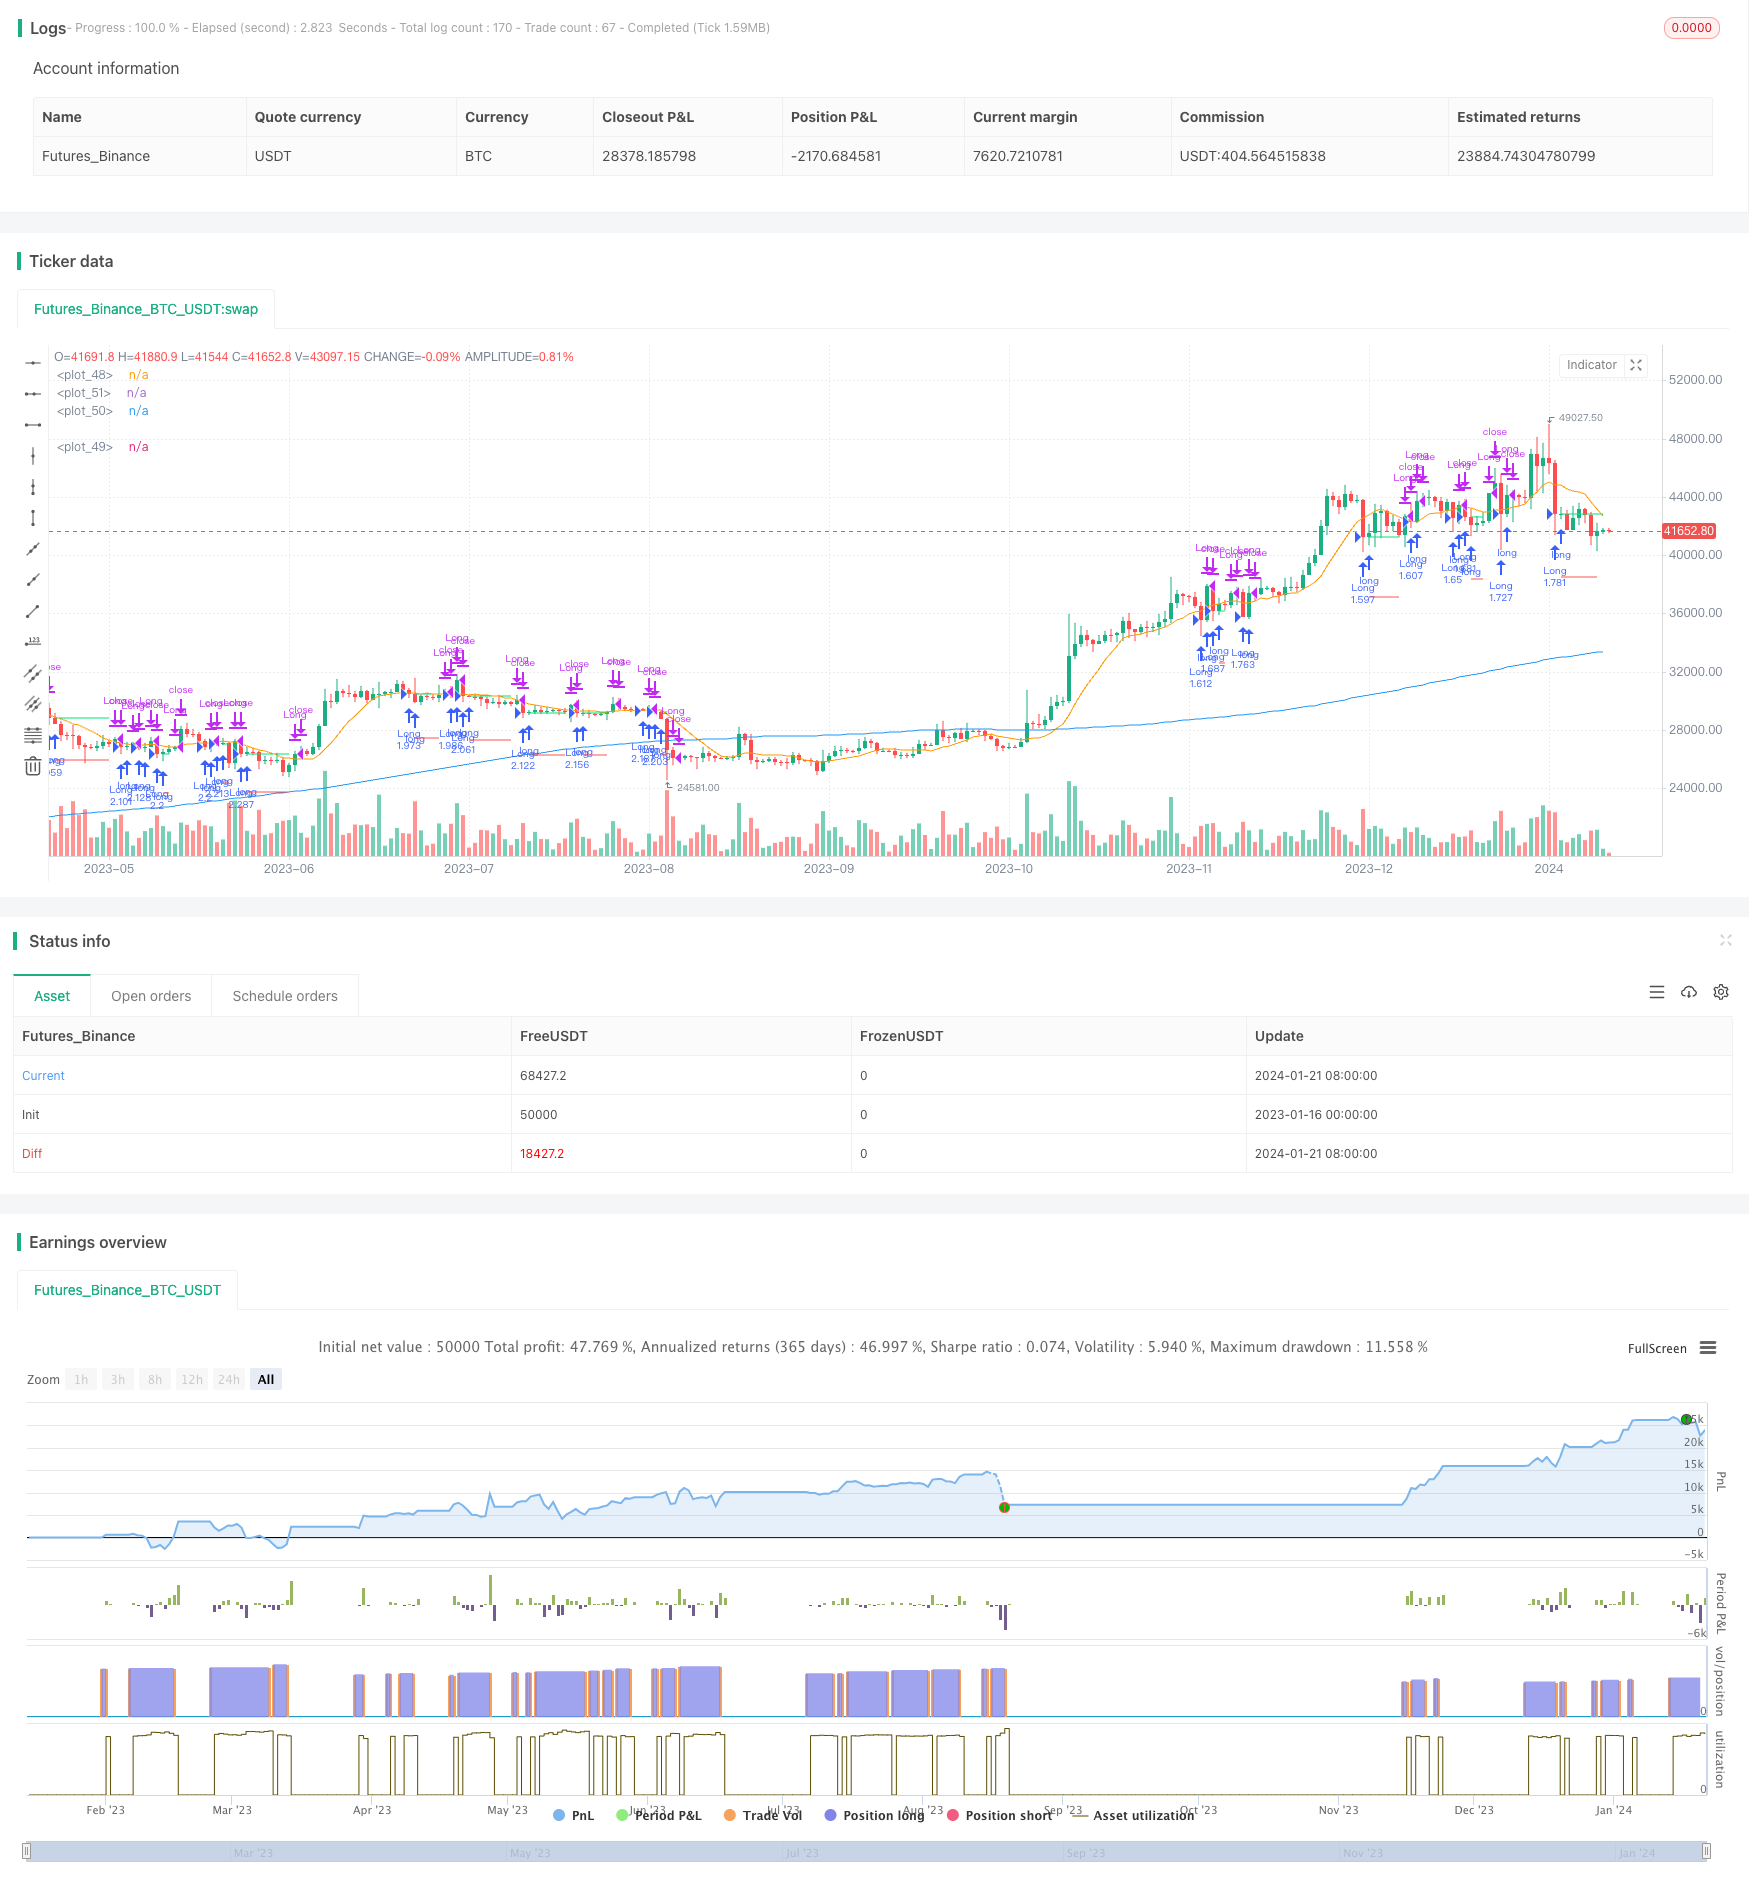
start: 2023-01-16 00:00:00
end: 2024-01-22 00:00:00
period: 1d
basePeriod: 1h
exchanges: [{"eid":"Futures_Binance","currency":"BTC_USDT"}]
*/
// This source code is subject to the terms of the Mozilla Public License 2.0 at https://mozilla.org/MPL/2.0/
// © ZenAndTheArtOfTrading / www.PineScriptMastery.com
// @version=5
strategy("Simple Pullback Strategy",
overlay=true,
initial_capital=50000,
default_qty_type=strategy.percent_of_equity,
default_qty_value=100, // 100% of balance invested on each trade
commission_type=strategy.commission.cash_per_contract,
commission_value=0.005) // Interactive Brokers rate
// Get user input
i_ma1 = input.int(title="MA 1 Length", defval=200, step=10, group="Strategy Parameters", tooltip="Long-term MA")
i_ma2 = input.int(title="MA 2 Length", defval=10, step=10, group="Strategy Parameters", tooltip="Short-term MA")
i_stopPercent = input.float(title="Stop Loss Percent", defval=0.10, step=0.1, group="Strategy Parameters", tooltip="Failsafe Stop Loss Percent Decline")
i_lowerClose = input.bool(title="Exit On Lower Close", defval=false, group="Strategy Parameters", tooltip="Wait for a lower-close before exiting above MA2")
i_startTime = input(title="Start Filter", defval=timestamp("01 Jan 1995 13:30 +0000"), group="Time Filter", tooltip="Start date & time to begin searching for setups")
i_endTime = input(title="End Filter", defval=timestamp("1 Jan 2099 19:30 +0000"), group="Time Filter", tooltip="End date & time to stop searching for setups")
// Get indicator values
ma1 = ta.sma(close, i_ma1)
ma2 = ta.sma(close, i_ma2)
// Check filter(s)
f_dateFilter =true
// Check buy/sell conditions
var float buyPrice = 0
buyCondition = close > ma1 and close < ma2 and strategy.position_size == 0 and f_dateFilter
sellCondition = close > ma2 and strategy.position_size > 0 and (not i_lowerClose or close < low[1])
stopDistance = strategy.position_size > 0 ? ((buyPrice - close) / close) : na
stopPrice = strategy.position_size > 0 ? buyPrice - (buyPrice * i_stopPercent) : na
stopCondition = strategy.position_size > 0 and stopDistance > i_stopPercent
// Enter positions
if buyCondition
strategy.entry(id="Long", direction=strategy.long)
if buyCondition[1]
buyPrice := open
// Exit positions
if sellCondition or stopCondition
strategy.close(id="Long", comment="Exit" + (stopCondition ? "SL=true" : ""))
buyPrice := na
// Draw pretty colors
plot(buyPrice, color=color.lime, style=plot.style_linebr)
plot(stopPrice, color=color.red, style=plot.style_linebr, offset=-1)
plot(ma1, color=color.blue)
plot(ma2, color=color.orange)