Estrategia inteligente de trailing stop loss
Descripción general
La estrategia inteligente de seguimiento de la parada de pérdidas es una estrategia que ajusta automáticamente el punto de parada en función de los cambios en el precio. Combina la lógica del indicador SAR para rastrear y ajustar la línea de parada cuando el precio alcanza un nuevo punto alto o bajo, para lograr el máximo control de reversión.
Principio de estrategia
La lógica central de la estrategia es ajustar automáticamente la línea de parada en función del indicador SAR. En concreto, define 4 variables:
- EP: El punto álgido
- SAR: El punto de parada actual
- AF: Factor de longitud de paso para controlar la amplitud del ajuste de la línea de parada
- Indicadores de tendencia al alza: determinar si la tendencia actual es alza o baja
En una tendencia ascendente, la línea de parada se ajusta constantemente hacia arriba para seguir el aumento de los precios; cuando los precios se convierten en una tendencia descendente, la línea de parada permanece inalterada hasta que se vuelva a una tendencia ascendente.
La amplitud de ajuste de la línea de parada se controla mediante el factor de longitud de paso AF. El AF se incrementa cuando se establece con éxito un nuevo punto de parada, lo que amplía la amplitud de ajuste del siguiente paso.
Ventajas estratégicas
La mayor ventaja de esta estrategia es que se puede ajustar el punto de parada a la fluctuación inteligente del mercado, al tiempo que se garantiza suficiente espacio para obtener ganancias, y también se puede minimizar el máximo retiro. En comparación con los métodos de parada estática tradicionales, se puede capturar mejor la tendencia de los precios.
En concreto, las principales ventajas son las siguientes:
- Reducir el máximo retiro: ajuste inteligente de los límites de pérdidas, para que pueda retirarse antes de que la situación cambie, protegiendo al máximo los beneficios ya obtenidos
- Captura de tendencias: la línea de stop loss se ajusta con nuevas alzas o bajas, para seguir automáticamente la tendencia de los precios
- Parámetros personalizables: el usuario puede personalizar la longitud de paso del AF y el valor de inicio de acuerdo con sus preferencias de riesgo y controlar la sensibilidad del ajuste de stop loss
Análisis de riesgos
La estrategia también tiene algunos riesgos a tener en cuenta:
- Excesivamente sensible: si el paso de la AF se ajusta demasiado o el valor inicial es demasiado pequeño, la línea de parada será demasiado sensible y puede ser activada por una estimulación de ruido del mercado a corto plazo
- Oportunidad perdida: el stop loss se activa demasiado pronto y puede generar ganancias después de que las pérdidas continúen aumentando
- Selección de parámetros: la configuración incorrecta de los parámetros también puede afectar el efecto de la estrategia, por lo que es necesario ajustar los parámetros para diferentes mercados
Dirección de optimización
La estrategia también puede ser optimizada en las siguientes direcciones:
- En combinación con otros indicadores: puede suspender la línea de pérdida cuando se emite una señal en el indicador de grandes períodos, para evitar una parada prematura de pérdidas antes de una reversión de la tendencia
- Módulo de adaptación de parámetros adicionales: se pueden optimizar automáticamente los parámetros según los datos históricos mediante algoritmos de aprendizaje automático
- Múltiples niveles de stop: se pueden establecer varias líneas de stop para seguir las fluctuaciones de la bolsa de diferentes magnitudes
Resumir
La estrategia inteligente de seguimiento de la parada de pérdidas simula la lógica de funcionamiento de los indicadores SAR y ajusta la posición de la línea de parada en tiempo real, protegiendo los beneficios y minimizando las oportunidades de pérdida. Maximiza el valor de la parada de pérdidas por sí misma.
En comparación con las estrategias tradicionales de puntos de parada fijos, la estrategia puede adaptarse mejor a los cambios en el mercado y ser más flexible. A través de la configuración de parámetros personalizados, el usuario puede elegir un modelo de parada adecuado para su propio riesgo.
Por supuesto, la estrategia también tiene cierto espacio para la optimización de los parámetros, y la mejora que se puede lograr en combinación con otros indicadores. En general, encuentra un punto de equilibrio más inteligente para los inversores entre el stop loss y el stop loss.
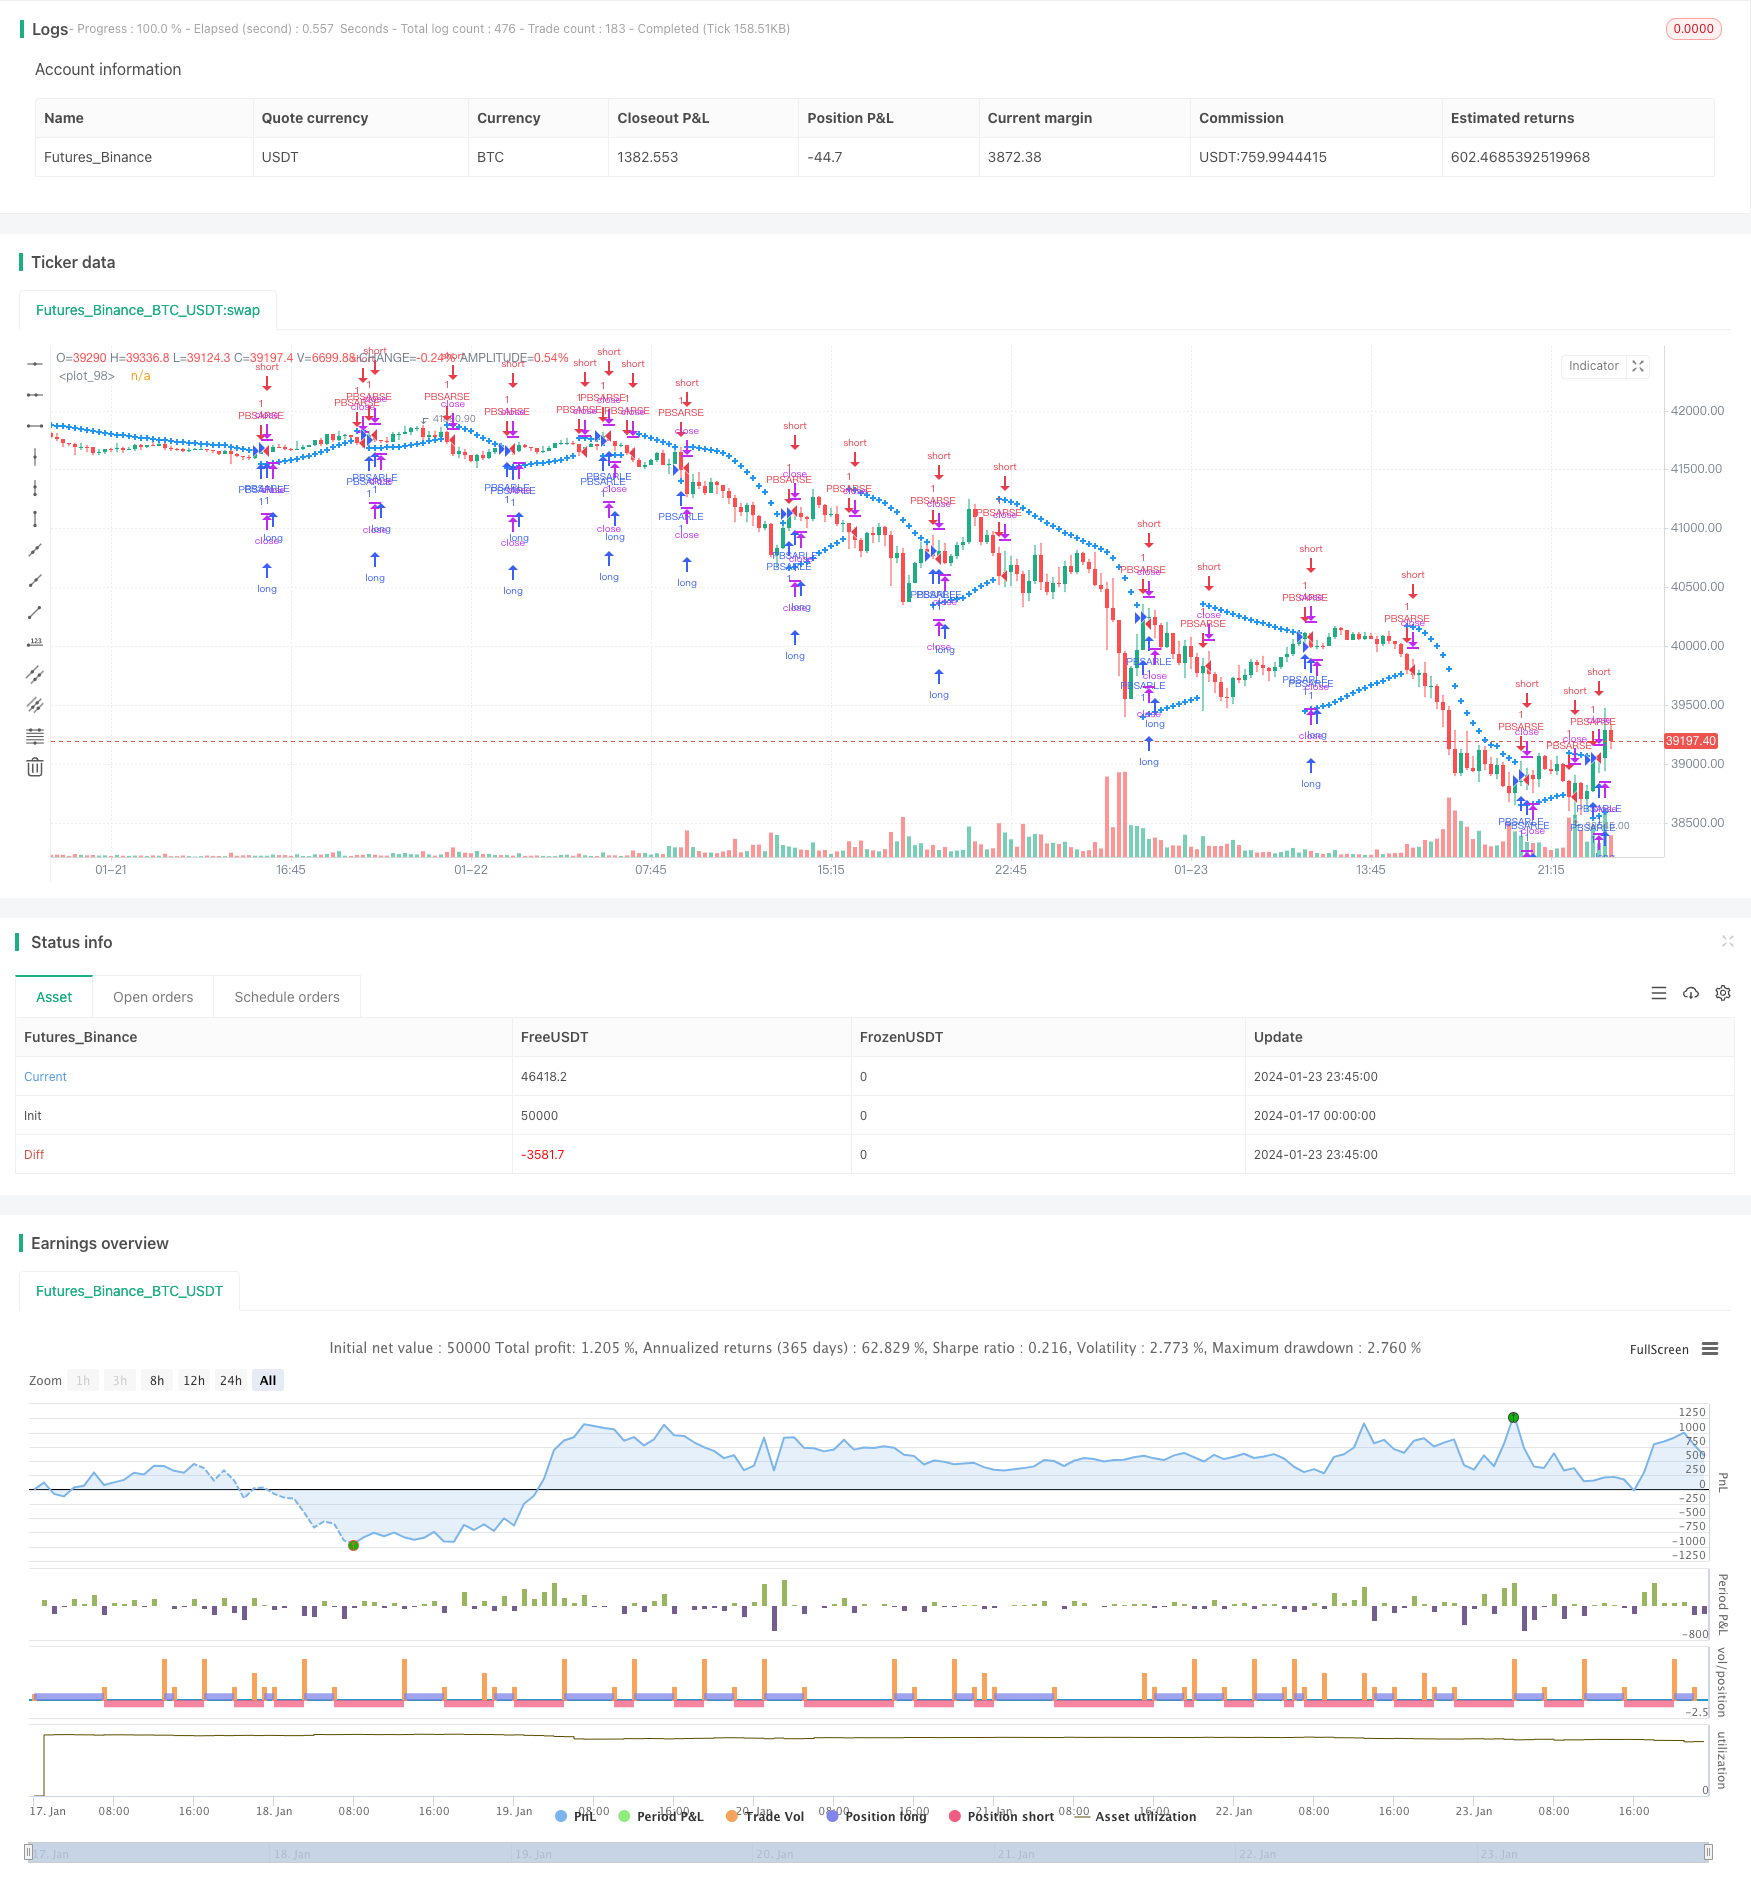
/*backtest
start: 2024-01-17 00:00:00
end: 2024-01-24 00:00:00
period: 15m
basePeriod: 5m
exchanges: [{"eid":"Futures_Binance","currency":"BTC_USDT"}]
*/

//@version=4
strategy("Lucid SAR Strategy", shorttitle="Lucid SAR Strategy", overlay=true)

// Full credit to Sawcruhteez, Lucid Investment Strategies LLC and Casey Bowman.
// This is a strategy version of the Lucid SAR indicator created by the above-mentioned parties.
// Original version of the indicator: https://www.tradingview.com/script/OkACQQgL-Lucid-SAR/

// Branded under the name "Lucid SAR"
// As agreed to with Lucid Investment Strategies LLC on July 9, 2019
// https://lucidinvestmentstrategies.com/


// Created by Casey Bowman on July 4, 2019

// MIT License

// Copyright (c) 2019 Casey Bowman

// Permission is hereby granted, free of charge, to any person obtaining a copy
// of this software and associated documentation files (the "Software"), to deal
// in the Software without restriction, including without limitation the rights
// to use, copy, modify, merge, publish, distribute, sublicense, and/or sell
// copies of the Software, and to permit persons to whom the Software is
// furnished to do so, subject to the following conditions:

// The above copyright notice and this permission notice shall be included in all
// copies or substantial portions of the Software.

// THE SOFTWARE IS PROVIDED "AS IS", WITHOUT WARRANTY OF ANY KIND, EXPRESS OR
// IMPLIED, INCLUDING BUT NOT LIMITED TO THE WARRANTIES OF MERCHANTABILITY,
// FITNESS FOR A PARTICULAR PURPOSE AND NONINFRINGEMENT. IN NO EVENT SHALL THE
// AUTHORS OR COPYRIGHT HOLDERS BE LIABLE FOR ANY CLAIM, DAMAGES OR OTHER
// LIABILITY, WHETHER IN AN ACTION OF CONTRACT, TORT OR OTHERWISE, ARISING FROM,
// OUT OF OR IN CONNECTION WITH THE SOFTWARE OR THE USE OR OTHER DEALINGS IN THE
// SOFTWARE.


AF_initial = input(0.02)
AF_increment = input(0.02)
AF_maximum = input(0.2)


// start with uptrend
uptrend = true
newtrend = false
EP = high
SAR = low
AF = AF_initial

if not na(uptrend[1]) and not na(newtrend[1])
    if uptrend[1]
        EP := max(high, EP[1])
    else
        EP := min(low, EP[1])
    if newtrend[1]
        AF := AF_initial
    else
        if EP != EP[1]
            AF := min(AF_maximum, AF[1] + AF_increment)
        else
            AF := AF[1]
    SAR := SAR[1] + AF * (EP - SAR[1])
    if uptrend[1]
        if newtrend
            SAR := max(high, EP[1])
            EP := min(low, low[1])
        else
            SAR := min(SAR, low[1])
            if not na(low[2])
                SAR := min(SAR, low[2])
            if SAR > low
                uptrend := false
                newtrend := true
                SAR := max(high, EP[1])
                EP := min(low, low[1])
            else
                uptrend := true
                newtrend := false
    else
        if newtrend
            SAR := min(low, EP[1])
            EP := max(high, high[1])
        else
            SAR := max(SAR, high[1])
            if not na(high[2])
                SAR := max(SAR, high[2])
            if SAR < high
                uptrend := true
                newtrend := true
                SAR := min(low, EP[1])
                EP := max(high, high[1])
            else
                uptrend := false
                newtrend := false


plot(SAR, color = color.blue, style = plot.style_cross, linewidth = 2)

if (uptrend)
    strategy.entry("PBSARLE", strategy.long, comment="PBSARLE")
if (newtrend)
    strategy.entry("PBSARSE", strategy.short, comment="PBSARSE")