Estrategia de seguimiento de tendencia con oscilador de doble reversión
Descripción general
La estrategia de seguimiento de tendencias de la banda de oscilación de doble reversión permite realizar operaciones de seguimiento de tendencias mediante la combinación de la señal de doble reversión y el indicador de la banda de oscilación. Utiliza primero el sistema de reversión 123 para generar señales de reversión, y luego se combina con la señal de filtro de las bandas de caos fractales para realizar un seguimiento de tendencias. La estrategia puede identificar oportunidades de reversión y seguir la tendencia, y es una estrategia de negociación muy completa.
Principio de estrategia
123 Sistema de retroalimentación
El sistema de inversión 123 proviene de Ulf Jensen y de la página 183 de su libro Cómo ganar el triple en el mercado de futuros. Su señal de negociación es:
Cuando el precio de cierre es superior al precio de cierre del día anterior durante 2 días consecutivos y la línea Slow K es inferior a 50 en el día 9, haga más; cuando el precio de cierre es inferior al precio de cierre del día anterior durante 2 días consecutivos y la línea Fast K es superior a 50 en el día 9, haga un vacío.
Esta sección utiliza principalmente el indicador de osciladores estocásticos para generar señales en áreas de sobreventa y sobreventa. Se adopta una estrategia de beca cuando las acciones suben continuamente pero el indicador de osciladores estocásticos muestra que todavía hay más espacio para subir; se adopta una estrategia de beca cuando las acciones bajan continuamente pero el indicador de osciladores estocásticos muestra que todavía hay más espacio para bajar.
Indicador de las Bandas de Caos Fractal
El indicador Fractal Chaos Bands determina la tendencia del mercado mediante el trazado de los puntos más altos y más bajos de los precios de las acciones, formando trayectorias superiores y inferiores. Las reglas específicas son:
Haga más cuando el precio suba y rompa la vía; haga menos cuando el precio baje y rompa la vía.
Esta sección se utiliza principalmente como un filtro de tendencia, en combinación con la señal de inversión 123. La posición se abre solo cuando las dos señales coinciden.
Ventajas estratégicas
- Capturar las oportunidades en conjunto con la inversión y la tendencia
La estrategia de seguimiento de tendencias de doble banda de oscilación inversa puede capturar oportunidades de reversión y seguir tendencias, y es muy completa. Se pueden obtener señales de negociación independientemente de si el mercado está en un estado de oscilación o de tendencia.
- Reducir las señales falsas y aumentar la probabilidad de ganar
En comparación con un solo indicador, la estrategia se filtra a través de una combinación de indicadores dobles, lo que reduce considerablemente las señales falsas y aumenta la probabilidad de éxito y la rentabilidad de las operaciones reales.
- Ajuste de parámetros es flexible y adaptable
Los parámetros de la estrategia de seguimiento de tendencias de la banda de oscilación de doble reversión se entienden muy bien, los usuarios pueden ajustarse según sus propias necesidades y el entorno del mercado, y son muy flexibles. Tanto en el mercado de oscilación como en el mercado de tendencias, se puede adaptar a través de los parámetros.
Riesgo y optimización
- No puede adaptarse a las grandes tendencias
La estrategia en sí depende más de las oportunidades de corto y medio plazo. En una gran tendencia, la estrategia puede generar demasiadas señales de reversión y detener la salida. Esto se puede optimizar mediante ajustes de parámetros.
- Necesidad de apoyo financiero marginal
La estrategia de seguimiento de tendencias de doble reversión de la zona de oscilación es un tipo de negociación frecuente que requiere suficiente capital marginal para respaldar la necesidad de una garantía de posición. Para los usuarios con pocos fondos, puede ser necesario reducir la posición adecuadamente.
- Se puede combinar con más indicadores
La estrategia puede enriquecer la fuente de señales y mejorar la estabilidad de la estrategia mediante la introducción de más tipos diferentes de indicadores, sobre la base de los existentes. Por ejemplo, la adición de indicadores de energía cuantitativa, indicadores de fluctuación, etc. para verificar las señales de reversión y tendencia.
Resumir
La estrategia de seguimiento de tendencias de doble reversión de la banda de oscilación de reversión combina con éxito las ventajas de la negociación de reversión y el seguimiento de tendencias, tanto para capturar reversiones como para seguir tendencias, es muy completa y eficiente. En comparación con un solo indicador, puede reducir significativamente las falsas señales y mejorar la tasa de victoria y el nivel de ganancias de las operaciones reales. Además, los parámetros de la estrategia son flexibles y los usuarios pueden optimizarlos según su propio estilo y entorno de mercado.
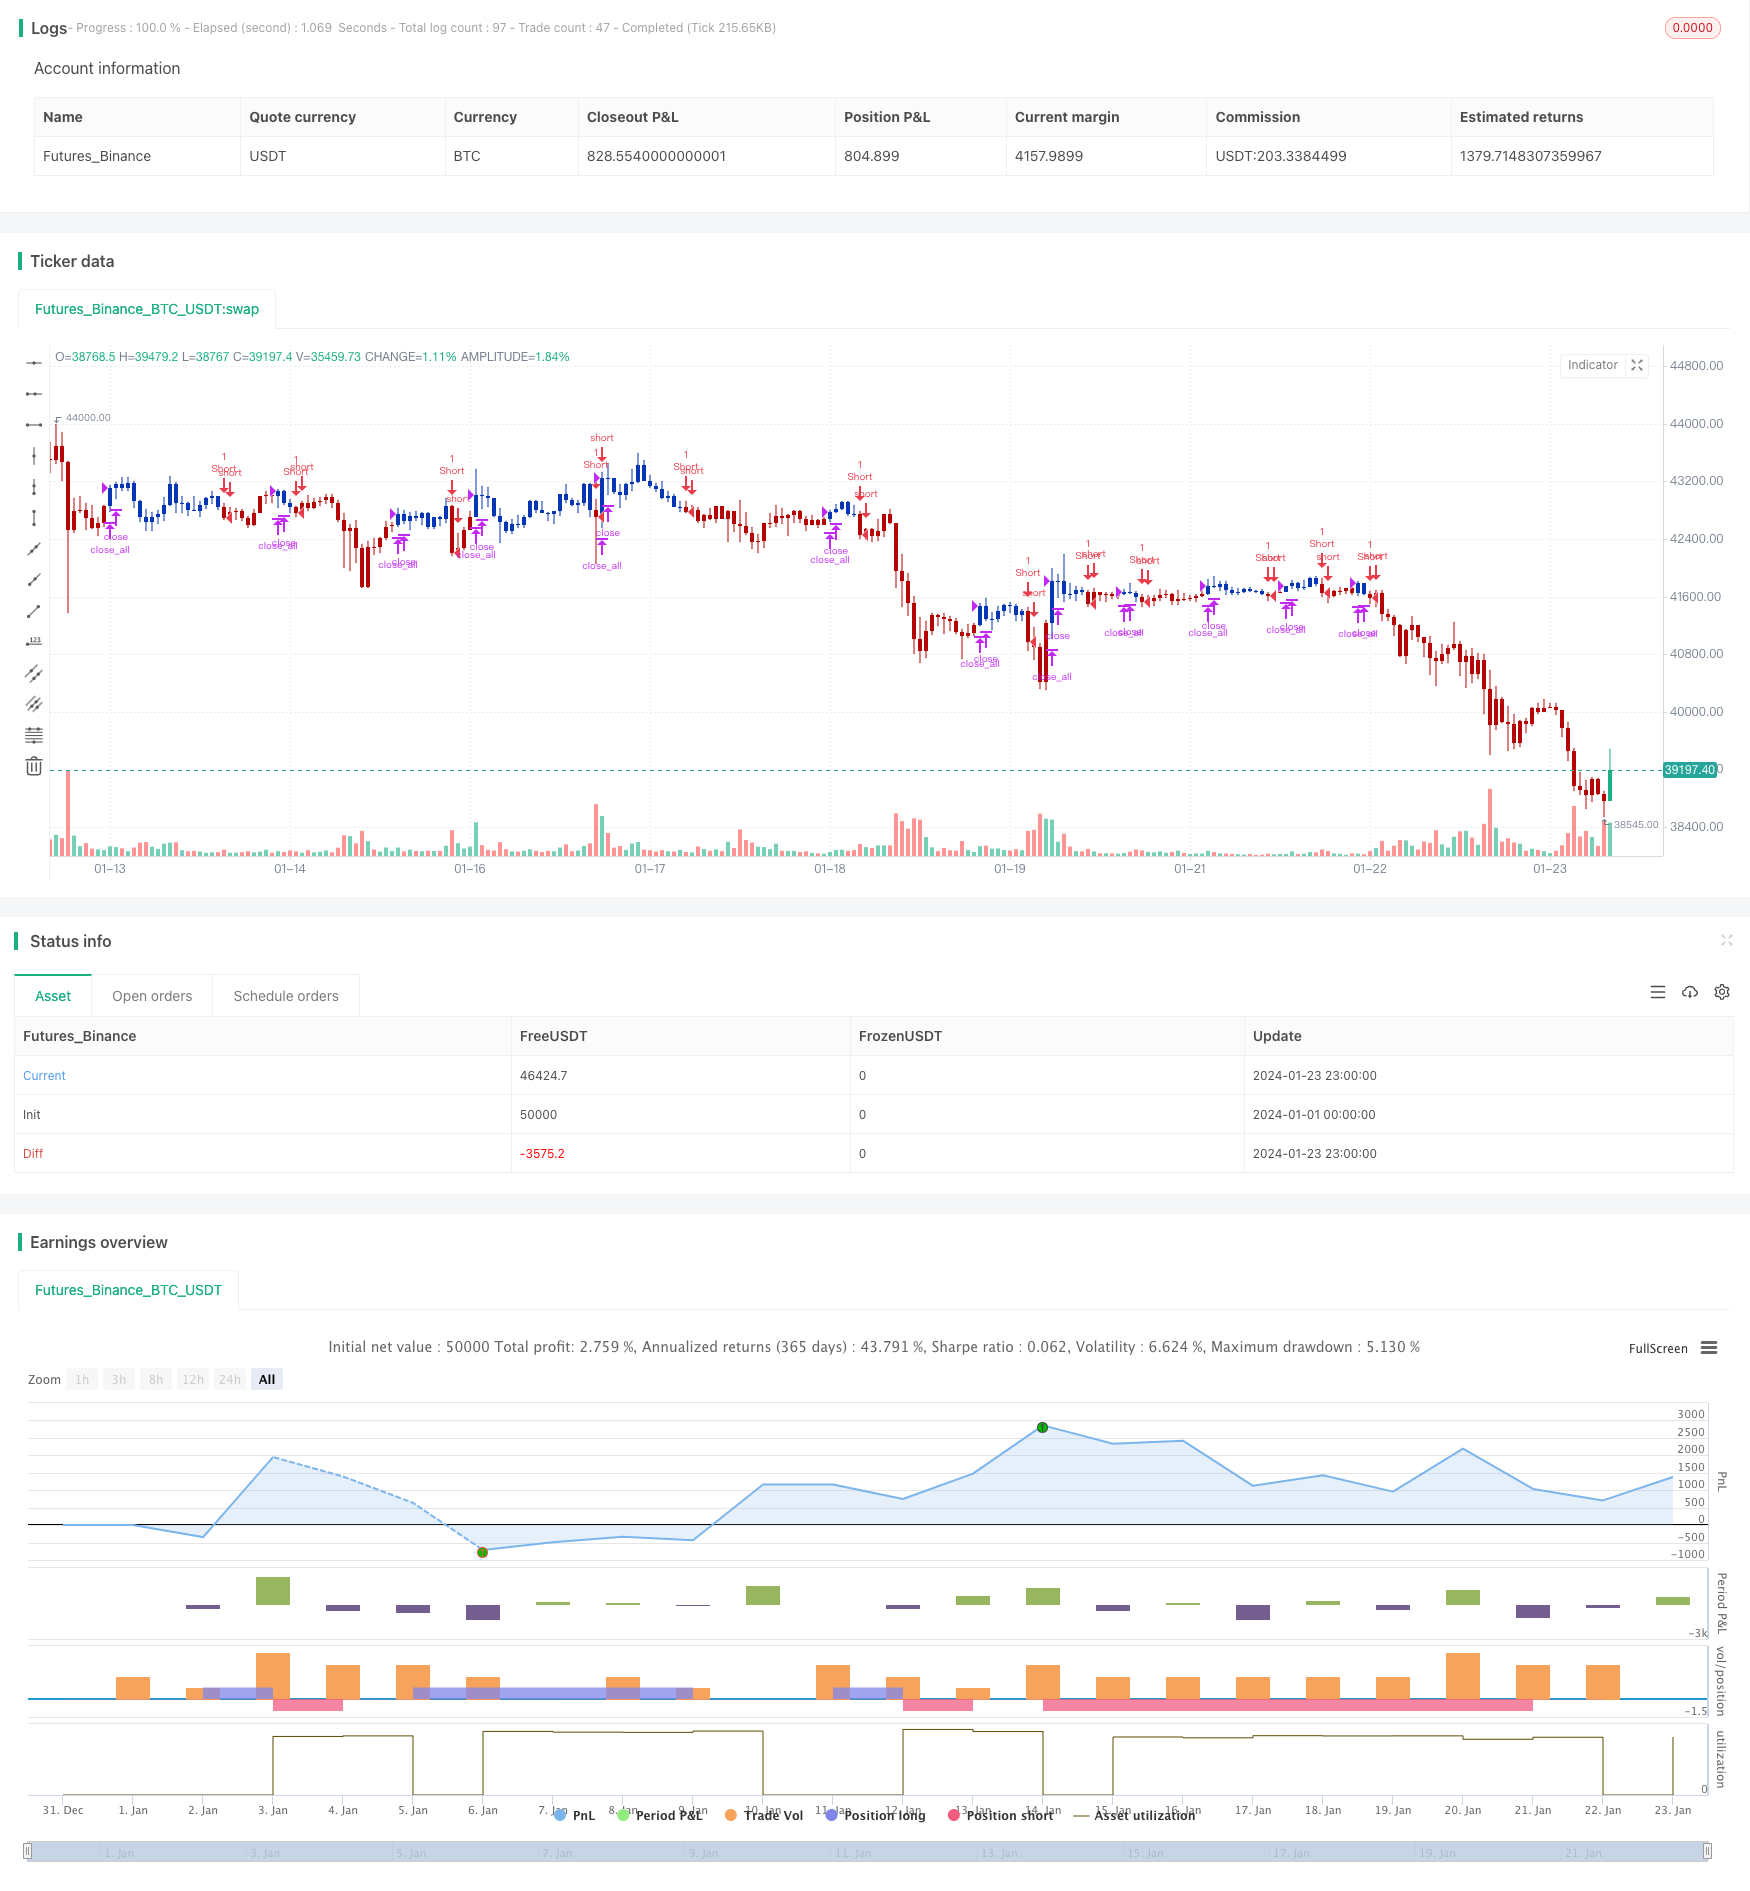
/*backtest
start: 2024-01-01 00:00:00
end: 2024-01-24 00:00:00
period: 1h
basePeriod: 15m
exchanges: [{"eid":"Futures_Binance","currency":"BTC_USDT"}]
*/

//@version=4
////////////////////////////////////////////////////////////
//  Copyright by HPotter v1.0 21/09/2020
// This is combo strategies for get a cumulative signal.
//
// First strategy
// This System was created from the Book "How I Tripled My Money In The
// Futures Market" by Ulf Jensen, Page 183. This is reverse type of strategies.
// The strategy buys at market, if close price is higher than the previous close
// during 2 days and the meaning of 9-days Stochastic Slow Oscillator is lower than 50.
// The strategy sells at market, if close price is lower than the previous close price
// during 2 days and the meaning of 9-days Stochastic Fast Oscillator is higher than 50.
//
// Second strategy
//  Stock market moves in a highly chaotic way, but at a larger scale, the movements
// follow a certain pattern that can be applied to shorter or longer periods of time
// and we can use Fractal Chaos Bands Indicator to identify those patterns. Basically,
// the Fractal Chaos Bands Indicator helps us to identify whether the stock market is
// trending or not. When a market is trending, the bands will have a slope and if market
// is not trending the bands will flatten out. As the slope of the bands decreases, it
// signifies that the market is choppy, insecure and variable. As the graph becomes more
// and more abrupt, be it going up or down, the significance is that the market becomes
// trendy, or stable. Fractal Chaos Bands Indicator is used similarly to other bands-indicator
// (Bollinger bands for instance), offering trading opportunities when price moves above or
// under the fractal lines.
//
// The FCB indicator looks back in time depending on the number of time periods trader selected
// to plot the indicator. The upper fractal line is made by plotting stock price highs and the
// lower fractal line is made by plotting stock price lows. Essentially, the Fractal Chaos Bands
// show an overall panorama of the price movement, as they filter out the insignificant fluctuations
// of the stock price.
//
// WARNING:
// - For purpose educate only
// - This script to change bars colors.
////////////////////////////////////////////////////////////
Reversal123(Length, KSmoothing, DLength, Level) =>
    vFast = sma(stoch(close, high, low, Length), KSmoothing)
    vSlow = sma(vFast, DLength)
    pos = 0.0
    pos := iff(close[2] < close[1] and close > close[1] and vFast < vSlow and vFast > Level, 1,
	         iff(close[2] > close[1] and close < close[1] and vFast > vSlow and vFast < Level, -1, nz(pos[1], 0)))
	pos

fractalUp(pattern) =>
    p = high[pattern+1]
    okl = 1
    okr = 1
    res = 0.0
	for i = pattern to 1
		okl := iff(high[i] < high[i+1] and okl == 1 , 1, 0)
	for i = pattern+2 to pattern*2+1
		okr := iff(high[i] < high[i-1] and okr == 1, 1, 0)
	res := iff(okl == 1 and okr == 1, p, res[1])
    res

fractalDn(pattern) =>
    p = low[pattern+1]
    okl = 1
    okr = 1
    res =0.0
	for i = pattern to 1
		okl := iff(low[i] > low[i+1] and okl == 1 , 1, 0)
	for i = pattern+2 to pattern*2+1
		okr := iff(low[i] > low[i-1] and okr == 1, 1, 0)
	res := iff(okl == 1 and okr == 1, p, res[1])
    res

FCB(Pattern) =>
    pos = 0.0
    xUpper = fractalUp(Pattern)
    xLower = fractalDn(Pattern)
    pos := iff(close > xUpper, 1,
             iff(close < xLower, -1, nz(pos[1], 0)))
    pos

strategy(title="Combo Backtest 123 Reversal & Fractal Chaos Bands", shorttitle="Combo", overlay = true)
Length = input(15, minval=1)
KSmoothing = input(1, minval=1)
DLength = input(3, minval=1)
Level = input(50, minval=1)
//-------------------------
Pattern = input(1, minval=1)
reverse = input(false, title="Trade reverse")
posReversal123 = Reversal123(Length, KSmoothing, DLength, Level)
posFCB = FCB(Pattern)
pos = iff(posReversal123 == 1 and posFCB == 1 , 1,
	   iff(posReversal123 == -1 and posFCB == -1, -1, 0))
possig = iff(reverse and pos == 1, -1,
          iff(reverse and pos == -1 , 1, pos))
if (possig == 1)
    strategy.entry("Long", strategy.long)
if (possig == -1)
    strategy.entry("Short", strategy.short)
if (possig == 0)
    strategy.close_all()
barcolor(possig == -1 ? #b50404: possig == 1 ? #079605 : #0536b3 )