Sistema de seguimiento de tendencias con ajuste dinámico de posición
Descripción general
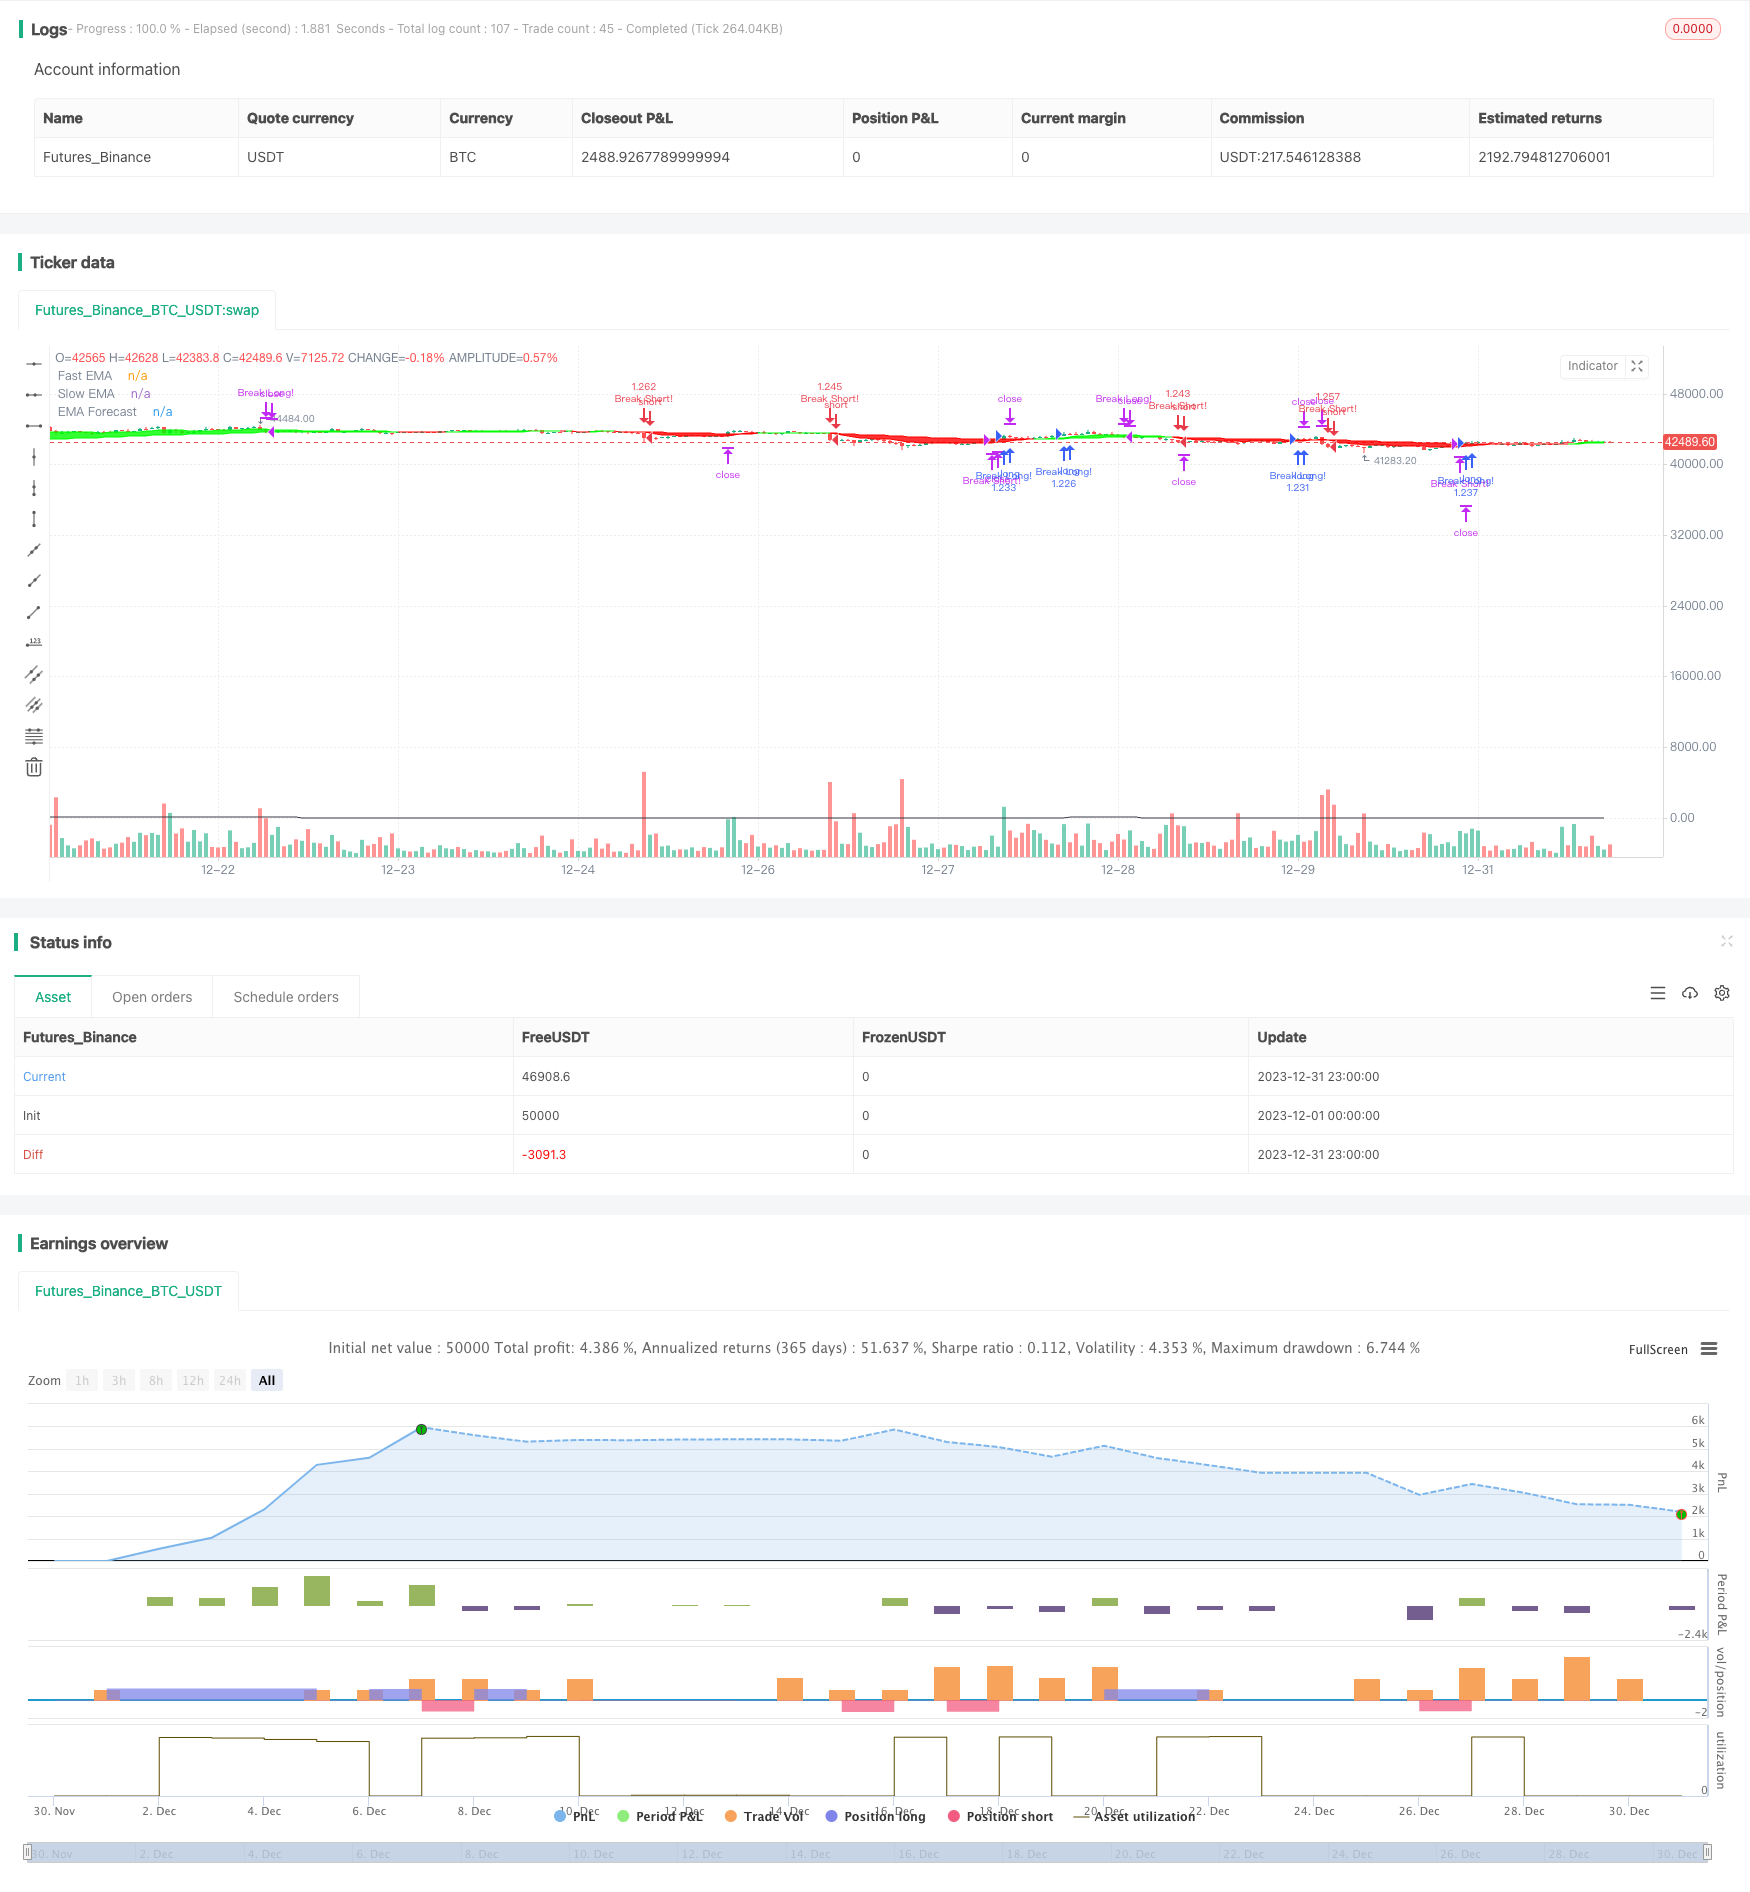
La estrategia utiliza la combinación de dos estrategias de comercio de sistemas populares, el sistema de cruce de medias móviles de índices y el sistema de comercio de turbinas. El sistema se utiliza exclusivamente para el marco de tiempo solar, y sigue las tendencias del mercado en tiempo real mediante el ajuste dinámico de las posiciones.
Principio de estrategia
La estrategia incluye dos estrategias semilla: la estrategia de tendencia y la estrategia de ruptura.
Las estrategias de tendencia utilizan el cruce de EMA rápido y EMA lento como señales de negociación. La longitud del ciclo de EMA rápido se establece por el usuario, y la longitud del ciclo de EMA lento es 5 veces la de EMA rápido. La señal se obtiene dividiendo el diferencial de EMA rápido por el diferencial estándar de la tasa de retorno de 252 ciclos, lo que genera una señal de negociación más confiable después de un ajuste de la tasa de fluctuación.
Las estrategias de ruptura utilizan el promedio de los máximos y mínimos de precios de un período fijo como referencia. Cuando los precios suben o bajan por encima de un determinado margen respecto a la referencia, se produce una señal de venta o ventaja.
El ajuste de la posición se calcula en función de la volatilidad de los precios recientes y los objetivos de riesgo anualizados establecidos por el usuario. Cuando la volatilidad es menor, la posición es mayor, y cuando la volatilidad es mayor, la posición es menor.
El stop loss se establece en base a la amplitud de onda real. El stop loss sigue el movimiento de retracción basado en los precios más altos y más bajos.
Análisis de las ventajas
La estrategia tiene las siguientes ventajas:
Combinando el seguimiento de tendencias y las dos estrategias secundarias de ruptura, se puede realizar un cambio adaptativo en diferentes entornos de mercado, con una mayor robustez.
La aplicación de técnicas avanzadas de gestión de posiciones y control de riesgos permite ajustar dinámicamente las posiciones y controlar eficazmente el riesgo.
El uso de la volatilidad real y los objetivos de riesgo anualizados para ajustar las posiciones permite obtener un nivel de riesgo combinado relativamente estable en mercados de alta y baja volatilidad.
Establecer un punto de parada basado en la fluctuación real de los precios puede evitar de manera efectiva las pequeñas pérdidas innecesarias causadas por el punto de parada.
Ajuste en tiempo real de la posición de seguimiento de las pérdidas, permite la flexibilidad de seguir la tendencia de ganancias y la salida de las pérdidas en el momento oportuno.
Análisis de riesgos
Los principales riesgos de esta estrategia son:
Dependiendo de la optimización de parámetros, los diferentes parámetros tienen un gran impacto en el rendimiento de la estrategia, y se necesita una prueba completa para obtener los mejores parámetros.
El seguimiento del stop loss puede ser demasiado frecuente en la tendencia de la oscilación. Se puede relajar adecuadamente la amplitud del stop loss y optimizar el mecanismo de stop loss.
La gestión de posiciones y las técnicas de control de riesgo son sensibles al capital inicial y los costos de transacción. El capital inicial demasiado pequeño y los costos de transacción demasiado altos afectan la rentabilidad de la estrategia.
La estrategia para la fijación de objetivos de riesgo anualizados y el máximo nivel de apalancamiento depende de la volatilidad de los indicadores correctamente evaluados. La evaluación inexacta de la volatilidad puede causar posiciones demasiado grandes o demasiado pequeñas.
Dirección de optimización
Las principales direcciones de optimización de la estrategia incluyen:
Buscar la combinación óptima de parámetros. Se puede encontrar la configuración óptima de los parámetros retrospectivamente con más datos históricos.
Mejora de los mecanismos de detención de pérdidas. Se pueden probar formas de detención como detención móvil, detención temporal, detención de sacudidas, optimización de las estrategias de detención de pérdidas.
Optimización de posiciones y gestión de riesgos. Se pueden probar diferentes objetivos de riesgo para encontrar la mejor combinación de riesgos y beneficios. También se pueden probar los efectos de diferentes niveles de apalancamiento.
Prueba otros indicadores auxiliares. Se pueden agregar más indicadores técnicos para mejorar la precisión de la señal y la solidez de la estrategia.
Prueba diferentes períodos de tenencia. Puede intentar usar decisiones auxiliares de períodos más altos para mejorar la precisión de la configuración de la posición.
Resumir
La estrategia integra el seguimiento de la tendencia y la tendencia de romper las dos principales categorías de estrategias de negociación, la aplicación de la tecnología de gestión de posiciones dinámicas avanzadas, la realización de la configuración de la posición después de ajustar el riesgo, puede controlar eficazmente el riesgo al mismo tiempo que el seguimiento de la evolución del mercado, la capacidad de obtener ganancias es fuerte, vale la pena realizar más pruebas y optimización.
/*backtest
start: 2023-12-01 00:00:00
end: 2023-12-31 23:59:59
period: 1h
basePeriod: 15m
exchanges: [{"eid":"Futures_Binance","currency":"BTC_USDT"}]
*/

// This source code is subject to the terms of the Mozilla Public License 2.0 at https://mozilla.org/MPL/2.0/
// © Crunchster1

//@version=5
strategy(title="Crunchster's Turtle and Trend System", shorttitle="Turtle Trend", overlay=true, slippage=10, pyramiding=1, precision = 4, calc_on_order_fills = false, calc_on_every_tick = false, default_qty_value = 0.1, initial_capital = 1000, commission_value = 0.06, process_orders_on_close = true)

// Inputs and Parameters
src = input(close, 'Source', group='Strategy Settings')
length = input.int(title="Lookback period for fast EMA", defval=10, minval=2, group='Strategy Settings', tooltip='This sets the lookback period for the fast exponential moving average. The slow EMA is 5x the fast EMA length')
blength = input.int(title="Lookback period for Breakout", defval=20, minval=5, step=5, group='Strategy Settings')

long = input(true, 'Long', inline='08', group='Strategy toggle')
short = input(true, 'Short', inline='08', group='Strategy toggle', tooltip='Toggle long/short strategy on/off')

EMAwt = input(false, 'Trend', inline='01', group='Strategy toggle')
breakwt = input(true, 'Breakout', inline='01', group='Strategy toggle', tooltip='Toggle trend/breakout strategy on/off')

stopMultiple = input.float(2, 'Stop multiple', step=0.5, group='Risk Management Settings', tooltip='Multiple for ATR, setting hard stop loss from entry price')
trail = input.int(10, 'Trail lookback', step=5, group='Risk Management Settings', tooltip='Lookback period for the trailing stop')
lev = input.float(1, 'Max Leverage', step=0.5, group='Risk Management Settings', tooltip='Max leverage sets maximum allowable leverage of total capital (initial capital + any net profit), capping maximum volatility adjusted position size')
riskT = input.float(15, maxval=75, title='Annualised Volatility Target %', group='Risk Management Settings', tooltip='Specify annual risk target, used to determine volatility adjusted position size. Annualised daily volatility is referenced to this value and position size adjusted accordingly')
comp = input(true, 'Compounding', inline='09', group='Risk Management Settings')
Comppct = input.float(50, '%', step=5, inline='09', group='Risk Management Settings', tooltip='Toggle compounding of profit, and set % of profit to compound')

// Backtesting period
FromDay = input.int(defval=1, title='From Day', minval=1, maxval=31, inline='04', group='Backtest range')
FromMonth = input.int(defval=1, title='From Mon', minval=1, maxval=12, inline='04', group='Backtest range')
FromYear = input.int(defval=2018, title='From Yr', minval=1900, inline='04', group='Backtest range', tooltip='Set start of backtesting period')
ToDay = input.int(defval=1, title='To Day', minval=1, maxval=31, inline='05', group='Backtest range')
ToMonth = input.int(defval=1, title='To Mon', minval=1, maxval=12, inline='05', group='Backtest range')
ToYear = input.int(defval=9999, title='To Yr', minval=1900, inline='05', group='Backtest range', tooltip='Set end of backtesting period')

start = timestamp(FromYear, FromMonth, FromDay, 00, 00)
finish = timestamp(ToYear, ToMonth, ToDay, 23, 59)
window = time >= start and time <= finish

// Breakout strategy
lower = ta.lowest(low[1], blength)
upper = ta.highest(high[1], blength)
basis = math.avg(upper, lower)
signal = 20*(close - basis) / (upper - lower)

// Trend strategy
fEMA = ta.ema(close[1], length)
sEMA = ta.ema(close[1], length*5)
emadiff = fEMA - sEMA
nemadiff = 5*emadiff/(ta.stdev(close - close[1], 252))

//Risk Management formulae
strategy.initial_capital = 50000
tr = math.max(high - low, math.abs(high - close), math.abs(low - close)) //True range
stopL = ta.sma(tr, 14) //Average true range
stdev = ta.stdev(close-close[1], 14) //volatility of recent returns
maxcapital = strategy.initial_capital+strategy.netprofit //Maximum capital available to invest - initial capital net of profit
annvol = 100*math.sqrt(365)*stdev/close //converts recent volatility of returns into annualised volatility of returns - assumes daily timeframe

risk = 1.1
if comp
    risk := (strategy.initial_capital+(Comppct*strategy.netprofit/100))//adjust investment capital to include compounding
else
    risk := strategy.initial_capital

shares = (risk * (riskT/annvol)) / close //calculates volatility adjusted position size, dependent on user specified annualised risk target
if ((shares*close) > lev*maxcapital) //ensures position size does not exceed available capital multiplied by user specified maximum leverage
    shares := lev*maxcapital/close

//To set the price at the entry point of trade
Posopen() =>
    math.abs(strategy.position_size[1]) <= 0 and math.abs(strategy.position_size) > 0

var float openN = na
if Posopen()
    openN := stopL

// Trailing stop
tlower = ta.lowest(low[1], trail)
tupper = ta.highest(high[1], trail)
tbasis = math.avg(tupper, tlower)
tsignal = 20*(close - tbasis) / (tupper - tlower)

// Strategy Rules
if EMAwt
    if long
        longCondition2 = (nemadiff >2 and nemadiff[1] <2) and window
        exitlong = tsignal <= -10
        if (longCondition2)
            strategy.entry('Trend Long!', strategy.long, qty=shares)
        if strategy.position_size > 0
            strategy.exit('Stop Long', from_entry = 'Trend Long!', stop=(strategy.opentrades.entry_price(0) - (openN * stopMultiple)))
        if (exitlong)
            strategy.close('Trend Long!', immediately = true)

    if short
        shortCondition2 = (nemadiff <-1 and nemadiff[1] >-1) and window
        exitshort = tsignal >= 10
        if (shortCondition2)
            strategy.entry('Trend Short!', strategy.short, qty=shares)
        if strategy.position_size < 0
            strategy.exit('Stop Short', from_entry = 'Trend Short!', stop=(strategy.opentrades.entry_price(0) + (openN * stopMultiple)))
        if (exitshort)
            strategy.close('Trend Short!', immediately = true)

if breakwt
    if long
        longCondition1 = (signal >= 10) and window
        exitlong = tsignal <= -10
        if (longCondition1)
            strategy.entry('Break Long!', strategy.long, qty=shares)
        if strategy.position_size > 0
            strategy.exit('Stop Long', from_entry = 'Break Long!', stop=(strategy.opentrades.entry_price(0) - (openN * stopMultiple)))
        if (exitlong)
            strategy.close('Break Long!', immediately = true)

    if short
        shortCondition1 = (signal <= -10) and window
        exitshort = tsignal >= 10
        if (shortCondition1)
            strategy.entry('Break Short!', strategy.short, qty=shares)
        if strategy.position_size < 0
            strategy.exit('Stop Short', from_entry = 'Break Short!', stop=(strategy.opentrades.entry_price(0) + (openN * stopMultiple)))
        if (exitshort)
            strategy.close('Break Short!', immediately = true)

// Visuals of trend and direction
plot(nemadiff, title='EMA Forecast', color=color.black, display=display.none)
plot(ta.sma(ta.median(math.sqrt(math.pow(nemadiff,2)), 700), 350), 'Forecast mean', color=color.rgb(245, 0, 0), display=display.none)

MAColor = fEMA > sEMA ? #00ff00 : #ff0000
MA1 = plot(fEMA, title='Fast EMA', color=MAColor)
MA2 = plot(sEMA, title='Slow EMA', color=MAColor)
fill(MA1, MA2, title='Band Filler', color=MAColor)