Una estrategia comercial cuantitativa que utiliza múltiples indicadores técnicos
Descripción general
La estrategia es una estrategia que utiliza una variedad de indicadores técnicos para realizar operaciones cuantitativas. Se utiliza principalmente el cruce de líneas medias de la EMA, el indicador SuperTrend, el indicador RSI y el indicador MACD para formar una señal de negociación.
Principio de estrategia
La lógica de transacción central de la estrategia se basa en los siguientes aspectos:
EMA mediano cruzado: calcula la línea rápida EMA1 y la línea lenta EMA2, generando una señal de compra cuando la línea rápida atraviesa la línea lenta y una señal de venta cuando la línea rápida atraviesa la línea lenta.
Línea media VWMA: Calcula la línea media VWMA, que se considera una señal de compra cuando se cruza la línea media en el precio de cierre y una señal de venta cuando se cruza la línea media.
Indicador de SuperTrend: Calcula los altibajos de SuperTrend en función de los parámetros ATR y multiplicador, y determina la dirección de la tendencia. Genera una señal de compra en una tendencia alcista y una señal de venta en una tendencia bajista.
Indicador RSI: Calcula el indicador RSI, el RSI se considera una señal de venta cuando está por encima de la línea de compra y una señal de compra cuando está por debajo de la zona de venta.
Indicador MACD: Calcula la línea rápida, lenta y de señal del MACD, que produce una señal de compra cuando la línea rápida atraviesa la línea de señal, y una señal de venta cuando la línea rápida atraviesa la línea de señal.
Después de obtener las señales de comercio de los indicadores múltiples mencionados anteriormente, la estrategia utiliza la lógica de AND y AND para juzgar, es decir, la generación de señales finales de compra y venta se produce cuando varios indicadores emiten señales al mismo tiempo.
Ventajas estratégicas
La estrategia integra varios indicadores para juzgar el mercado y puede reducir de manera efectiva las falsas señales. Las principales ventajas incluyen:
El uso de múltiples indicadores para el filtro de composición puede reducir la señal errónea causada por un solo indicador.
La combinación de un indicador de tendencia y un indicador de conmoción puede generar ganancias adicionales en situaciones de tendencia.
El uso de una lógica de stop loss perfectamente desarrollada permite un control efectivo de las pérdidas máximas de una sola operación.
La lógica del doble juego permite que se recupere la oportunidad al aumentar la posición después de la pérdida.
Riesgo estratégico
El principal riesgo de esta estrategia es:
Las carteras de múltiples indicadores pueden ser demasiado conservadoras y perderse algunas oportunidades de negociación. Se puede simplificar la cartera de indicadores adecuadamente.
La lógica de la multiplicación de la apuesta puede causar pérdidas ampliadas. Se debe establecer un límite razonable de la cantidad de veces que se aumenta la apuesta.
El ajuste incorrecto de la posición de frenado puede causar un frenado innecesario. Se debe personalizar la posición de frenado adaptativa.
La configuración incorrecta de los parámetros del indicador puede generar demasiadas señales erróneas. Se debe optimizar los parámetros para obtener la mejor combinación de parámetros.
Dirección de optimización de la estrategia
La estrategia puede ser optimizada en los siguientes aspectos:
Evaluar el efecto de los diferentes parámetros de la combinación de indicadores, seleccionar el peso de los indicadores.
Prueba de diferentes configuraciones de los parámetros del indicador.
Agrega una lógica de parada de pérdidas adaptativa.
Unirse al mecanismo de gestión de posiciones dinámicas.
Utiliza métodos de aprendizaje automático para optimizar los parámetros y los modelos.
Resumir
La estrategia general es una estrategia de comercio cuantitativa muy práctica. Combina las ventajas de varios indicadores técnicos clásicos para realizar juicios de mercado efectivos. A través de la optimización de parámetros y la repetición de modelos, la estrategia puede obtener mejores resultados comerciales.
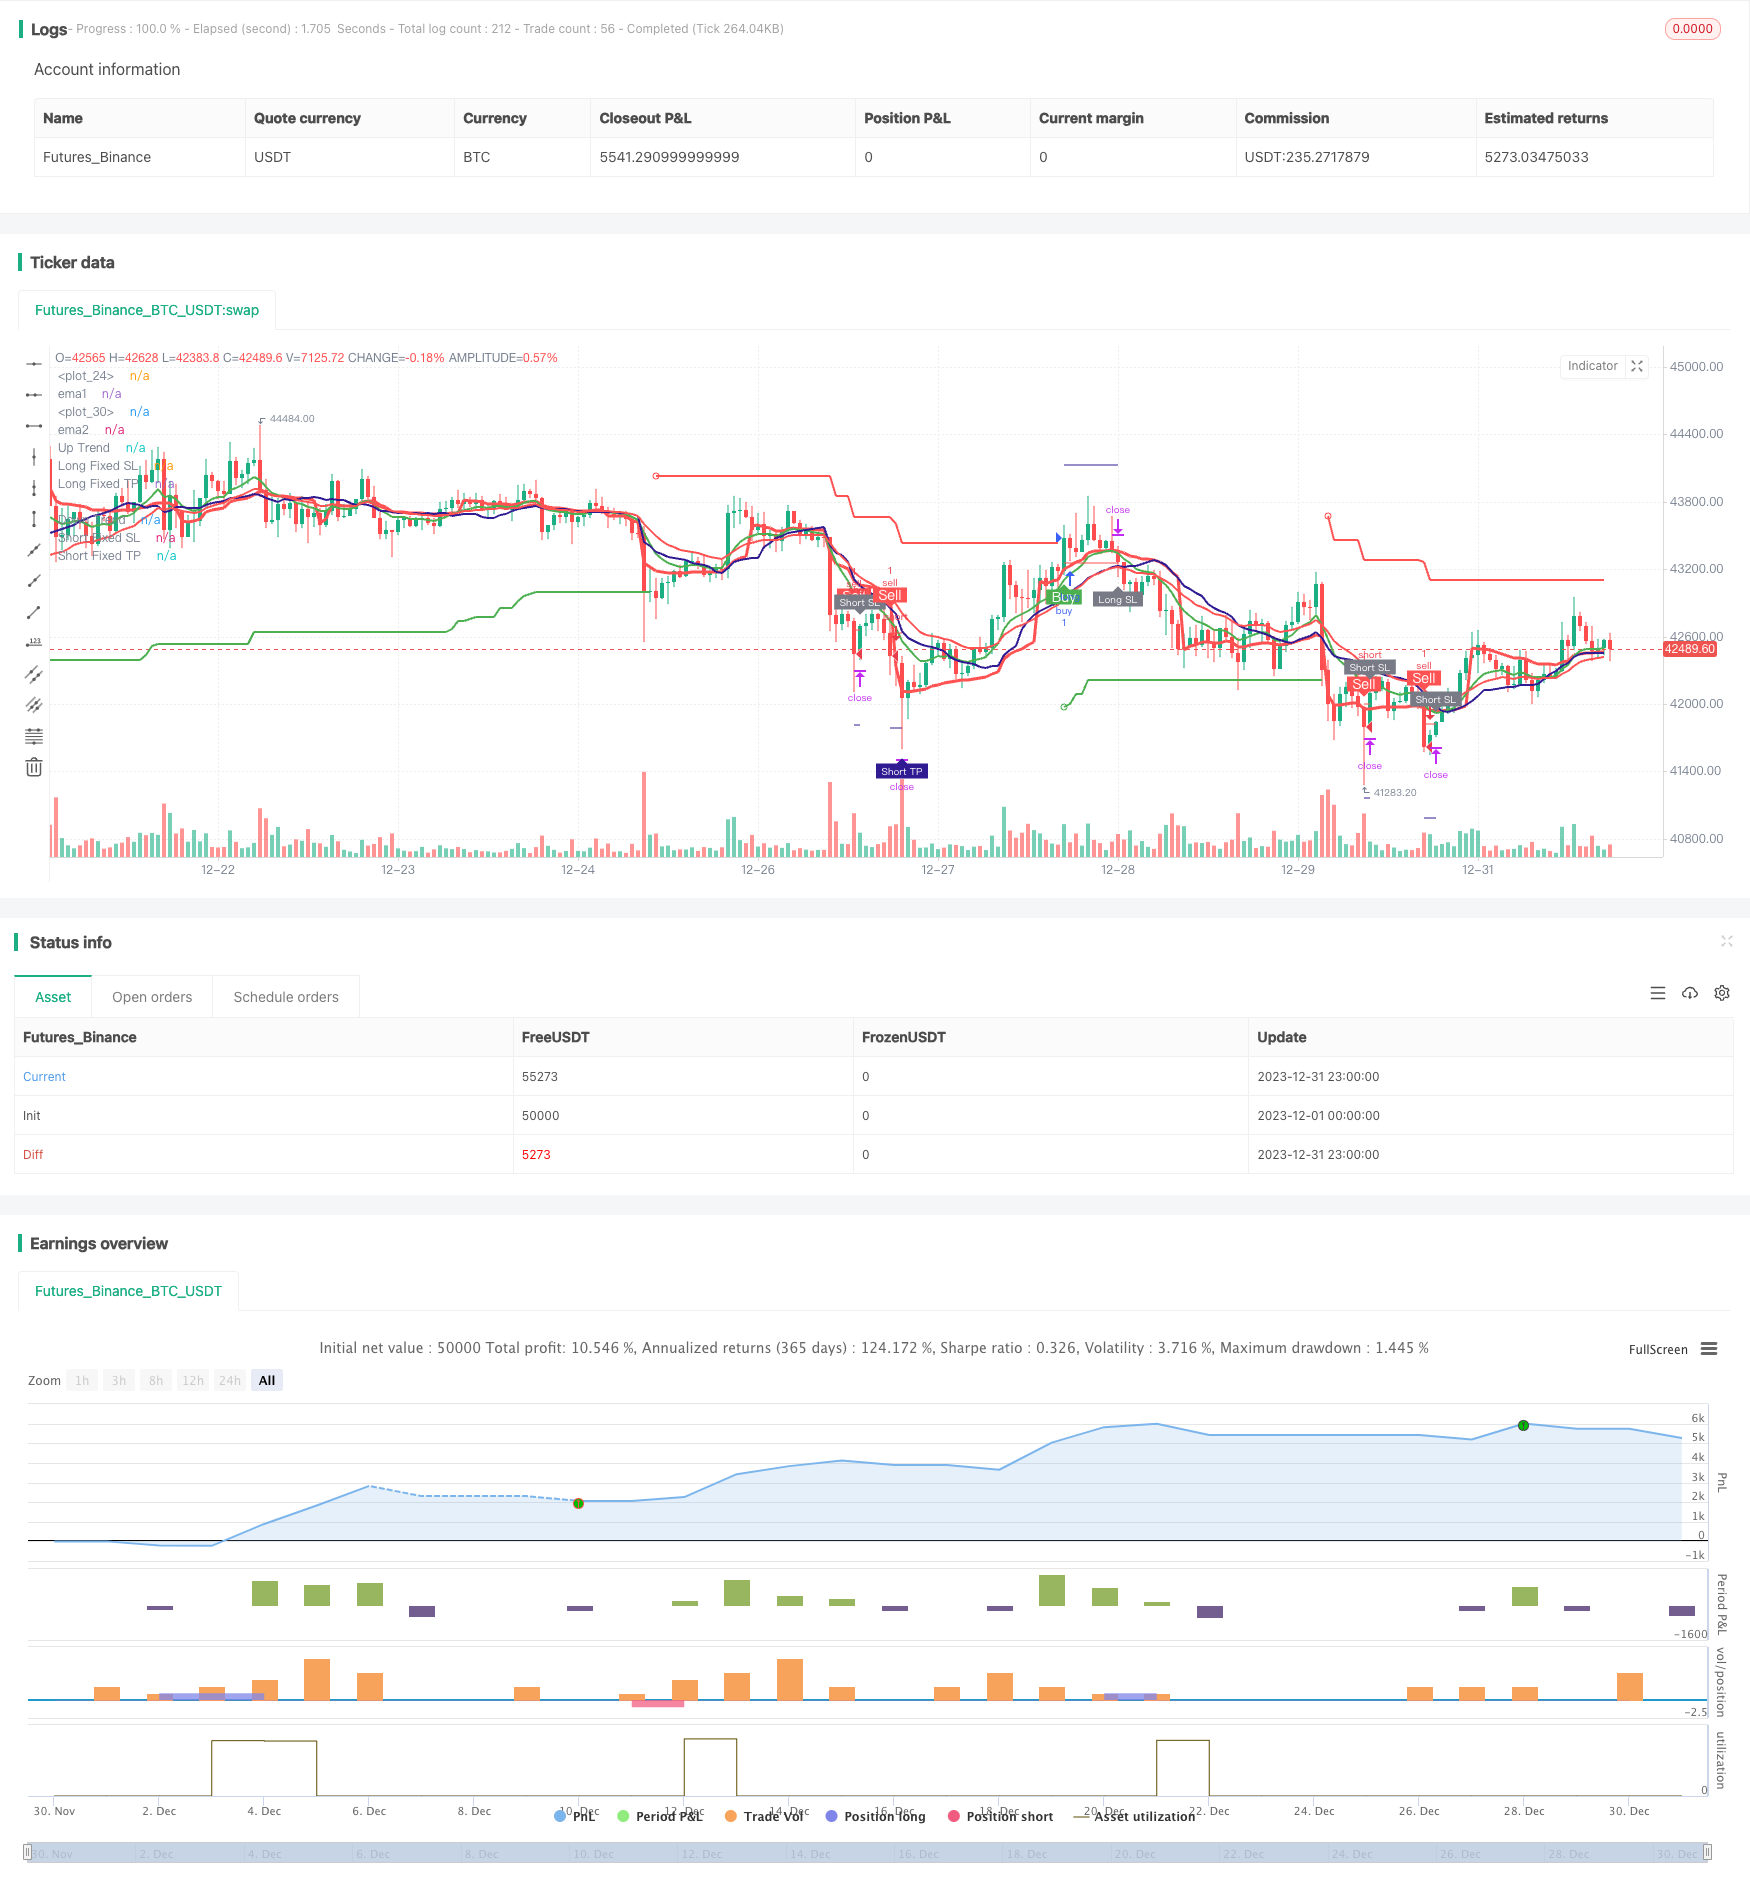
/*backtest
start: 2023-12-01 00:00:00
end: 2023-12-31 23:59:59
period: 1h
basePeriod: 15m
exchanges: [{"eid":"Futures_Binance","currency":"BTC_USDT"}]
*/


//@version=5
strategy(title='Pinku Buy', overlay=true)

fromMonth = input.int(defval=1, title='From Month', minval=1, maxval=12)
fromDay = input.int(defval=1, title='From Day', minval=1, maxval=31)
fromYear = input.int(defval=2021, title='From Year', minval=1970)
thruMonth = input.int(defval=1, title='Thru Month', minval=1, maxval=12)
thruDay = input.int(defval=1, title='Thru Day', minval=1, maxval=31)
thruYear = input.int(defval=2112, title='Thru Year', minval=1970)

showDate = input(defval=true, title='Show Date Range')

start = timestamp(fromYear, fromMonth, fromDay, 00, 00)
finish = timestamp(thruYear, thruMonth, thruDay, 23, 59)
window() => true
// ema crossover
length1 = input.int(10)
length2 = input.int(20)
ema1 = ta.ema(close , length1)
ema2 = ta.ema(close , length2)
//vwap
VWAP = ta.vwap(hlc3)
plot(VWAP, color=color.new(color.red, 0), linewidth=3)
buy_1 = close > VWAP
sell_1 = close < VWAP
//vwma
len = input.int(20, 'VWMA_len', minval=1)
ma = ta.vwma(close, len)
plot(ma, color=color.new(color.navy, 0), linewidth=2)
buy_2 = close > ma
sell_2 = close < ma
//super trend
//inputs
Periods = input(title='STR Period', defval=22)
Source = input(hl2, title='Source')
Multiplier = input.float(title='STR Multiplier', step=0.1, defval=5.0)


//Compute ATR Levels
atr = ta.atr(Periods)


//Creating Upper Channel

up = Source - Multiplier * atr
up1 = nz(up[1], up)
up := close[1] > up1 ? math.max(up, up1) : up

//Creating Down Channel
dn = Source + Multiplier * atr
dn1 = nz(dn[1], dn)
dn := close[1] < dn1 ? math.min(dn, dn1) : dn


//Compute the Trend Stream +1/-1
trend = 1
trend := nz(trend[1], trend)
trend := trend == -1 and close > dn1 ? 1 : trend == 1 and close < up1 ? -1 : trend

//Create Stoploss for Longs
upPlot = plot(trend == 1 ? up : na, title='Up Trend', style=plot.style_linebr, linewidth=2, color=color.new(color.green, 0))
//buy_a = close > upPlot
//Buy Signal
buy_3 = trend == 1 and trend[1] == -1

plotshape(buy_3 ? up : na, title='Go Long', location=location.absolute, style=shape.circle, size=size.tiny, color=color.new(color.green, 0))

dnPlot = plot(trend == 1 ? na : dn, title='Down Trend', style=plot.style_linebr, linewidth=2, color=color.new(color.red, 0))
//sell_a = close < dnPlot
//Sell Signal
sell_3 = trend == -1 and trend[1] == 1

plotshape(sell_3 ? dn : na, title='Go Short', location=location.absolute, style=shape.circle, size=size.tiny, color=color.new(color.red, 0))
// //paraboloic sar
// start = input(0.02)
// increment = input(0.02)
// maximum = input(0.2, 'Max Value')
// out = ta.sar(start, increment, maximum)


buy_4 = ema1 > ema2
//buy_4 = buy1 and not buy1[1]
//plotshape(buy_4 , color = color.green , text = "Buy" , location = location.belowbar , textcolor = color.white , style = shape.labelup , size = size.small)
sell_4 = close < ema2
//sell_4 = sell1 and not sell1[1]
//plotshape(sell_4, color = color.red , text = "Sell" , location = location.abovebar , textcolor = color.white , style = shape.labeldown , size = size.small)
plot(ema1, 'ema1', color=color.new(color.green, 0), linewidth=2)
plot(ema2, 'ema2', color=color.new(color.red, 0), linewidth=2)

// rsi
lenr = input(14, title='Rsi Period')
rs = ta.rsi(close, lenr)

over_sold = input(44)
over_bought = input(56)

buy_5 = rs > over_bought
sell_5 = rs < over_sold
// macd
slow_len_macd = input.int(12)
fast_len_macd = input.int(26)
signal_len_macd = input.int(9)

ema3 = ta.ema(close , slow_len_macd)
ema4 = ta.ema(close , fast_len_macd)
ema5 = ta.ema(close , signal_len_macd)

buy_6 = ema5 > ema4
sell_6 = ema5 < ema4

// adx
adxlen = input(14, title="ADX Smoothing")
dilen = input(14, title="DI Length")
dirmov(len) =>
	up = ta.change(high)
	down = -ta.change(low)
	plusDM = na(up) ? na : (up > down and up > 0 ? up : 0)
	minusDM = na(down) ? na : (down > up and down > 0 ? down : 0)
	truerange = ta.rma(ta.tr, len)
	plus = fixnan(100 * ta.rma(plusDM, len) / truerange)
	minus = fixnan(100 * ta.rma(minusDM, len) / truerange)
	[plus, minus]
adx(dilen, adxlen) =>
	[plus, minus] = dirmov(dilen)
	sum = plus + minus
	adx = 100 * ta.rma(math.abs(plus - minus) / (sum == 0 ? 1 : sum), adxlen)
sig = adx(dilen, adxlen)
//plot(sig, color=color.red, title="ADX")
adx_Greater_than = input.int(25)

signal = sig > adx_Greater_than
// volume ema
volume_ema = input.int(10)

vema = ta.ema(volume,volume_ema)

signal_2 = volume > vema


//define buy sell
g = buy_1 and buy_2 and buy_4 and trend == 1 and buy_5 and buy_6 and signal and signal_2 and window()
r = sell_1 and sell_2 and sell_4 and trend == -1 and sell_5 and sell_6 and signal and signal_2 and window()

rg = 0
rg := r ? 1 : g ? 2 : nz(rg[1])

buy11 = 0
buy11 := r ? 0 : g ? 1 : nz(buy11[1])
sell11 = 0
sell11 := r ? 1 : g ? 0 : nz(sell11[1])

buy = buy11 and not buy11[1]
sell = sell11 and not sell11[1]
multiple_signals = input(true)

if multiple_signals
    buy := g and not g[1] and  window()
    sell := r and not r[1] and  window()
    sell
else
    buy := buy and window()
    sell := sell and window()
    sell


//plotshape(long  , color = color.green , text = "Buy" , location = location.belowbar , textcolor = color.white , style = shape.labelup , size = size.small)
//plotshape(short   , color = color.red , text = "Sell" , location = location.abovebar , textcolor = color.white , style = shape.labeldown , size = size.small)
Stop = input(0.5, title='StopLoss') / 100

ProfitPerc = input(defval=1.5, title='Profit') / 100

rev = input(1024,title = "Reverse Limit")

Averaging_position_ = input(true , title = "Averaging position ? ")

qn = 1
qn := nz(qn[1])


long_short = 0
long_last = buy and (nz(long_short[1]) == 0 or nz(long_short[1]) == -1)
short_last = sell and (nz(long_short[1]) == 0 or nz(long_short[1]) == 1)
long_short := long_last ? 1 : short_last ? -1 : long_short[1]

long_entered = false
long_entered := long_entered[1]

short_entered = false
short_entered := short_entered[1]


longPrice = ta.valuewhen(long_last, close, 0)
shortPrice = ta.valuewhen(short_last, close, 0)


longStop = longPrice * (1 - Stop)
shortStop = shortPrice * (1 + Stop)
longTake = longPrice * (1 + ProfitPerc)
shortTake = shortPrice * (1 - ProfitPerc)
plot(long_short == 1 ? longStop : na, style=plot.style_linebr, color=color.new(color.red, 0), linewidth=1, title='Long Fixed SL')
plot(long_short == -1 ? shortStop : na, style=plot.style_linebr, color=color.new(color.red, 0), linewidth=1, title='Short Fixed SL')
plot(long_short == 1 ? longTake : na, style=plot.style_linebr, color=color.new(color.navy, 0), linewidth=1, title='Long Fixed TP')


plot(long_short == -1 ? shortTake : na, style=plot.style_linebr, color=color.new(color.navy, 0), linewidth=1, title='Short Fixed TP')


longBar1 = ta.barssince(long_last)
longBar2 = longBar1 >= 1 ? true : false
shortBar1 = ta.barssince(short_last)
shortBar2 = shortBar1 >= 1 ? true : false

longSLhit = long_short == 1 and longBar2 and low < longStop

if long_entered and sell
    longSLhit := true
    longSLhit

plotshape(longSLhit and not(sell and not short_entered and long_entered), style=shape.labelup, location=location.belowbar, color=color.new(color.gray, 0), size=size.tiny, title='Stop Loss', text='Long SL', textcolor=color.new(color.white, 0))
shortSLhit = long_short == -1 and shortBar2 and high > shortStop


if short_entered and buy
    shortSLhit := true
    shortSLhit

plotshape(shortSLhit and not(buy and not long_entered and short_entered), style=shape.labeldown, location=location.abovebar, color=color.new(color.gray, 0), size=size.tiny, title='Stop Loss', text='Short SL', textcolor=color.new(color.white, 0))


longTPhit = long_short == 1 and longBar2 and high > longTake
plotshape(longTPhit, style=shape.labeldown, location=location.abovebar, color=color.new(color.navy, 0), size=size.tiny, title='Target', text='Long TP', textcolor=color.new(color.white, 0))
shortTPhit = long_short == -1 and shortBar2 and low < shortTake
plotshape(shortTPhit, style=shape.labelup, location=location.belowbar, color=color.new(color.navy, 0), size=size.tiny, title='Target', text='Short TP', textcolor=color.new(color.white, 0))

long_short := (long_short == 1 or long_short == 0) and longBar2 and (longSLhit or longTPhit) ? 0 : (long_short == -1 or long_short == 0) and shortBar2 and (shortSLhit or shortTPhit) ? 0 : long_short

if(shortSLhit or longSLhit or (long_entered[1] and sell) or (short_entered[1] and buy ))
    qn := qn*2

if(longTPhit or shortTPhit or qn > rev)
    qn := 1

if Averaging_position_
    qn := 1

plotshape(buy and not long_entered, color=color.new(color.green, 0), style=shape.labelup, text='Buy', textcolor=color.new(color.white, 0), location=location.belowbar)
plotshape(sell and not short_entered, color=color.new(color.red, 0), style=shape.labeldown, text='Sell', textcolor=color.new(color.white, 0), location=location.abovebar)


// plotshape(buy and not(long_entered) and (short_entered), color = color.green , style = shape.labelup , text = "FA Buy" , textcolor = color.white , location = location.belowbar)
// plotshape(sell and not(short_entered)  and (long_entered), color = color.red , style = shape.labeldown , text = "FA Sell" , textcolor = color.white , location = location.abovebar)


// alertcondition(condition=buy and  not(long_entered)  and (short_entered), title="Fully Algo Buy")
// alertcondition(condition=sell and  not(short_entered)  and (long_entered), title="Fully Algo sell")

alertcondition(condition=buy and not long_entered, title='Buy')
alertcondition(condition=sell and not short_entered, title='Sell')

if long_last
    long_entered := true
    short_entered := false
    short_entered
if short_last
    short_entered := true
    long_entered := false
    long_entered

alertcondition(condition=longSLhit and not(sell and not short_entered and long_entered), title='Long SL')
alertcondition(condition=shortSLhit and not(buy and not long_entered and short_entered), title='Short SL')

alertcondition(condition=longTPhit, title='Long TP')
alertcondition(condition=shortTPhit, title='Short TP')

if longSLhit or longTPhit
    long_entered := false
    long_entered

if shortSLhit or shortTPhit
    short_entered := false
    short_entered

// if buy
//     strategy.entry('buy', strategy.long)
//     strategy.exit('exit', 'buy', limit=longTake, stop=longStop)


// if sell
//     strategy.entry('sell', strategy.short)
//     strategy.exit('exit', 'sell', limit=shortTake, stop=shortStop)
if(buy)
    strategy.entry("buy",strategy.long,qty = qn)
    strategy.exit("Stop","buy",limit = longTake,stop = longStop)

if(sell)
    strategy.entry("sell",strategy.short,qty = qn)
    strategy.exit("Stop","sell",limit = shortTake,stop = shortStop)

strategy.close("buy",when =  longTPhit or sell or longSLhit, comment = "Target")
strategy.close("sell",when =  shortSLhit or shortTPhit or buy , comment = "Stop Loss")

strategy.cancel("buy",when =  longTPhit or sell or longSLhit)
strategy.cancel("sell",when =  shortSLhit or shortTPhit or buy )