Estrategia de negociación con el indicador MACD de períodos múltiples
Descripción general
Esta estrategia se basa en el clásico indicador MACD, y combina varios criterios auxiliares, como indicadores de juicio de tendencia, métodos de stop loss y métodos de stop loss, para formar una estrategia de negociación de seguimiento de tendencias relativamente completa. Se puede usar tanto en monedas digitales como en divisas y acciones.
Principio de estrategia
El criterio del MACD
- La diferencia entre el FASTLENGTH EMA y el SLOWLENGTH EMA forma la columna MACD
- MACDLENGTH periodoEMA para suavizar las columnas MACD y formar líneas MACD
- La columna MACD se rompe en el eje 0 para formar una señal de compra y venta
Juzgar las tendencias
- ADX: Indicador de tendencia promedio para determinar si hay una tendencia
- MA: promedio móvil, los precios se mueven hacia arriba y hacia abajo en MA
- SAR: Paralelo a la línea SAR, el SAR se mueve hacia arriba y hacia abajo en el precio para juzgar la tendencia
Cómo detener el daño
- Percentaje de pérdida ATR: Percentaje de pérdida establecido según el factor ATR
- SAR Stop: La línea de parálisis como parada después de la entrada
Cómo se detiene la parálisis
- Distancia de frenado fija ATR: ajuste de la distancia de frenado fija según el factor ATR
- Percentaje de frenado: ajuste el porcentaje de frenado
Se acabó el tiempo.
- Se puede configurar para detener el daño después de un número especificado de artículos
Análisis de las ventajas
Varios juicios auxiliares
- Combinando tendencias y soportando juicios de resistencia, puede reducir falsas señales
- Detener el daño ATR/SAR y controlar el riesgo de manera más completa
Configuración flexible
- Se puede elegir si se utiliza el filtro de tendencia
- Opcional para el ATR o el SAR
- Se puede elegir el ATR o la parada estándar
- Los parámetros son flexibles
Proporciona análisis de retroalimentación
- Muestra que la historia se desvía de lo positivo y lo negativo
- Proporciona sugerencias de texto
Facilitar y optimizar la adaptación
- La política incluye una gran cantidad de parámetros configurables
- Facilidad para probar diferentes combinaciones de variables
Análisis de riesgos
Los parámetros incorrectos pueden aumentar las pérdidas
- Los parámetros ATR y SAR están mal configurados y pueden detenerse prematuramente
- La proporción de frenado es demasiado grande y puede ser prematuro.
Riesgo de fallo en el juicio de tendencias
- Los parámetros incorrectos de los indicadores de tendencia pueden causar errores de juicio
- Los acontecimientos inesperados afectan a las tendencias de los juzgados
El riesgo de pérdida de tiempo
- Hay riesgo de pérdidas si se establece un tiempo de parada fijo
Dirección de optimización
- Ajuste de los parámetros de ATR y SAR para que el paro sea más suave
- Prueba de diferentes ciclos de MA para optimizar las tendencias
- Prueba de ajuste de la proporción de frenado para optimizar la rentabilidad
- Parámetros de optimización combinados con el indicador de fluctuación
Resumir
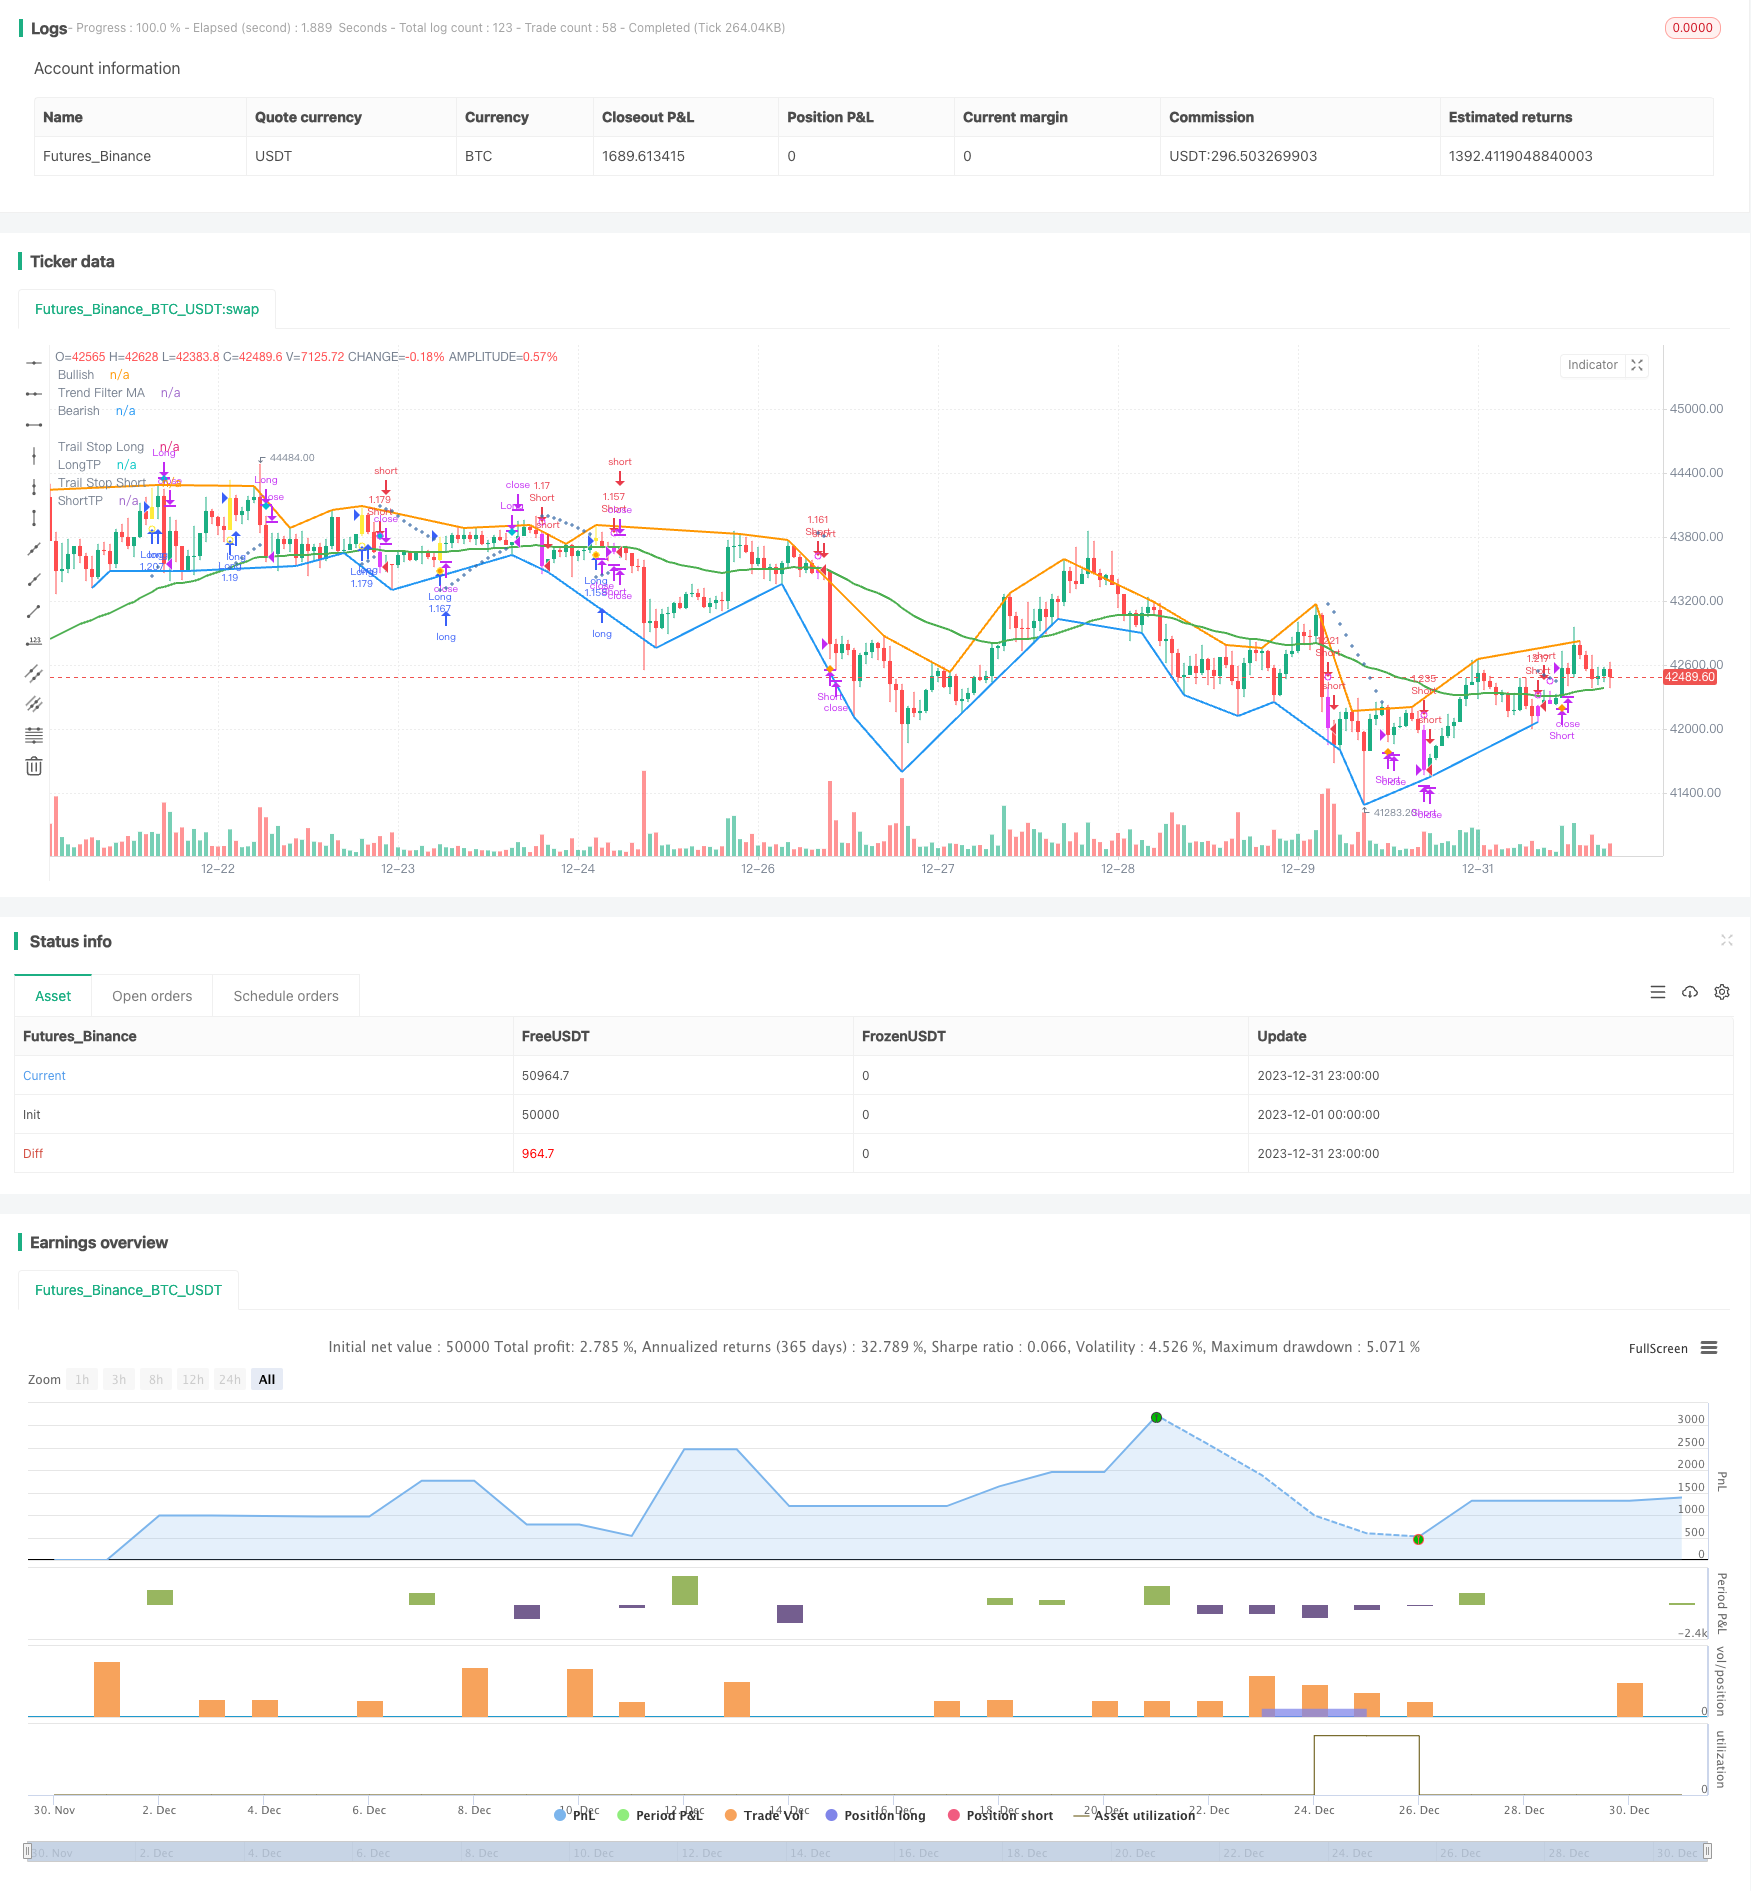
Esta combinación de estrategias toma en cuenta varios aspectos, como el juicio de tendencias, el stop loss y el reconocimiento de reajustes, para formar una estrategia de negociación de divisas digital relativamente completa. Combina las ventajas de los indicadores MACD, aumenta el filtro de tendencias y evita las transacciones erróneas; aumenta el stop loss ATR / SAR y controla mejor el riesgo; el reconocimiento de reajustes proporciona una referencia adicional.
/*backtest
start: 2023-12-01 00:00:00
end: 2023-12-31 23:59:59
period: 1h
basePeriod: 15m
exchanges: [{"eid":"Futures_Binance","currency":"BTC_USDT"}]
*/

// This source code is subject to the terms of the Mozilla Public License 2.0 at https://mozilla.org/MPL/2.0/
// © systemalphatrader

//@version=4

strategy(title="MACD+ Strategy [SystemAlpha]", shorttitle="MACD+ Strategy [SA]", overlay=true, initial_capital=10000, currency='USD',
   default_qty_type=strategy.percent_of_equity, default_qty_value=100, commission_type=strategy.commission.percent, commission_value=0.04)

// == MAIN INPUT ==
// TREND FILTER
// Make input option to configure trend filter
trendFilter  = input(title="Trend Filter", defval='MA', options=['ADX', 'MA', 'SAR', 'All', 'None'])

// Translate input into trend filters
useADXFilter    = (trendFilter == 'ADX') or (trendFilter == 'All')
useSARFilter    = (trendFilter == 'SAR') or (trendFilter == 'All')
useMAFilter     = (trendFilter == 'MA') or (trendFilter == 'All')

// TRAIL STOP
// Make input option to configure trail stop
trailStop       = input(title="Trailing Stop Loss", defval='SAR', options=['ATR', 'SAR', 'None'])

// Translate input
useATRStop      = (trailStop == 'ATR')
useSARStop      = (trailStop == 'SAR')

// TAKE PROFIT TARGET
// Make input option to configure trail stop
TPtarget       = input(title="Take Profit Type", defval='ATR', options=['ATR', 'Percent', 'None'])

// Translate input
useATRTP        = (TPtarget == 'ATR')
usePercentTP    = (TPtarget == 'Percent')

// ALERTS and BAR COLOR
// Make input option to configure alerts
alerts          = input(title="Select Alerts to Display", defval='None', options=['Buy/Sell', 'Exit', 'Both', 'None'])

// Translate input
showsignals     = (alerts == 'Buy/Sell') or (alerts == 'Both')
showexitsignals = (alerts == 'Exit') or (alerts == 'Both')
showBarColor    = input(true, title="Show Bar Color")

// == /MAIN INPUT  ==

/////////////////////////////////////
//*STRATEGY LOGIC                 *//
/////////////////////////////////////

// == MACD ==
fastLength = input(12, title="Fast Length")
slowlength = input(26, title="Slow Length")
MACDLength = input(9, title="MACD Length")

MACD = ema(close, fastLength) - ema(close, slowlength)
aMACD = ema(MACD, MACDLength)
delta = MACD - aMACD

// Calc breakouts
break_up        = crossover(delta, 0)
break_down      = crossunder(delta,0)
// == /MACD ==

// == DIVERGENCE ==
method      = input(title="Divergence Method", defval='Hist', options=['Hist', 'MACD'])
divtype     = input(title="Divergence Type", defval='None', options=['Regular', 'Hidden', 'Both', 'None'])
uReg        = divtype == 'Regular' or divtype == 'Both'
uHid        = divtype == 'Hidden' or divtype == 'Both'
showlabel   = input(true, title="Show Divergence Label")
v_show_last = input(500, "Plotting Lookback Bars Length")

high_src = high
low_src  = low

//  ||  Functions:
f_top_fractal(_src) =>
    _src[4] < _src[2] and _src[3] < _src[2] and _src[2] > _src[1] and
       _src[2] > _src[0]
f_bot_fractal(_src) =>
    _src[4] > _src[2] and _src[3] > _src[2] and _src[2] < _src[1] and
       _src[2] < _src[0]
f_fractalize(_src) =>
    f_bot_fractal__1 = f_bot_fractal(_src)
    f_top_fractal(_src) ? 1 : f_bot_fractal__1 ? -1 : 0
// === End of Functions

//  ||  Method selection
oscilator_high = float(na)
oscilator_low = float(na)
if method == 'MACD'
    oscilator_high := MACD
    oscilator_low := MACD
if method == 'Hist'
    oscilator_high := delta
    oscilator_low := delta
//
fractal_top = f_fractalize(oscilator_high) > 0 ? oscilator_high[2] : na
fractal_bot = f_fractalize(oscilator_low) < 0 ? oscilator_low[2] : na

high_prev   = valuewhen(fractal_top, oscilator_high[2], 0)[2]
high_price  = valuewhen(fractal_top, high[2], 0)[2]
low_prev    = valuewhen(fractal_bot, oscilator_low[2], 0)[2]
low_price   = valuewhen(fractal_bot, low[2], 0)[2]

regular_bearish_div = fractal_top and high[2] > high_price and oscilator_high[2] < high_prev
hidden_bearish_div  = fractal_top and high[2] < high_price and oscilator_high[2] > high_prev
regular_bullish_div = fractal_bot and low[2] < low_price and oscilator_low[2] > low_prev
hidden_bullish_div  = fractal_bot and low[2] > low_price and oscilator_low[2] < low_prev

// Plotting
plot(title='Bullish', series=fractal_top ? high[2] : na, color = regular_bearish_div and uReg or hidden_bearish_div and uHid ? color.red : na, linewidth = 2, transp=50, offset=-2, show_last = v_show_last)
plot(title='Bearish', series=fractal_bot ? low[2] : na, color = regular_bullish_div and uReg or hidden_bullish_div and uHid ? color.green : na, linewidth = 2, transp=50, offset=-2, show_last = v_show_last)

plotshape(title='Regular Bearish', series=not showlabel or not uReg ? na : regular_bearish_div ? high[2] : na, text='R', style=shape.labeldown, location=location.absolute, color=color.red, textcolor=color.white, transp=50, offset=-2, show_last = v_show_last)
plotshape(title='Hidden Bearish', series=not showlabel or not uHid ? na : hidden_bearish_div ? high[2] : na, text='H', style=shape.labeldown, location=location.absolute, color=color.red, textcolor=color.white, transp=80, offset=-2, show_last = v_show_last)
plotshape(title='Regular Bullish', series=not showlabel or not uReg ? na : regular_bullish_div ? low[2] : na, text='R', style=shape.labelup, location=location.absolute, color=color.green, textcolor=color.white, transp=50, offset=-2, show_last = v_show_last)
plotshape(title='Hidden Bullish', series=not showlabel or not uHid ? na : hidden_bullish_div ? low[2] : na, text='H', style=shape.labelup, location=location.absolute, color=color.green, textcolor=color.white, transp=80, offset=-2, show_last = v_show_last)

// == /DIVERGENCE ==

// == ENTRY ==
// == ADX FILTERING ==
// Look at ADX when it is above a user-defined key level (23 default) and this is to identify when it is trending.
// It then looks at the DMI levels.  If D+ is above D- and the ADX is sloping upwards and above the key level, it triggers a buy condition.  Opposite for short.
adxlen          = 13 //input(13, title="TF ADX Smoothing")
dilen           = 13 //input(13, title="TF DI Period")
keyLevel        = 23 //input(23, title="TF Keylevel for ADX")

// == USE BUILT-IN DMI FUNCTION TO DETERMINE ADX AND BULL/BEAR STRENGTH
[diplus, diminus, adx] = dmi(dilen, adxlen)

//Buy and Sell Filter
ADXBuyCheck     = useADXFilter? diplus > diminus : true
ADXSellCheck    = useADXFilter? diplus < diminus : true
// == /ADX FILTERING ==

// == MOVING AVERAGE FILTERING ==
// MA FILTER: Use a user-defined moving average to filter long/short if desried.
maType          = input(defval="EMA", options=["EMA", "SMA"], title = "TF MA Type")
maLength        = input(defval = 50, title = "TF MA Period", minval = 1)

// Declare function to be able to swap out EMA/SMA
ma(maType, src, length) =>
    maType == "EMA" ? ema(src, length) : sma(src, length)
maFilter        = ma(maType, close, maLength)

// Check to see if the useMaFilter check box is checked, this then inputs this conditional "maFilterCheck" variable into the strategy entry
maFilterCheck   = if useMAFilter == true
    maFilter
else
    close
// == /MOVING AVERAGE FILTERING ==

// == PARABOLIC SAR AS AN ENTRY and EXIT OPTION ==
// SAR FILTER: The Parabolic SAR (Stop and Reverse) is a time and price technical analysis tool primarily used to identify points of potential stops and reverses.
// Go long when is located below price (BULLISH) and go short when is located above price (BEARISH).
sarStart        = 0.04 //input(0.04, "SAR Start")
sarIncrement    = 0.02 //input(0.02, "SAR Increment")
sarMaximum      = 0.5 //input(0.5, "SAR Max Value")

htclose         = close
sarOut          = useSARFilter or useSARStop ? sar(sarStart, sarIncrement, sarMaximum) : na
Trend           = sarOut < htclose ? 1 : -1

//Buy and Sell Filter
sarBuyCheck     = useSARFilter? Trend == 1: true
sarSellCheck    = useSARFilter? Trend == -1: true

// Trigger stop based on High/Low
trigResistance  = high
trigSupport     = low

// Determine if price is above resistance or below support
sarResistanceHit    = close >= sarOut and useSARStop == true
sarSupportHit       = close <= sarOut and useSARStop == true
// == /PARABOLIC SAR AS AN ENTRY and EXIT OPTION ==

// == EXITS ==
// == ATR TRAILING STOPS ==
// The ATR % stop method can be used by any type of trader because the width of the stop is determined by the percentage of average true range (ATR).
// ATR is a measure of volatility over a specified period of time.
// Exit with ATR support/resistance is hit.
atrLookback     = 14 //input(defval=14,title="ATR Lookback Period",type=input.integer)
multiplier      = input(defval=2,title="ATR Trailing Stop Multiplier",type=input.float, step=0.1, minval=0.5, maxval=5)

// Calculate the trailing ATR
atrValue        = atr(atrLookback)
atrMultiplied   = atrValue * multiplier

// Plot the price plus or minus the ATR
atrLow          = low - atrMultiplied
atrHigh         = high + atrMultiplied

// Calculate both the low and high trailing ATRs every time. The low one never goes down, and the high one never goes up
// Set them to something to start with
trailAtrLow     = atrLow
trailAtrHigh    = atrHigh

// If the ATR Low has gone up AND it has gone above the trail, the low trailing ATR should also go up. If the ATR Low has gone up or down, but not below the trail, the ATR trail stays where it is
trailAtrLow     := na(trailAtrLow[1]) ? trailAtrLow : atrLow >= trailAtrLow[1] ? atrLow : trailAtrLow[1]
// Same for the High
trailAtrHigh    := na(trailAtrHigh[1]) ? trailAtrHigh : atrHigh <= trailAtrHigh[1] ? atrHigh : trailAtrHigh[1]

// Determine if price is above resistance or below support
atrResistanceHit    = trigResistance >= trailAtrHigh and useATRStop == true
atrSupportHit       = trigSupport <= trailAtrLow and useATRStop == true

// If price is above resistance or below support, reset the trailing ATR
trailAtrLow     := atrSupportHit ? atrLow : trailAtrLow
trailAtrHigh    := atrResistanceHit ? atrHigh : trailAtrHigh
// == /ATR TRAILING STOPS ==

// == INITIAL TP==
// ATR
tpmultiplier   = input(defval=3,title="ATR Take Profit Multiplier",type=input.float, step=0.1, minval=0.5, maxval=5)

ema = ema(close, atrLookback)
atr = rma(tr(true), atrLookback)

longATRTP     = ema + (atr * tpmultiplier)
shortATRTP    = ema - (atr * tpmultiplier)

// Determine if price is above resistance or below support
longATRTPHit    = high >= longATRTP and useATRTP == true
shortATRTPHit   = low <= shortATRTP and useATRTP == true

// STANDARD TAKE PROFIT %
// User Options to Change Inputs (%)
takePer = input(10, title='Take Profit %', type=input.float, step=0.1, minval=0.5, maxval=100) / 100

//fixed TP prices
longPercentTP   = ema * (1 + takePer)
shortPercentTP  = ema * (1 - takePer)

// Determine if price is above resistance or below support
longPercentTPHit    = high >= longPercentTP and usePercentTP == true
shortPercentTPHit   = low <= shortPercentTP and usePercentTP == true

// Set Stop and TP Values
buyStop     = trailStop == 'ATR'? trailAtrLow : trailStop == 'SAR'? sarOut : na
sellStop    = trailStop == 'ATR'? trailAtrHigh : trailStop == 'SAR'? sarOut : na
longTP      = TPtarget == 'ATR'? longATRTP : TPtarget == 'Percent'? longPercentTP : na
shortTP     = TPtarget == 'ATR'? shortATRTP : TPtarget == 'Percent'? shortPercentTP : na

// == /EXITS ==

// == PLOTTING ==
buySignal       = break_up and ADXBuyCheck and close >= maFilterCheck and sarBuyCheck
shortSignal     = break_down and ADXSellCheck and close <= maFilterCheck and sarSellCheck
sellSignal      = atrSupportHit or sarSupportHit or longPercentTPHit or longATRTPHit
coverSignal     = atrResistanceHit or sarResistanceHit or shortPercentTPHit or shortATRTPHit

//Set BarSince counter
barsSinceLong   = 0
barsSinceShort  = 0
barsSinceLong   := nz(barsSinceLong[1])
barsSinceShort  := nz(barsSinceShort[1])

//Plot Sell and Cover Signal
plotshape(not showexitsignals and sellSignal and barsSinceLong == 1? sellSignal : na, title="Sell Long", location=location.abovebar, style=shape.diamond, size=size.auto, color=color.aqua, transp=0, show_last = v_show_last, editable = false)
plotshape(not showexitsignals and coverSignal and barsSinceShort == 1 ? coverSignal : na, title="Cover Short", location=location.belowbar, style=shape.diamond, size=size.auto, color=color.orange, transp=0, show_last = v_show_last, editable = false)
plotshape(showexitsignals and sellSignal and barsSinceLong == 1? sellSignal : na, title="Close Long Text", location=location.abovebar, style=shape.diamond, size=size.auto, color=color.aqua, transp=0, show_last = v_show_last, textcolor=color.aqua, text = "Close\nLong", editable = false)
plotshape(showexitsignals and coverSignal and barsSinceShort == 1 ? coverSignal : na, title="Cover Short Text", location=location.belowbar, style=shape.diamond, size=size.auto, color=color.orange, transp=0, show_last = v_show_last, textcolor=color.orange, text = "Cover\nShort", editable = false)

// Reset BarSince counter
if buySignal
    barsSinceLong := 1
    barsSinceShort := 0
if shortSignal
    barsSinceShort := 1
    barsSinceLong := 0
if sellSignal
    barsSinceLong := 0
if coverSignal
    barsSinceShort := 0

// Show bar color
barcolor(showBarColor? (buySignal or shortSignal ? (shortSignal ? color.fuchsia : color.yellow) : na) : na)

// Plot Buy Alerts
plotshape(buySignal ? buySignal : na, title="Breakout Up", location=location.belowbar, style=shape.circle, size=size.auto, color=color.yellow, transp=0, editable = false)
plotshape(showsignals and buySignal, title= "Long", color=color.green, style=shape.labelup, location=location.belowbar, size=size.auto, show_last = v_show_last, text = "BUY", textcolor=color.white, editable = false)

// Plot Sell Alerts
plotshape(shortSignal ? shortSignal : na, title="Breakout Down", location=location.abovebar, style=shape.circle, size=size.auto, color=color.fuchsia, transp=0, editable = false)
plotshape(showsignals and shortSignal, title= "Short", color=color.red, style=shape.labeldown, location=location.abovebar, size=size.auto, show_last = v_show_last, text = "SELL", textcolor=color.white, editable = false)

// Plot MA Trend Filter
plot(useMAFilter? maFilter : na, title = "Trend Filter MA", color = color.green, linewidth = 2, style = plot.style_line, transp = 20, editable = true)

// Plot Initial Stop
plot(trailStop != 'None' and barsSinceLong >= 1? buyStop : na, color=#3A6CA8, title="Trail Stop Long", style = plot.style_cross, linewidth = 1, transp = 20, editable = true)
plot(trailStop != 'None' and barsSinceShort >= 1? sellStop : na, color=#3A6CA8, title="Trail Stop Short", style = plot.style_cross, linewidth = 1, transp = 20, editable = true)

// Plot Initial Target Profit
plot(TPtarget != 'None' and buySignal? longTP : na, color=color.green, title="LongTP", style = plot.style_linebr, linewidth = 1, editable = false)
plot(TPtarget != 'None' and shortSignal? shortTP : na, color=color.green, title="ShortTP", style = plot.style_linebr, linewidth = 1, editable = false)

// == /PLOTTING ==

// == ALERTS ==
// Buy and Sell Signal
alertcondition(buySignal, title='MACD Long', message='MACD {{exchange}}:{{ticker}} TF: {{interval}}. LONG (TRADE). ENTRY: {{close}}, Target Profit: {{plot("LongTP")}}, STOP LOSS: {{plot("Trail Stop Long")}}')
alertcondition(shortSignal, title='MACD Short', message='MACD {{exchange}}:{{ticker}} TF: {{interval}}. SHORT (TRADE). ENTRY: {{close}}, Target Profit: {{plot("ShortTP")}}, STOP LOSS: {{plot("Trail Stop Short")}}')
alertcondition(sellSignal, title='MACD Close Long', message='MACD {{exchange}}:{{ticker}} Close Long, Price = {{close}}')
alertcondition(coverSignal, title='MACD Cover Short', message='MACD {{exchange}}:{{ticker}} Cover Short, Price = {{close}}')
alertcondition(sellSignal or coverSignal, title="MACD Close Orders", message="{{ticker}} Close Orders")

// Initial SL and TP Hit
stophit = low <= buyStop or high >= sellStop
tphit   = low <= shortTP or high >= longTP
alertcondition(stophit, title='MACD SL Hit', message='MACD {{exchange}}:{{ticker}} Stop Loss Hit, Price = {{close}}')
alertcondition(tphit, title='MACD TP Hit', message='MACD {{exchange}}:{{ticker}} Target Profit Hit, Price = {{close}}')

//Divergence Alerts
alertcondition(regular_bullish_div, title='MACD Bullish Divergence', message='MACD Regular Bullish Divergence')
alertcondition(regular_bearish_div, title='MACD Bearish Divergence', message='MACD Regular Bearish Divergence')
alertcondition(hidden_bullish_div, title='MACD Hidden Bullish Divergence', message='MACD Hidden Bullish Divergence')
alertcondition(hidden_bearish_div, title='MACD Hidden Bearish Divergence', message='MACD Hidden Bearish Divergence')
// == /ALERTS ==

//////////////////////////
//* STRATEGY COMPONENT *//
//////////////////////////

// === BACKTEST RANGE ===
From_Year   = input(defval = 2017, title = "BACKTEST: From Year")
From_Month  = input(defval = 1, title = "BACKTEST: From Month", minval = 1, maxval = 12)
From_Day    = input(defval = 1, title = "BACKTEST: From Day", minval = 1, maxval = 31)
To_Year     = input(defval = 9999, title = "BACKTEST: To Year")
To_Month    = input(defval = 1, title = "BACKTEST: To Month", minval = 1, maxval = 12)
To_Day      = input(defval = 1, title = "BACKTEST: To Day", minval = 1, maxval = 31)
Start       = timestamp(From_Year, From_Month, From_Day, 00, 00)  // backtest start window
Finish      = timestamp(To_Year, To_Month, To_Day, 23, 59)        // backtest finish window

testPeriod() => true
// === /BACKTEST RANGE ===

// === STRATEGY ===
// Make input option to configure trade direction
tradeDirection = input(title="Trade Direction", defval="Both", options=["Long", "Short", "Both"])

// Translate input into trading conditions
longOK  = (tradeDirection == "Long") or (tradeDirection == "Both")
shortOK = (tradeDirection == "Short") or (tradeDirection == "Both")

// == STRATEGY ENTRIES/EXITS ==
timedExit   = input(title = "Use Timed Exit", type = input.bool, defval = true)
exitmethod  = input(title="Timed Exit Method", defval='3', options=['1', '2', '3'])
bse         = input(10, "Bar Since Entry") // Bars to exit after entry

barsSinceEntry  = 0
barsSinceEntry  := nz(barsSinceEntry[1]) + 1

longCondition = longOK and buySignal and testPeriod()
shortcondition = shortOK and shortSignal and testPeriod()

if strategy.position_size == 0
    barsSinceEntry := 0

// === STRATEGY - LONG POSITION EXECUTION ===
if longCondition
    strategy.entry("Long", strategy.long)
    barsSinceEntry := 0

// === STRATEGY - SHORT POSITION EXECUTION ===
if shortcondition
    strategy.entry("Short", strategy.short)
    barsSinceEntry := 0

// == STRATEGY EXITS ==
if sellSignal
    strategy.close("Long")
    barsSinceEntry := 0
if coverSignal
    strategy.close("Short")
    barsSinceEntry := 0

// Enable Timed Exit
// Exit after specified number of bars.
if timedExit and exitmethod == '1' and barsSinceEntry > bse
    strategy.close_all()
    barsSinceEntry := 0
// Exit after specified number of bars, ONLY if position is currently profitable.
if timedExit and exitmethod == '2' and strategy.openprofit > 0 and barsSinceEntry > bse
    strategy.close_all()
    barsSinceEntry := 0
// Exit after specified number of bars, ONLY if position is currently losing.
if timedExit and exitmethod == '3' and strategy.openprofit < 0 and barsSinceEntry > bse
    strategy.close_all()
    barsSinceEntry := 0
// === /STRATEGY ===
//EOF