Estrategia de ruptura de impulso de doble MA
Descripción general
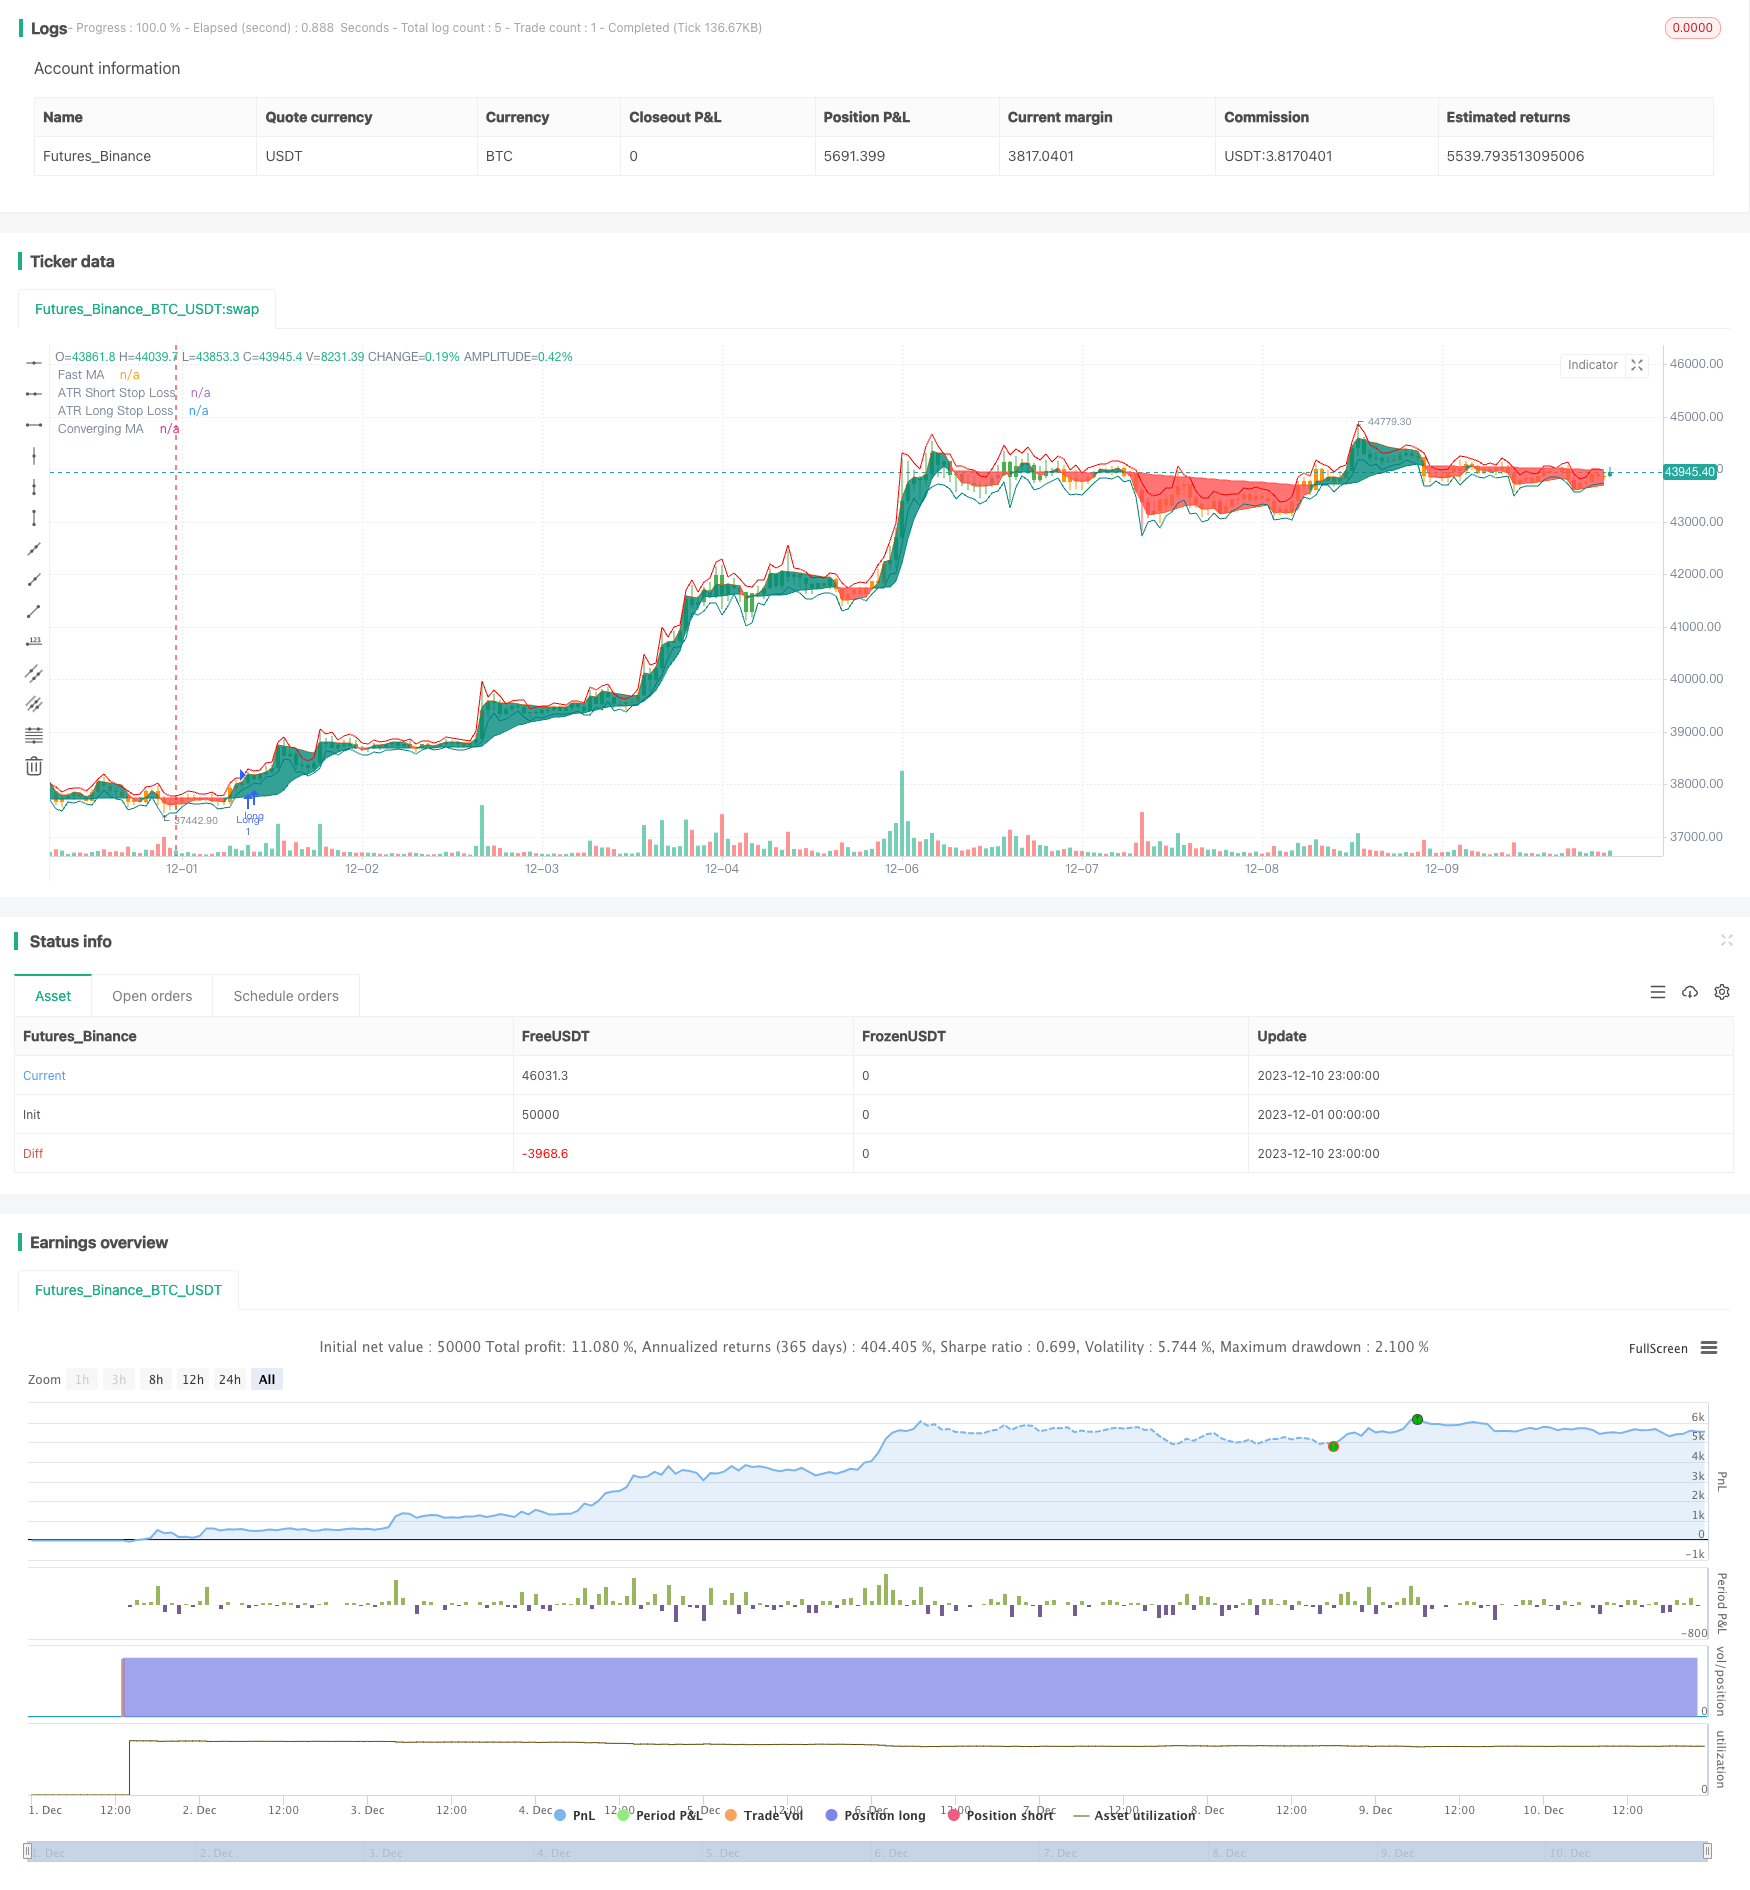
La estrategia de ruptura de la MA doble es una estrategia de negociación cuantitativa que combina dos promedios móviles y el indicador RSI. La estrategia establece un umbral de sobreventa y sobreventa del indicador RSI mediante el cálculo de promedios móviles rápidos, promedios móviles lentos e indicadores RSI.
Principio de estrategia
La estrategia de ruptura de la MA doble se basa principalmente en dos promedios móviles y el indicador RSI. Primero se calculan dos promedios móviles de forma rápida y lenta, la línea rápida es la media móvil ponderada de 10 días y la línea lenta es la media móvil de adaptación lineal de 100 días. Luego se calcula el indicador RSI de 14 días y se establece un umbral de venta por encima de la venta.
Concretamente, cuando se juzga que es un movimiento de más cabeza, se abre una posición de más cabeza si el indicador RSI en ese momento está por encima de la línea de sobreventa; cuando se juzga que es un movimiento de cabeza vacía, si el indicador RSI está por debajo de la línea de sobreventa, se abre una posición de cabeza vacía. Después de la apertura de la posición, se abre una posición de reversión cuando se produce una reversión de la señal de negociación.
Ventajas estratégicas
La estrategia de ruptura de doble MA, combinada con los indicadores de doble MA y RSI, permite identificar eficazmente las tendencias del mercado y utilizar el indicador RSI para filtrar las falsas rupturas, lo que mejora la fiabilidad de la señal de negociación. En comparación con el sistema de una sola MA, la estrategia puede reducir considerablemente la incidencia de operaciones no válidas. Además, la optimización de los parámetros del indicador RSI también brinda flexibilidad a la estrategia.
Riesgo estratégico
La estrategia de ruptura de doble MA también presenta ciertos riesgos. Los sistemas de doble MA son muy sensibles a los parámetros y requieren una combinación de parámetros de prueba cuidadosa para diferentes mercados. Además, los umbrales establecidos por el indicador RSI pueden causar oportunidades de negociación erróneas si no son apropiados.
Optimización de la estrategia
La estrategia de la ruptura de la dinámica de doble MA se puede optimizar en los siguientes aspectos:
- Optimizar los parámetros de la MA rápida y lenta para encontrar la combinación óptima de parámetros;
- Optimizar los parámetros del RSI para ajustar los umbrales de sobrecompra y sobreventa;
- Incrementar los mecanismos de amortización móvil adaptativos para controlar el riesgo;
- Aumentar el módulo de optimización de la apertura de depósitos y mejorar la eficiencia en el uso de los fondos.
Resumir
La estrategia de ruptura de la dinámica de doble MA determina la dirección de la tendencia a través del sistema de doble MA y utiliza el indicador RSI para filtrar las señales. Puede mejorar eficazmente las deficiencias del sistema de una sola MA. La estrategia tiene un gran espacio para optimizar los parámetros y puede realizar un ajuste de adaptación.
/*backtest
start: 2023-12-01 00:00:00
end: 2023-12-10 23:59:59
period: 1h
basePeriod: 15m
exchanges: [{"eid":"Futures_Binance","currency":"BTC_USDT"}]
*/

// This work is licensed under a Attribution-NonCommercial-ShareAlike 4.0 International (CC BY-NC-SA 4.0) https://creativecommons.org/licenses/by-nc-sa/4.0/
// © Salman4sgd

//@version=5
strategy("MAConverging + QQE Threshold Strategy", overlay = true)
//------------------------------------------------------------------------------
//Settings
//-----------------------------------------------------------------------------{
length = input(100)

incr   = input(10, "Increment")

fast   = input(10)

src    = input(close)

//-----------------------------------------------------------------------------}
//Calculations
//-----------------------------------------------------------------------------{
var ma    = 0.
var fma   = 0.
var alpha = 0.
var k     = 1 / incr

upper = ta.highest(length)
lower = ta.lowest(length)
init_ma = ta.sma(src, length)

cross = ta.cross(src,ma)

alpha := cross ? 2 / (length + 1)
  : src > ma and upper > upper[1] ? alpha + k
  : src < ma and lower < lower[1] ? alpha + k
  : alpha

ma := nz(ma[1] + alpha[1] * (src - ma[1]), init_ma)

fma := nz(cross ? math.avg(src, fma[1])
  : src > ma ? math.max(src, fma[1]) + (src - fma[1]) / fast
  : math.min(src, fma[1]) + (src - fma[1]) / fast,src)

//-----------------------------------------------------------------------------}
//Plots
//-----------------------------------------------------------------------------{
css = fma > ma ? color.teal : color.red

plot0 = plot(fma, "Fast MA"
  , color = #ff5d00
  , transp = 100)

plot1 = plot(ma, "Converging MA"
  , color = css)

fill(plot0, plot1, css
  , "Fill"
  , transp = 80)

//-----------------------------------------------------------------------------}

RSI_Period = input(14, title='RSI Length')
SF = input(5, title='RSI Smoothing')
QQE = input(4.238, title='Fast QQE Factor')
ThreshHold = input(10, title='Thresh-hold')
//
sQQEx = input(false, title='Show Smooth RSI, QQE Signal crosses')
sQQEz = input(false, title='Show Smooth RSI Zero crosses')
sQQEc = input(false, title='Show Smooth RSI Thresh Hold Channel Exits')
ma_type = input.string(title='MA Type', defval='EMA', options=['ALMA', 'EMA', 'DEMA', 'TEMA', 'WMA', 'VWMA', 'SMA', 'SMMA', 'HMA', 'LSMA', 'PEMA'])
lsma_offset = input.int(defval=0, title='* Least Squares (LSMA) Only - Offset Value', minval=0)
alma_offset = input.float(defval=0.85, title='* Arnaud Legoux (ALMA) Only - Offset Value', minval=0, step=0.01)
alma_sigma = input.int(defval=6, title='* Arnaud Legoux (ALMA) Only - Sigma Value', minval=0)
inpDrawBars = input(true, title='color bars?')


ma(type, src, len) =>
    float result = 0
    if type == 'SMA'  // Simple
        result := ta.sma(src, len)
        result
    if type == 'EMA'  // Exponential
        result := ta.ema(src, len)
        result
    if type == 'DEMA'  // Double Exponential
        e = ta.ema(src, len)
        result := 2 * e - ta.ema(e, len)
        result
    if type == 'TEMA'  // Triple Exponential
        e = ta.ema(src, len)
        result := 3 * (e - ta.ema(e, len)) + ta.ema(ta.ema(e, len), len)
        result
    if type == 'WMA'  // Weighted
        result := ta.wma(src, len)
        result
    if type == 'VWMA'  // Volume Weighted
        result := ta.vwma(src, len)
        result
    if type == 'SMMA'  // Smoothed
        w = ta.wma(src, len)
        result := na(w[1]) ? ta.sma(src, len) : (w[1] * (len - 1) + src) / len
        result
    if type == 'HMA'  // Hull
        result := ta.wma(2 * ta.wma(src, len / 2) - ta.wma(src, len), math.round(math.sqrt(len)))
        result
    if type == 'LSMA'  // Least Squares
        result := ta.linreg(src, len, lsma_offset)
        result
    if type == 'ALMA'  // Arnaud Legoux
        result := ta.alma(src, len, alma_offset, alma_sigma)
        result
    if type == 'PEMA'
        // Copyright (c) 2010-present, Bruno Pio
        // Copyright (c) 2019-present, Alex Orekhov (everget)
        // Pentuple Exponential Moving Average script may be freely distributed under the MIT license.
        ema1 = ta.ema(src, len)
        ema2 = ta.ema(ema1, len)
        ema3 = ta.ema(ema2, len)
        ema4 = ta.ema(ema3, len)
        ema5 = ta.ema(ema4, len)
        ema6 = ta.ema(ema5, len)
        ema7 = ta.ema(ema6, len)
        ema8 = ta.ema(ema7, len)
        pema = 8 * ema1 - 28 * ema2 + 56 * ema3 - 70 * ema4 + 56 * ema5 - 28 * ema6 + 8 * ema7 - ema8
        result := pema
        result
    result

src := input(close, title='RSI Source')
//

//
Wilders_Period = RSI_Period * 2 - 1


Rsi = ta.rsi(src, RSI_Period)
RsiMa = ma(ma_type, Rsi, SF)
AtrRsi = math.abs(RsiMa[1] - RsiMa)
MaAtrRsi = ma(ma_type, AtrRsi, Wilders_Period)
dar = ma(ma_type, MaAtrRsi, Wilders_Period) * QQE

longband = 0.0
shortband = 0.0
trend = 0

DeltaFastAtrRsi = dar
RSIndex = RsiMa
newshortband = RSIndex + DeltaFastAtrRsi
newlongband = RSIndex - DeltaFastAtrRsi
longband := RSIndex[1] > longband[1] and RSIndex > longband[1] ? math.max(longband[1], newlongband) : newlongband
shortband := RSIndex[1] < shortband[1] and RSIndex < shortband[1] ? math.min(shortband[1], newshortband) : newshortband
cross_1 = ta.cross(longband[1], RSIndex)
trend := ta.cross(RSIndex, shortband[1]) ? 1 : cross_1 ? -1 : nz(trend[1], 1)
FastAtrRsiTL = trend == 1 ? longband : shortband

//
// Find all the QQE Crosses
QQExlong = 0
QQExlong := nz(QQExlong[1])
QQExshort = 0
QQExshort := nz(QQExshort[1])
QQExlong := sQQEx and FastAtrRsiTL < RSIndex ? QQExlong + 1 : 0
QQExshort := sQQEx and FastAtrRsiTL > RSIndex ? QQExshort + 1 : 0
// Zero cross
QQEzlong = 0
QQEzlong := nz(QQEzlong[1])
QQEzshort = 0
QQEzshort := nz(QQEzshort[1])
QQEzlong := sQQEz and RSIndex >= 50 ? QQEzlong + 1 : 0
QQEzshort := sQQEz and RSIndex < 50 ? QQEzshort + 1 : 0
//
// Thresh Hold channel Crosses give the BUY/SELL alerts.
QQEclong = 0
QQEclong := nz(QQEclong[1])
QQEcshort = 0
QQEcshort := nz(QQEcshort[1])
QQEclong := sQQEc and RSIndex > 50 + ThreshHold ? QQEclong + 1 : 0
QQEcshort := sQQEc and RSIndex < 50 - ThreshHold ? QQEcshort + 1 : 0


// // QQE exit from Thresh Hold Channel
// plotshape(sQQEc and QQEclong == 1 ? RsiMa - 50 : na, title='QQE XC Over Channel', style=shape.diamond, location=location.absolute, color=color.new(color.olive, 0), size=size.small, offset=0)
// plotshape(sQQEc and QQEcshort == 1 ? RsiMa - 50 : na, title='QQE XC Under Channel', style=shape.diamond, location=location.absolute, color=color.new(color.red, 0), size=size.small, offset=0)
// // QQE crosses
// plotshape(sQQEx and QQExlong == 1 ? FastAtrRsiTL[1] - 50 : na, title='QQE XQ Cross Over', style=shape.circle, location=location.absolute, color=color.new(color.lime, 0), size=size.small, offset=-1)
// plotshape(sQQEx and QQExshort == 1 ? FastAtrRsiTL[1] - 50 : na, title='QQE XQ Cross Under', style=shape.circle, location=location.absolute, color=color.new(color.blue, 0), size=size.small, offset=-1)
// // Signal crosses zero line
// plotshape(sQQEz and QQEzlong == 1 ? RsiMa - 50 : na, title='QQE XZ Zero Cross Over', style=shape.square, location=location.absolute, color=color.new(color.aqua, 0), size=size.small, offset=0)
// plotshape(sQQEz and QQEzshort == 1 ? RsiMa - 50 : na, title='QQE XZ Zero Cross Under', style=shape.square, location=location.absolute, color=color.new(color.fuchsia, 0), size=size.small, offset=0)

// hcolor = RsiMa - 50 > ThreshHold ? color.green : RsiMa - 50 < 0 - ThreshHold ? color.red : color.orange
// plot(FastAtrRsiTL - 50, color=color.new(color.blue, 0), linewidth=2)
// p1 = plot(RsiMa - 50, color=color.new(color.orange, 0), linewidth=2)
// plot(RsiMa - 50, color=hcolor, style=plot.style_columns, transp=50)


// hZero = hline(0, color=color.black, linestyle=hline.style_dashed, linewidth=1)
// hUpper = hline(ThreshHold, color=color.green, linestyle=hline.style_dashed, linewidth=2)
// hLower = hline(0 - ThreshHold, color=color.red, linestyle=hline.style_dashed, linewidth=2)
// fill(hUpper, hLower, color=color.new(color.gray, 80))
//EOF

length := input.int(title='ATR Length', defval=14, minval=1)
smoothing = input.string(title='ATR Smoothing', defval='RMA', options=['RMA', 'SMA', 'EMA', 'WMA'])
m = input(0.3, 'ATR Multiplier')
src1 = input(high)
src2 = input(low)
pline = input(true, 'Show Price Lines')
col1 = input(color.blue, 'ATR Text Color')
col2 = input.color(color.teal, 'Low Text Color', inline='1')
col3 = input.color(color.red, 'High Text Color', inline='2')

collong = input.color(color.teal, 'Low Line Color', inline='1')
colshort = input.color(color.red, 'High Line Color', inline='2')

ma_function(source, length) =>
    if smoothing == 'RMA'
        ta.rma(source, length)
    else
        if smoothing == 'SMA'
            ta.sma(source, length)
        else
            if smoothing == 'EMA'
                ta.ema(source, length)
            else
                ta.wma(source, length)

a = ma_function(ta.tr(true), length) * m
s_sl = ma_function(ta.tr(true), length) * m + src1
l_sl = src2 - ma_function(ta.tr(true), length) * m

p1 = plot(s_sl, title='ATR Short Stop Loss', color=colshort, trackprice=pline ? true : false, transp=20)
p2 = plot(l_sl, title='ATR Long Stop Loss', color=collong, trackprice=pline ? true : false, transp=20)


bgc = RsiMa - 50 > ThreshHold ? color.green : Rsi - 50 < 0 - ThreshHold ? color.red : color.orange
barcolor(inpDrawBars ? bgc : na)
prebuy = RsiMa - 50 > ThreshHold
buy=prebuy and not(prebuy[1]) and fma > ma

var long_tp=0.0
var long_sl=0.0
var short_tp=0.0
var short_sl=0.0

if prebuy
    strategy.close("Short")


if buy and strategy.position_size<=0
    strategy.entry("Long", strategy.long)
    long_sl:=l_sl
    long_tp:=close+(close-long_sl)*2


//if strategy.position_size>0
strategy.exit("L_SL","Long",stop=long_sl)
    //strategy.exit("L_SL","Long",stop=long_sl)
// if low<long_sl[1]
//     strategy.close("Long")

presell=RsiMa - 50 < 0 - ThreshHold // RsiMa - 50 < 0 - ThreshHold
sell= presell and not(presell[1]) and fma < ma

//plotshape(presell)

if presell
    strategy.close("Long")

if sell and strategy.position_size>=0
    strategy.entry("Short", strategy.short)
    short_sl:=s_sl
    short_tp:=close-(short_sl-close)*2

//if strategy.position_size<0
strategy.exit("S_SL","Short",stop=short_sl)
    //strategy.exit("S_SL","Short",stop=short_sl)