Estrategia de seguimiento del impulso a lo largo de distintos períodos de tiempo
Descripción general
Esta estrategia permite el seguimiento de la dinámica a través de los marcos de tiempo mediante la combinación de la inversión 123 y el indicador MACD. La inversión 123 determina el punto de reversión de la tendencia a corto plazo, y el MACD determina la tendencia a medio y largo plazo, ambos en combinación con la detección de señales de blanqueo de la tendencia a medio y largo plazo al mismo tiempo que la reversión a corto plazo.
Principio de estrategia
La estrategia tiene dos partes:
123 Sección inversa: las dos líneas K actuales forman los puntos altos/bajos, y generan una señal de compra/venta cuando el indicador aleatorio está por debajo/por encima de 50.
Parte del MACD: la línea rápida produce una señal de compra cuando atraviesa la línea lenta, y la línea rápida produce una señal de venta cuando atraviesa la línea lenta.
Finalmente, se combinan los dos, es decir, se emite la señal final cuando el MACD también genera una señal de sincronización al mismo tiempo que 123 invierte.
Análisis de las ventajas
La estrategia combina inversiones a corto plazo y tendencias a medio y largo plazo, y puede bloquear tendencias a medio y largo plazo en fluctuaciones a corto plazo para obtener una mayor ganancia. Especialmente en situaciones de crisis, se puede eliminar parte del ruido con inversiones a 123 para mejorar la estabilidad.
También se puede ajustar el parámetro para equilibrar la proporción de señales de inversión y señales de tendencia, adaptándose a diferentes entornos de mercado.
Análisis de riesgos
La estrategia tiene un cierto retraso en el tiempo, especialmente cuando se utiliza el MACD de largo período, y puede perderse el movimiento a corto plazo. Además, la propia señal de inversión tiene un cierto grado de aleatoriedad y es fácil de atrapar.
Se puede acortar el ciclo MACD apropiadamente o aumentar el stop loss para controlar el riesgo.
Dirección de optimización
La estrategia puede ser optimizada en los siguientes aspectos:
Ajuste de los parámetros de reversión 123 para optimizar el efecto de reversión
Ajustar los parámetros MACD para optimizar el juicio de tendencias
Aumentar la eficacia de los filtros de otros indicadores auxiliares
Aumentar las estrategias para detener los daños y controlar el riesgo
Resumir
Esta estrategia integra varios parámetros y indicadores técnicos de varios marcos de tiempo, y equilibra las ventajas de las inversiones y las operaciones de tendencia mediante el seguimiento de la dinámica a través de marcos de tiempo. Se puede ajustar el equilibrio a través de los parámetros y se puede introducir más indicadores o paradas para optimizar, es una idea estratégica con mucho potencial.
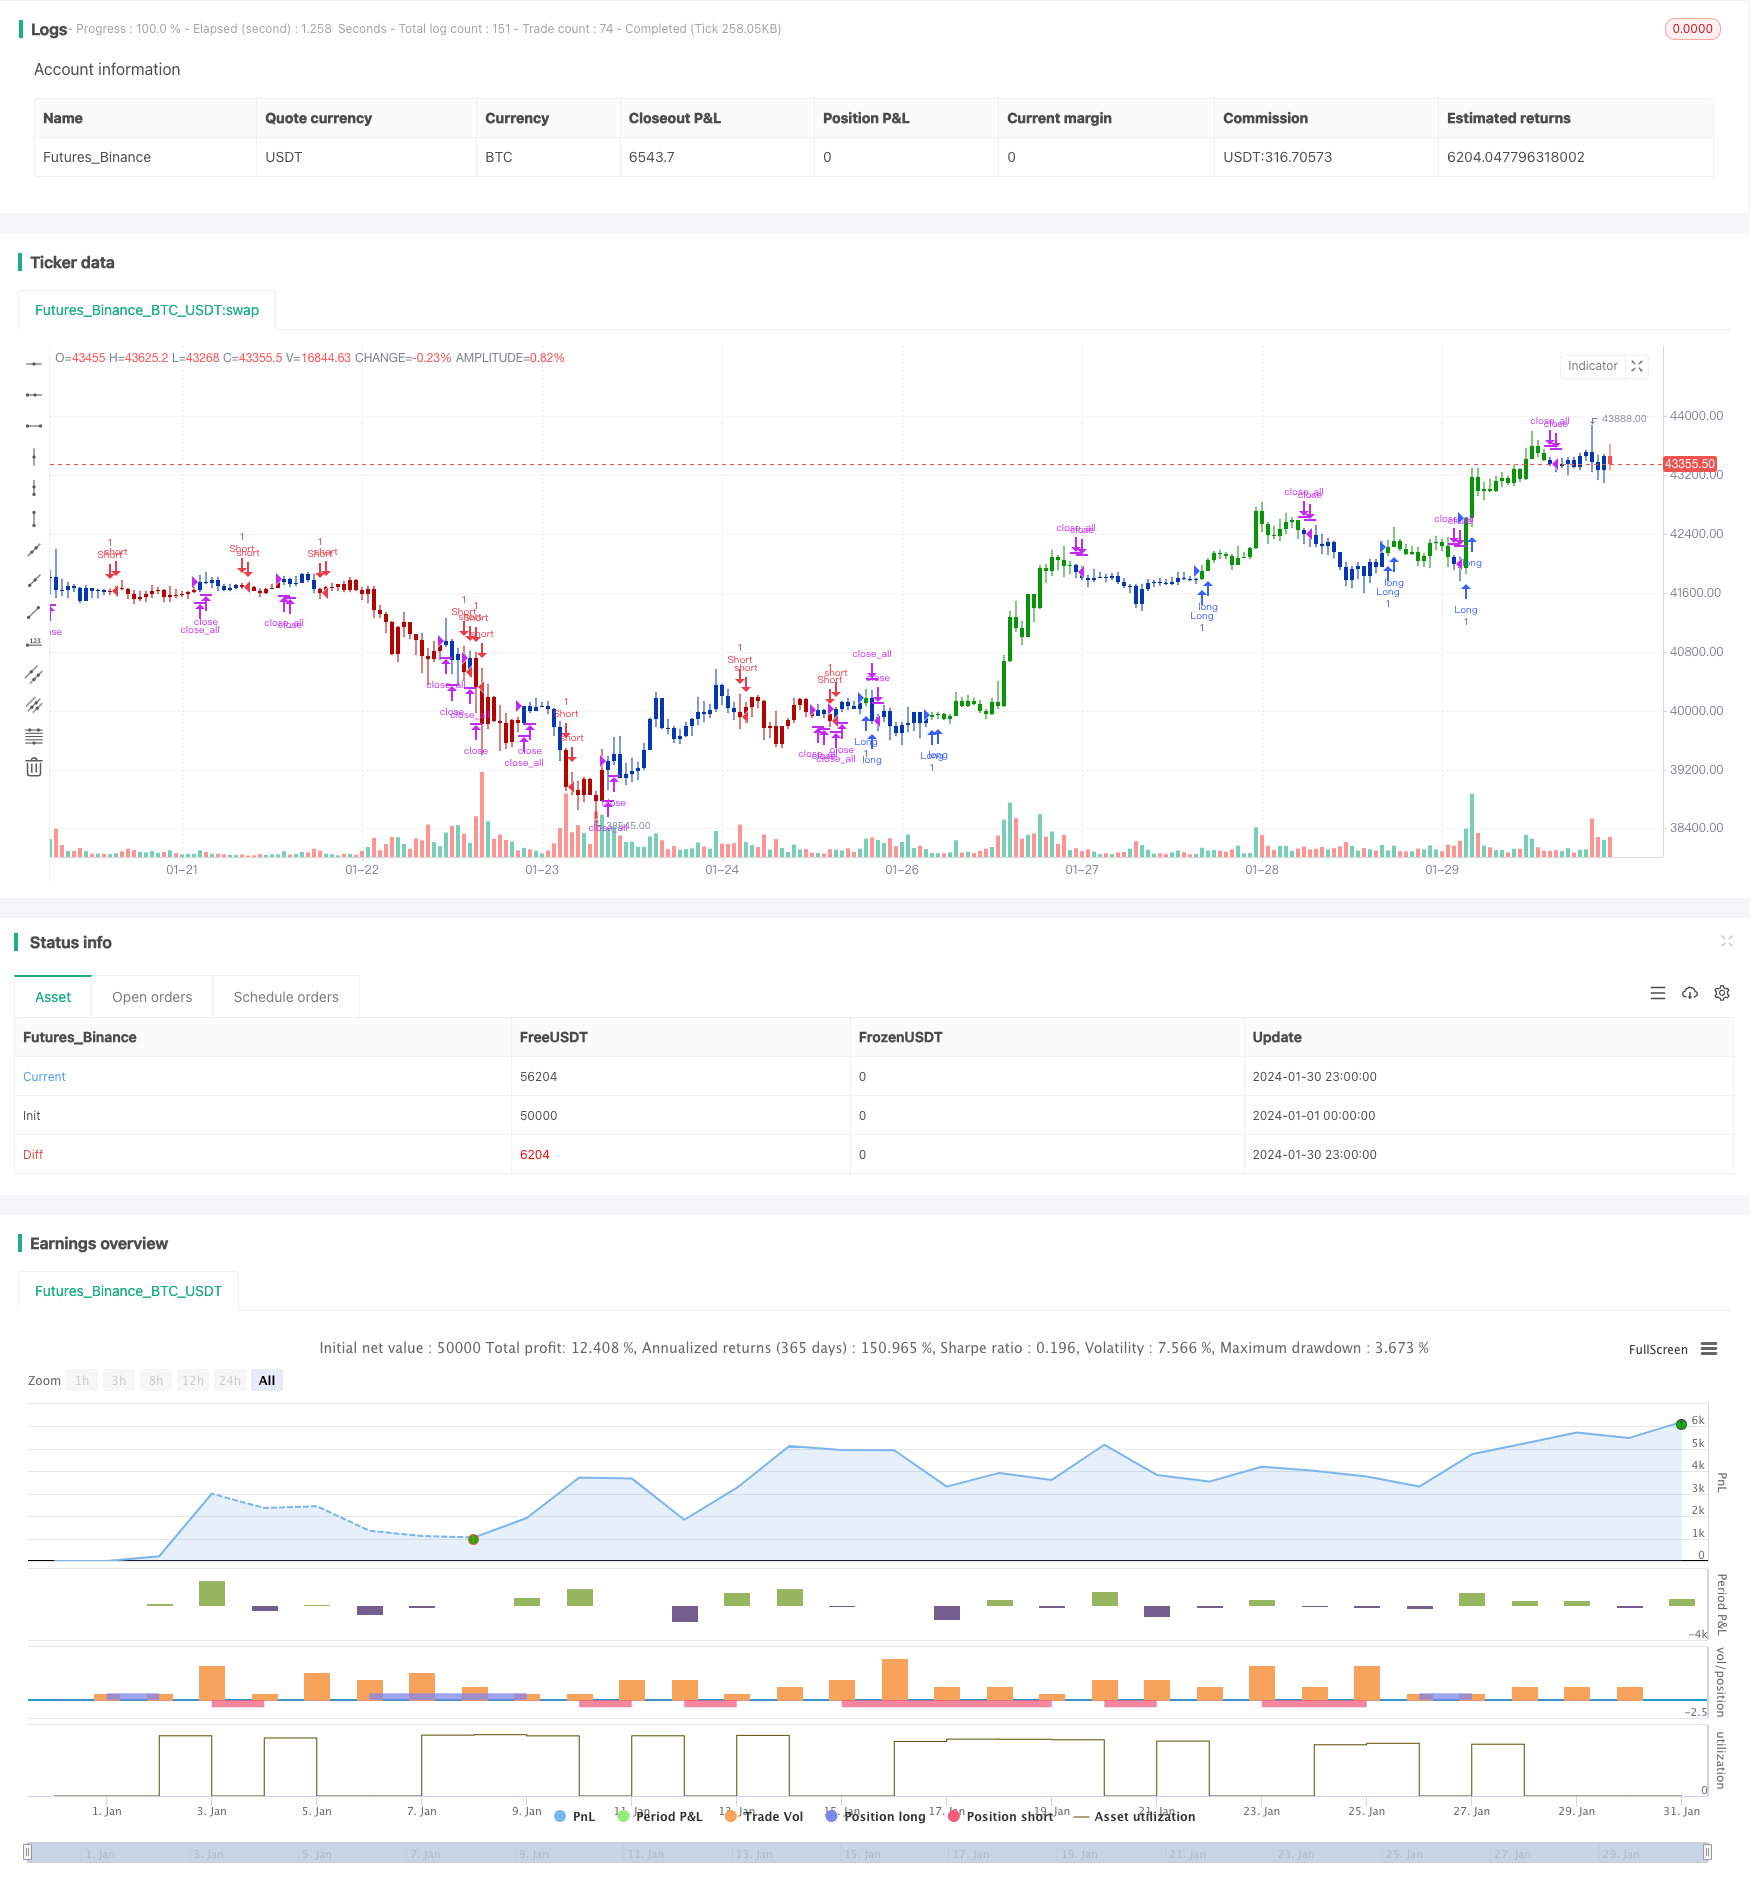
/*backtest
start: 2024-01-01 00:00:00
end: 2024-01-31 00:00:00
period: 1h
basePeriod: 15m
exchanges: [{"eid":"Futures_Binance","currency":"BTC_USDT"}]
*/

//@version=4
////////////////////////////////////////////////////////////
//  Copyright by HPotter v1.0 28/01/2021
// This is combo strategies for get a cumulative signal.
//
// First strategy
// This System was created from the Book "How I Tripled My Money In The
// Futures Market" by Ulf Jensen, Page 183. This is reverse type of strategies.
// The strategy buys at market, if close price is higher than the previous close
// during 2 days and the meaning of 9-days Stochastic Slow Oscillator is lower than 50.
// The strategy sells at market, if close price is lower than the previous close price
// during 2 days and the meaning of 9-days Stochastic Fast Oscillator is higher than 50.
//
// Second strategy
// MACD – Moving Average Convergence Divergence. The MACD is calculated
// by subtracting a 26-day moving average of a security's price from a
// 12-day moving average of its price. The result is an indicator that
// oscillates above and below zero. When the MACD is above zero, it means
// the 12-day moving average is higher than the 26-day moving average.
// This is bullish as it shows that current expectations (i.e., the 12-day
// moving average) are more bullish than previous expectations (i.e., the
// 26-day average). This implies a bullish, or upward, shift in the supply/demand
// lines. When the MACD falls below zero, it means that the 12-day moving average
// is less than the 26-day moving average, implying a bearish shift in the
// supply/demand lines.
// A 9-day moving average of the MACD (not of the security's price) is usually
// plotted on top of the MACD indicator. This line is referred to as the "signal"
// line. The signal line anticipates the convergence of the two moving averages
// (i.e., the movement of the MACD toward the zero line).
// Let's consider the rational behind this technique. The MACD is the difference
// between two moving averages of price. When the shorter-term moving average rises
// above the longer-term moving average (i.e., the MACD rises above zero), it means
// that investor expectations are becoming more bullish (i.e., there has been an
// upward shift in the supply/demand lines). By plotting a 9-day moving average of
// the MACD, we can see the changing of expectations (i.e., the shifting of the
// supply/demand lines) as they occur.
//
// WARNING:
// - For purpose educate only
// - This script to change bars colors.
////////////////////////////////////////////////////////////
Reversal123(Length, KSmoothing, DLength, Level) =>
    vFast = sma(stoch(close, high, low, Length), KSmoothing)
    vSlow = sma(vFast, DLength)
    pos = 0.0
    pos := iff(close[2] < close[1] and close > close[1] and vFast < vSlow and vFast > Level, 1,
	         iff(close[2] > close[1] and close < close[1] and vFast > vSlow and vFast < Level, -1, nz(pos[1], 0)))
	pos

MACD(fastLength,slowLength,signalLength) =>
    pos = 0.0
    fastMA = ema(close, fastLength)
    slowMA = ema(close, slowLength)
    macd = fastMA - slowMA
    signal = sma(macd, signalLength)
    pos:= iff(signal < macd , 1,
	       iff(signal > macd, -1, nz(pos[1], 0)))
    pos

strategy(title="Combo Backtest 123 Reversal & MACD Crossover", shorttitle="Combo", overlay = true)
line1 = input(true, "---- 123 Reversal ----")
Length = input(14, minval=1)
KSmoothing = input(1, minval=1)
DLength = input(3, minval=1)
Level = input(50, minval=1)
//-------------------------
fastLength = input(8, minval=1)
slowLength = input(16,minval=1)
signalLength=input(11,minval=1)
xSeria = input(title="Source", type=input.source, defval=close)
reverse = input(false, title="Trade reverse")
posReversal123 = Reversal123(Length, KSmoothing, DLength, Level)
posMACD = MACD(fastLength,slowLength, signalLength)
pos = iff(posReversal123 == 1 and posMACD == 1 , 1,
	   iff(posReversal123 == -1 and posMACD == -1, -1, 0))
possig = iff(reverse and pos == 1, -1,
          iff(reverse and pos == -1 , 1, pos))
if (possig == 1)
    strategy.entry("Long", strategy.long)
if (possig == -1)
    strategy.entry("Short", strategy.short)
if (possig == 0)
    strategy.close_all()
barcolor(possig == -1 ? #b50404: possig == 1 ? #079605 : #0536b3 )