Estrategia de trading a corto plazo con ruptura de impulso
Descripción general
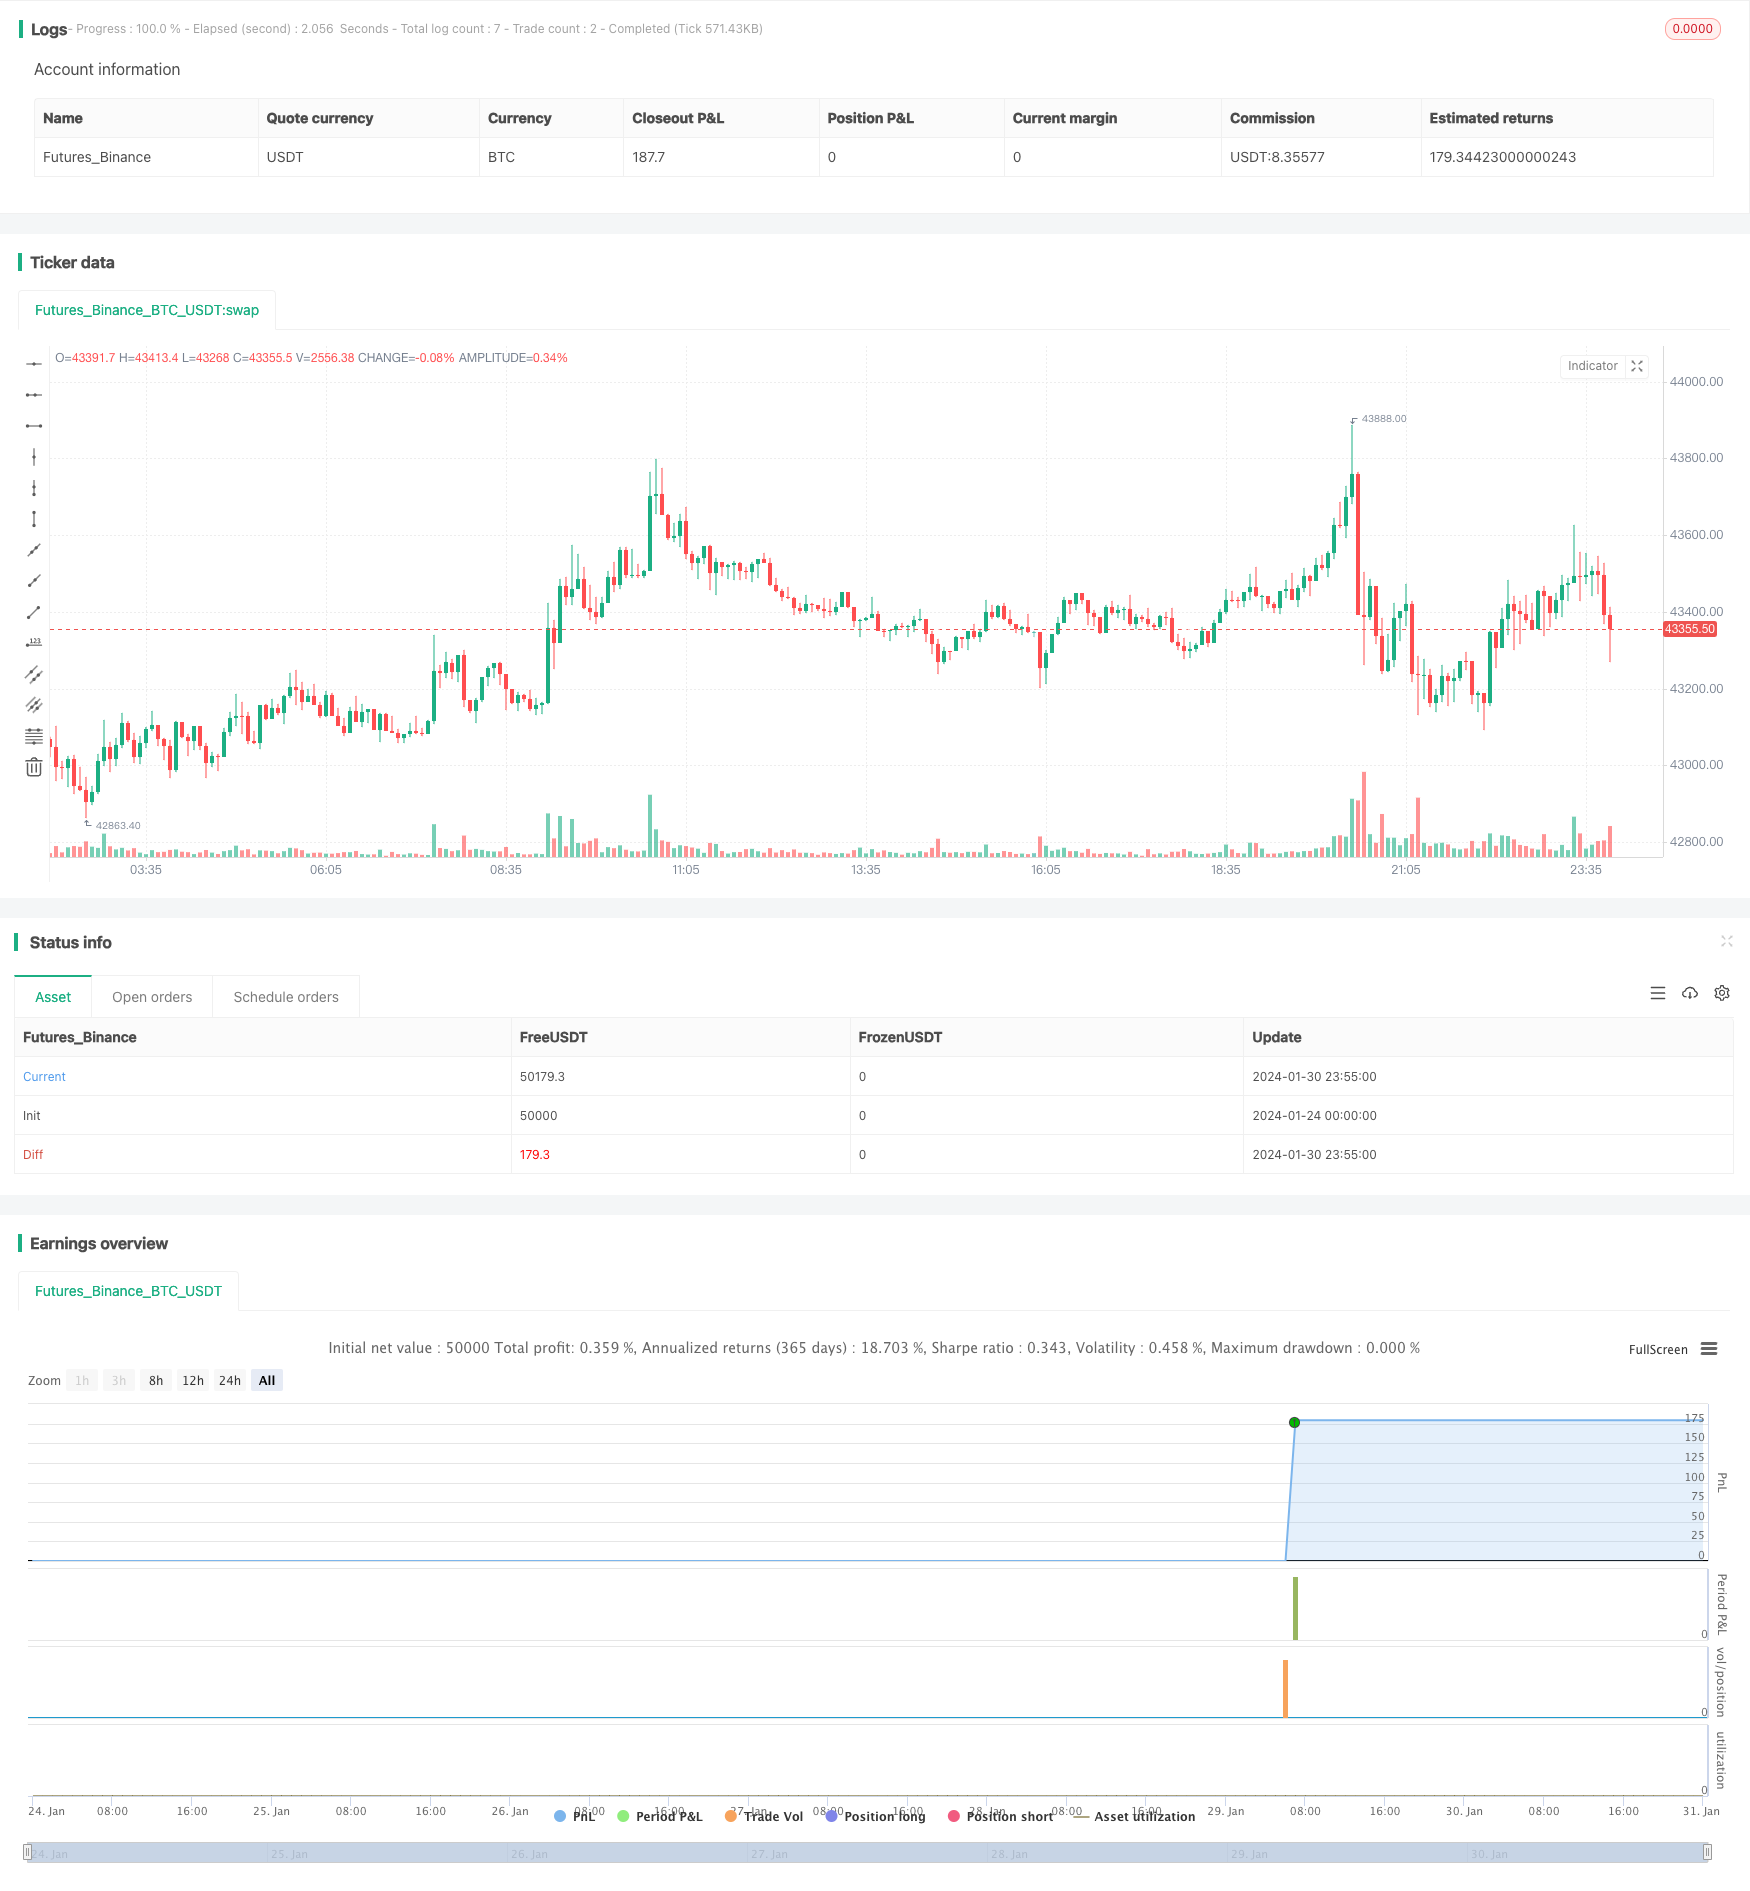
La estrategia utiliza datos de operaciones SPY, combinados con señales de indicadores técnicos como las medias móviles, el MACD y el RSI, para determinar con precisión los movimientos a corto plazo y tomar decisiones de compra y venta para obtener ganancias en operaciones de corto plazo.
Principio de estrategia
La lógica central de la estrategia se basa en los siguientes indicadores técnicos para determinar las tendencias a corto plazo y el momento de entrada:
- Los forks dorados y los forks muertos de los promedios móviles del índice (EMA) del día 5 y 13 se utilizan para determinar la reversión de la tendencia a la volatilidad.
- El indicador MACD determina si hay un movimiento hacia arriba.
- El índice ADX determina si hay una tendencia.
- El RSI es un indicador para determinar la intensidad de una tendencia.
Al optimizar los parámetros de los indicadores anteriores, se determina el punto de inflexión de un polígono clave. Cuando se cumplen 5⁄6 de las condiciones, se muestra una señal blanca que indica L o S, y cuando se cumplen las seis condiciones, se muestra una señal en forma de △ dorado cuando el cuadro se cierra.
Las condiciones para que se forme una señal de compra:
EMA de 5 días es mayor que el EMA de 13 días y la línea MACD es inferior a 0.5 y el ADX es superior a 20 y la pendiente MACD es superior a 0 y la línea de señal es superior a -0.1 y el RSI es superior a 40
Las condiciones para la venta de señales:
EMA de 5 días menor que EMA de 13 días y la línea MACD es superior a -0.5 y el ADX es superior a 20 y la línea de señal es inferior a 0 y la pendiente MACD es inferior a 0 y el RSI es inferior a 60
Análisis de las ventajas
La estrategia tiene las siguientes ventajas:
- La combinación de varias señales de indicadores permite una mayor precisión.
- La sensibilidad y la precisión de los juicios se equilibran a través de la optimización de parámetros.
- La señal es clara y concisa, y el umbral de operación es bajo.
- Aplicable para operaciones de corta duración y de acuerdo con las preferencias de riesgo de la mayoría de los inversores.
- Tenga en cuenta las necesidades operativas del disco duro y evite las altas fluctuaciones en el tiempo de espera.
Análisis de riesgos
La estrategia también tiene los siguientes riesgos:
- La configuración inadecuada de los parámetros puede conducir a un riesgo de error. Se requiere prueba y optimización continuas.
- Una sola variedad no puede diversificar el riesgo de la industria y la asignación de activos.
- El riesgo de deslizamiento y las comisiones de transacción asociadas a las operaciones frecuentes.
- El tiempo de colapsar no puede construir un depósito y puede que se pierda algunas oportunidades.
Dirección de optimización
La estrategia puede seguir optimizándose desde las siguientes dimensiones:
- Modificar la configuración de los parámetros de la prueba para mejorar la precisión de los juicios.
- Aumentar el índice de stop loss para controlar las pérdidas individuales.
- Optimización de los tiempos de apertura de la posición, filtrando los períodos de alta volatilidad en el extremo de cola.
- Aumentar las otras variedades como objetivo estratégico.
- La combinación de algoritmos de aprendizaje automático mejora la capacidad de adaptación de los parámetros.
Resumir
Esta estrategia es muy adecuada para el comercio de línea corta mediante el seguimiento de datos SPY, la combinación de varios indicadores técnicos como promedios móviles, MACD, RSI para determinar tendencias a corto plazo, alta frecuencia de operación, baja reversión. Puede seguir optimizándose desde varias dimensiones, con un gran espacio para mejorar.
/*backtest
start: 2024-01-24 00:00:00
end: 2024-01-31 00:00:00
period: 5m
basePeriod: 1m
exchanges: [{"eid":"Futures_Binance","currency":"BTC_USDT"}]
*/

//@version=5
strategy(title="SPY 1 Minute Day Trader", overlay=true)

//This script has been created to take into account how the following variables impact trend for SPY 1 Minute
//The SPY stop losses/take profit have been set at 30 cents which equates to 15 cents on SPY 1 DTE ATM contracts
//5 ema vs 13 ema : A cross establishes start of trend
//MACD (Line, Signal & Slope) : If you have momentum
//ADX : if you are trending
//RSI : If the trend has strength
//The above has been optimized to determine pivot points in the trend using key values for these 6 indicators
//bounce up = ema5 > ema13 and macdLine < .5 and adx > 20 and macdSlope > 0 and signalLine > -.1 and rsiSignal > 40
//bounce down = ema5 < ema13 and macdLine > -.5 and adx > 20 and signalLine < 0 and macdSlope < 0 and rsiSignal < 60
//White L's indicate that 5 of 6 conditions are met due to impending uptrend w/ missing one in green below it
//Yellow L's indicate that 6 of 6 conditions still are met
//White S's indicate that 5 of 6 conditions are met due to impending downtrend w/ missing condition in red above it
//Yellow S's indicate that 6 of 6 conditions still are met
//After a downtrend or uptrend is established, once it closes it can't repeat for 10 minutes
//Won't open any trades on last two minutes of any hours to avoid volatility
//Will close any open trades going into last minute of hour

// Initialize variables
var float long_entry_price = na
var float short_entry_price = na
var float stop_loss = na
var float take_profit = na
var float short_stop_loss = na
var float short_take_profit = na
var float option_SL = 0.3 //approx 15 cents on SPY 1 DTE
var float option_TP = 0.3 //approx 15 cents on SPY 1 DTE
var long_entry_time = 0
var short_entry_time = 0
var allow_long_entry = true
var allow_short_entry = true
var allow_trades = true
var hourlyclose = 0
var notify = 0
var shortnotify = 0

// Calculate the EMAs & SMAs
ema5 = ta.ema(close, 5)
ema13 = ta.ema(close, 13)
sma20 = ta.sma(close, 20)

// Input parameters
fastLength = input.int(12, minval=1, title="Fast Length")
slowLength = input.int(26, minval=1, title="Slow Length")
signalLength = input.int(9, minval=1, title="Signal Smoothing")

// Inputs
length = input.int(14, "Length")
smoothK = input.int(3, "SmoothK")
src = input(close, "Source")
overbought = input.float(80, "Overbought")
oversold = input.float(20, "Oversold")

//Stochastic Calculation
highestHigh = ta.highest(src, length)
lowestLow = ta.lowest(src, length)
k = 100 * ((src - lowestLow) / (highestHigh - lowestLow))
d = ta.sma(k, smoothK)

// Calculate MACD
[macdLines, signalLines, _] = ta.macd(close, fastLength, slowLength, signalLength)

// Calculate slope of MACD line
macdSlope = (macdLines - macdLines[1]) / (bar_index - bar_index[1])

// Calculate the RSI
rsiValue = ta.rsi(close, 5)

// Calculate the signal line as the SMA of the RSI for 5 minute over 9 periods
rsiSignal = ta.sma(rsiValue, 9)

// Calculate MACD
[macdLine, signalLine, _] = ta.macd(close, 12, 26, 9)

// Length of the ATR
atr_length = input.int(14, title="ATR Length", minval=1)

// Calculate the True Range
tr = ta.tr(true)

// Calculate the ATR
atr = ta.atr(atr_length)

// Length of the ADX
len = input.int(14, minval=1)

// Set minimum number of bars between trades
min_bars_between_trades = 10

// Calculate the Directional Movement
up = ta.change(high)
down = -ta.change(low)
plusDM = na(up) ? na : (up > down and up > 0 ? up : 0)
minusDM = na(down) ? na : (down > up and down > 0 ? down : 0)

// Calculate the Smoothed Directional Movement
plusDI = 100 * ta.ema(plusDM, len) / ta.ema(tr, len)
minusDI = 100 * ta.ema(minusDM, len) / ta.ema(tr, len)

// Calculate the Directional Index (DX)
DX = 100 * math.abs(plusDI - minusDI) / (plusDI + minusDI)

// Calculate the ADX
adx = ta.ema(DX, len)

// Get high, low, and close prices
highPrice = high
lowPrice = low
closePrice = close

// Determine buy and sell signals - Tried to optimize as much as possible - changing these do impact results
buy_signal = ema5 > ema13 and macdLine < .5 and adx > 20 and macdSlope > 0 and signalLine > -.1 and rsiSignal > 40
short_buy_signal = ema5 < ema13 and macdLine > -.5 and adx > 20 and signalLine < 0 and macdSlope < 0 and rsiSignal < 60

// Define long entry conditions
C1 = ema5 > ema13 ? 1 : 0 //E below bar when only one missing
C2 = d < 70 ? 1 : 0 //no longer part of signal - but was Smoothed Stoicastic
C3 = macdLine < .5 ? 1 : 0 //M below bar when only one missing
C4 = adx > 20 ? 1 : 0 //A below bar when only one missing
C5 = macdSlope > 0 ? 1 : 0 //% below bar when only one missing
C6 = signalLine > -.01 ? 1 : 0 //S (MACD Signal) below bar when only one missing
C7 = rsiSignal > 50 ? 1 : 0 //R below bar when only one missing

// Define short entry conditions
C8 = ema5 < ema13 ? 1 : 0 //E above bar when only one missing
C9 = d > 40 ? 1 : 0 //no longer part of signal - but was Smoothed Stoicastic
C10 = macdLine > -0.5 ? 1 : 0 //M above bar when only one missing
C11 = adx > 20 ? 1 : 0 //A above bar when only one missing
C12 = macdSlope < 0 ? 1 : 0 //% above bar when only one missing
C13 = signalLine < 0 ? 1 : 0 //S (MACD Signal) above bar when only one missing
C14 = rsiSignal < 50 ? 1 : 0 //R above bar when only one missing

// Long or Short Incoming denoted by white color and gold means all conditions met
plotchar((C1 + C3 + C4 + C5 + C6 + C7) == 5 ? 1 : na, title="Pivot Up White", char="L", location=location.belowbar, color=color.white, size = size.tiny)
plotchar((C8 + C10 + C11 + C12 + C13 + C14) == 5 ? 1 : na, title="Pivot Down White", char="S", location=location.abovebar, color=color.white, size = size.tiny)
plotchar((C1 + C3 + C4 + C5 + C6 + C7) > 5 ? 1 : na, title="Pivot Up Gold", char="L", location=location.belowbar, color=color.yellow, size = size.tiny)
plotchar((C8 + C10 + C11 + C12 + C13 + C14) > 5 ? 1 : na, title="Pivot Down Gold", char="S", location=location.abovebar, color=color.yellow, size = size.tiny)
plotchar((C1 + C3 + C4 + C5 + C6 + C7) >= 5 and (C1) != 1 ? 1 : na, title="Missing", char = "", text="E", location=location.belowbar, color=color.green, size = size.small)
plotchar((C1 + C3 + C4 + C5 + C6 + C7) >= 5 and (C3) != 1 ? 1 : na, title="Missing", char = "", text="M", location=location.belowbar, color=color.green, size = size.small)
plotchar((C1 + C3 + C4 + C5 + C6 + C7) >= 5 and (C4) != 1 ? 1 : na, title="Missing", char = "", text="A", location=location.belowbar, color=color.green, size = size.small)
plotchar((C1 + C3 + C4 + C5 + C6 + C7) >= 5 and (C5) != 1 ? 1 : na, title="Missing", char = "", text="%", location=location.belowbar, color=color.green, size = size.small)
plotchar((C1 + C3 + C4 + C5 + C6 + C7) >= 5 and (C6) != 1 ? 1 : na, title="Missing", char = "", text="S", location=location.belowbar, color=color.green, size = size.small)
plotchar((C1 + C3 + C4 + C5 + C6 + C7) >= 5 and (C7) != 1 ? 1 : na, title="Missing", char = "", text="R", location=location.belowbar, color=color.green, size = size.small)
plotchar((C8 + C10 + C11 + C12 + C13 + C14) >= 5 and (C8) != 1 ? 1 : na, title="Missing", char = "", text="E", location=location.abovebar, color=color.red, size = size.small)
plotchar((C8 + C10 + C11 + C12 + C13 + C14) >= 5 and (C10) != 1 ? 1 : na, title="Missing", char = "", text="M", location=location.abovebar, color=color.red, size = size.small)
plotchar((C8 + C10 + C11 + C12 + C13 + C14) >= 5 and (C11) != 1 ? 1 : na, title="Missing", char = "", text="A", location=location.abovebar, color=color.red, size = size.small)
plotchar((C8 + C10 + C11 + C12 + C13 + C14) >= 5 and (C12) != 1 ? 1 : na, title="Missing", char = "", text="%", location=location.abovebar, color=color.red, size = size.small)
plotchar((C8 + C10 + C11 + C12 + C13 + C14) >= 5 and (C13) != 1 ? 1 : na, title="Missing", char = "", text="S", location=location.abovebar, color=color.red, size = size.small)
plotchar((C8 + C10 + C11 + C12 + C13 + C14) >= 5 and (C14) != 1 ? 1 : na, title="Missing", char = "", text="R", location=location.abovebar, color=color.red, size = size.small)

// Execute buy and sell orders
if buy_signal and allow_trades and allow_long_entry  //Don't buy on last 2 minutes of hour
    long_entry_price := open
    strategy.entry("Pivot Up", strategy.long)
    stop_loss := long_entry_price - option_SL
    take_profit := long_entry_price + option_TP
    long_entry_time := time
    allow_long_entry := false
    allow_trades := false
    notify := 1
plotshape(notify == 1 ? 1 : na, "Pivot Up", style=shape.triangleup, offset = 1, location=location.belowbar, size=size.normal, textcolor = color.orange, color=color.orange)
if notify == 1
    notify := notify - 1

if short_buy_signal and allow_trades and allow_short_entry  //Don't buy on last 2 minutes of hour
    short_entry_price := open
    strategy.entry("Pivot Down", strategy.short)
    short_stop_loss := short_entry_price + option_SL
    short_take_profit := short_entry_price - option_TP
    short_entry_time := time
    allow_short_entry := false
    allow_trades := false
    shortnotify := 1
plotshape(shortnotify == 1 ? 1 : na, "Pivot Down", style=shape.triangledown, offset = 1, location=location.abovebar, size=size.normal, textcolor = color.orange, color=color.orange)
if shortnotify == 1
    shortnotify := shortnotify - 1

// Take scalp when in a position and 5 or more parameters are met!
if strategy.position_size != 0 and (C1 + C3 + C4 + C5 + C6 + C7) >5
    strategy.exit("Exit Longs", "Pivot Up", stop=stop_loss, limit = take_profit)
else if strategy.position_size != 0 and (C8 + C10 + C11 + C12 + C13 + C14) >5
    strategy.exit("Exit Shorts", "Pivot Down", stop=short_stop_loss, limit = short_take_profit)

// Reset allow_trades after cool-down period of min_bars_between_trades bars set above
if time > long_entry_time + (time - time[1]) * min_bars_between_trades
    allow_long_entry := true
    allow_trades := true

if time > short_entry_time + (time - time[1]) * min_bars_between_trades
    allow_short_entry := true
    allow_trades := true

// Close all positions at the end of the trading day and when volatile hours approach!
if  strategy.position_size != 0
    strategy.close("Pivot Up")
    strategy.close("Pivot Down")
    hourlyclose := 1
plotshape(hourlyclose == 1 ? 1 : na, "Suggested Volatile Hour Close", text="Suggested Volatile Hour Close", offset = 1, style=shape.triangledown, location=location.abovebar, size=size.tiny, textcolor = color.orange, color=color.orange)
if hourlyclose == 1
    hourlyclose := hourlyclose - 1