Estrategia de seguimiento de stop loss con canal de precios dinámico
Descripción general
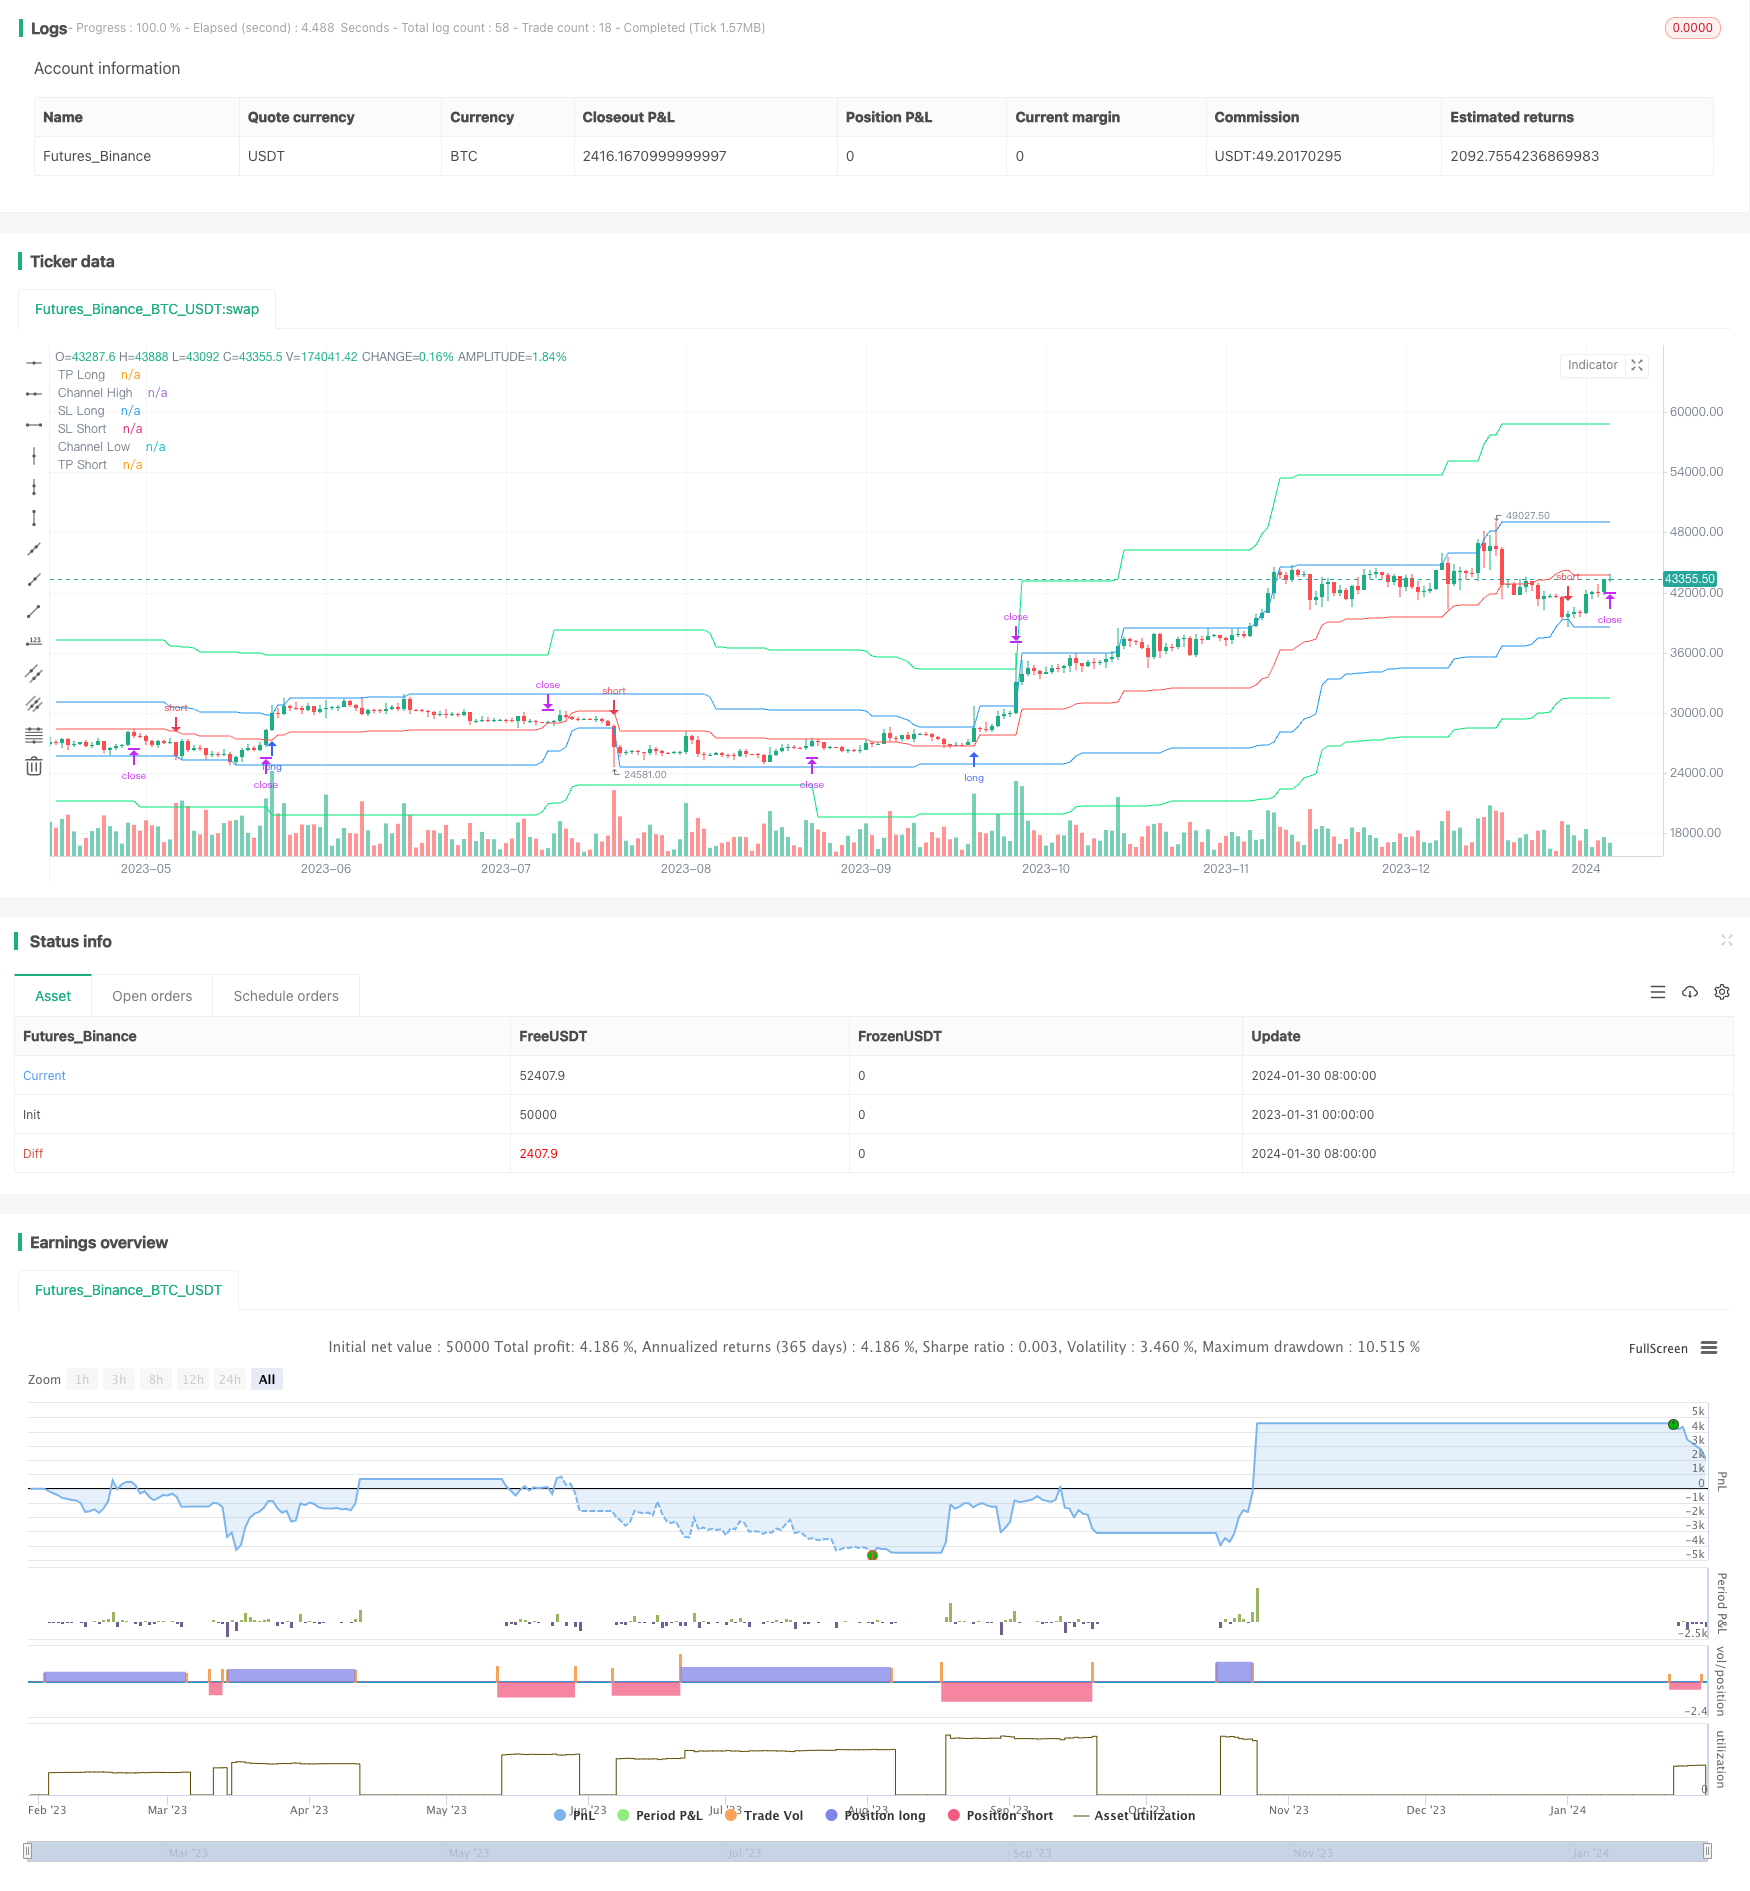
Esta estrategia se basa en el desarrollo del indicador de canal de precios de Donchian. El indicador forma un canal de precios calculando los precios más altos y más bajos en un determinado período. La estrategia utiliza el canal de precios para realizar operaciones bidireccionales y establece un precio de stop loss y stop.
Principio de estrategia
En primer lugar, la estrategia calcula el límite superior h y el límite inferior l del canal de precios de acuerdo con el parámetro pclen. El centro de la línea media es el límite superior inferior del canal de precios. Luego, se calcula el precio de parada tpl y tps de acuerdo con los parámetros de parada tp de la posición larga y la posición vacía. El precio de parada se fija en el centro de la línea media del canal de precios.
La lógica de la transacción es la siguiente:
Señales de apertura de posición: el precio es mayor que el límite superior de la entrada h y se abre una posición cuando se retrocede dentro de la entrada Señales de posición baja: cuando el precio está por debajo del centro de la línea media del canal (stop loss) o por encima del precio de parada (stop loss)
Señales de vacío: precios por debajo del límite inferior del canal y retroceden al canal cuando se abre el canal Señales de posición cerrada: cuando el precio está por encima del centro de la línea media del canal (stop loss) o por debajo del precio de parada (stop price tps)
Análisis de las ventajas
La estrategia tiene las siguientes ventajas:
- El comercio bidireccional puede capturar el cambio de tendencia de los precios
- Utilice el canal de precios para determinar la dirección de la tendencia y evitar falsos saltos
- Establezca un alto para detener el daño y controle el riesgo
- Calcular el tamaño de la posición asociado al tamaño del riesgo para lograr que el riesgo sea controlado
- La implementación de un seguimiento de paradas y pérdidas para bloquear más ganancias
Análisis de riesgos
La estrategia también tiene ciertos riesgos:
- La configuración incorrecta de los parámetros del canal de precios puede causar una frecuencia de transacción excesiva o una oportunidad de negociación perdida
- La tolerancia excesiva en los precios de parada puede aumentar la brecha de riesgo
- El bloqueo de seguimiento puede activarse antes de tiempo en períodos de alta volatilidad
Estos riesgos pueden ser reducidos y controlados mediante ajustes de parámetros y monitoreo manual.
Dirección de optimización
La estrategia también puede ser optimizada en los siguientes aspectos:
- Aumentar el número de indicadores para evaluar los filtros y evitar la apertura frecuente de posiciones cerradas en situaciones de crisis
- Se pueden probar diferentes algoritmos de stop loss, como el stop loss ATR y otros.
- Extensión a un sistema de negociación a través de períodos de tiempo, utilizando períodos de tiempo más avanzados para determinar la dirección de la tendencia
- Agrega un módulo de administración de posiciones para ajustar las posiciones según el uso de los fondos
- Combinando modelos de aprendizaje automático para determinar la tasa de éxito de las rupturas de precios y evitar las falsas rupturas
Resumir
En general, esta estrategia es una forma eficaz de realizar operaciones bidireccionales utilizando indicadores de canal de precios. Con el módulo de control de stop loss y posición, el riesgo se puede controlar muy bien. Con cierta optimización y ajuste, puede convertirse en una estrategia de comercio cuantitativa de gran alcance.
/*backtest
start: 2023-01-31 00:00:00
end: 2024-01-31 00:00:00
period: 1d
basePeriod: 1h
exchanges: [{"eid":"Futures_Binance","currency":"BTC_USDT"}]
*/

//Noro
//2020

//@version=4
strategy(title = "Noro's RiskDonchian Strategy", shorttitle = "RiskDonchian str", overlay = true, default_qty_type = strategy.percent_of_equity, initial_capital = 100, default_qty_value = 100, commission_value = 0.1)

//Settings
needlong = input(true, defval = true, title = "Long")
needshort = input(true, defval = true, title = "Short")
tp = input(defval = 20.0, minval = 1, title = "Take-profit, %")
tptype = input(defval = "2. Fix", options = ["1. None", "2. Fix", "3. Trailing"], title = "Take-profit type")
sltype = input(defval = "2. Center", options = ["1. None", "2. Center"], title = "Take-profit type")
risklong  = input(5.0, minval = 0.0, maxval = 99.9, title = "Risk size for long, %")
riskshort = input(5.0, minval = 0.0, maxval = 99.9, title = "Risk size for short, %")
pclen = input(50, minval = 1, title = "Price Channel Length")
showll = input(true, defval = true, title = "Show lines")
showbg = input(false, defval = false, title = "Show Background")
showof = input(true, defval = true, title = "Show Offset")
showlabel = input(true, defval = true, title = "Show label")
fromyear = input(1900, defval = 1900, minval = 1900, maxval = 2100, title = "From Year")
toyear = input(2100, defval = 2100, minval = 1900, maxval = 2100, title = "To Year")
frommonth = input(01, defval = 01, minval = 01, maxval = 12, title = "From Month")
tomonth = input(12, defval = 12, minval = 01, maxval = 12, title = "To Month")
fromday = input(01, defval = 01, minval = 01, maxval = 31, title = "From day")
today = input(31, defval = 31, minval = 01, maxval = 31, title = "To day")

//Price Channel
h = highest(high, pclen)
l = lowest(low, pclen)
center = (h + l) / 2

//Take-profit
tpl = 0.0
tpl := tptype == "2. Fix" and strategy.position_size > 0 ? tpl[1] : h * (100 + tp) / 100

//Stop-loss
tps = 0.0
tps := tptype == "2. Fix" and strategy.position_size < 0 ? tps[1] : l * (100 - tp) / 100

//Lines
tplcol = showll and needlong and tptype != "1. None" ? color.lime : na
pclcol = showll and needlong ? color.blue : na
sllcol = showll and needlong and sltype != "1. None" ? color.red : na
tpscol = showll and needshort and tptype != "1. None" ? color.lime : na
pcscol = showll and needshort ? color.blue : na
slscol = showll and needshort and sltype != "1. None" ? color.red : na
offset = showof ? 1 : 0
plot(tpl, offset = offset, color = tplcol, title = "TP Long")
plot(h, offset = offset, color = pclcol, title = "Channel High")
plot(center, offset = offset, color = sllcol, title = "SL Long")
plot(center, offset = offset, color = slscol, title = "SL Short")
plot(l, offset = offset, color = pcscol, title = "Channel Low")
plot(tps, offset = offset, color = tpscol, title = "TP Short")

//Background
size = strategy.position_size
bgcol = showbg == false ? na : size > 0 ? color.lime : size < 0 ? color.red : na
bgcolor(bgcol, transp = 70)

//Lot size
risksizelong = -1 * risklong
risklonga = ((center / h) - 1) * 100
coeflong = abs(risksizelong / risklonga)
lotlong = (strategy.equity / close) * coeflong
risksizeshort = -1 * riskshort
riskshorta = ((center / l) - 1) * 100
coefshort = abs(risksizeshort / riskshorta)
lotshort = (strategy.equity / close) * coefshort

//Trading
truetime = time > timestamp(fromyear, frommonth, fromday, 00, 00) and time < timestamp(toyear, tomonth, today, 23, 59)
mo = 0
mo := strategy.position_size != 0 ? 0 : high >= center[1] and low <= center[1] ? 1 : mo[1]

if h > 0
    longlimit = tptype == "1. None" ? na : tpl
    longstop = sltype == "1. None" ? na : center
    strategy.entry("Long", strategy.long, lotlong, stop = h, when = strategy.position_size <= 0 and needlong and truetime and mo)
    strategy.exit("TP Long", "Long", limit = longlimit, stop = longstop)
    shortlimit = tptype == "1. None" ? na : tps
    shortstop = sltype == "1. None" ? na : center
    strategy.entry("Short", strategy.short, lotshort, stop = l, when = strategy.position_size >= 0 and needshort and truetime and mo)
    strategy.exit("Exit Short", "Short", limit = shortlimit, stop = shortstop)
if time > timestamp(toyear, tomonth, today, 23, 59)
    strategy.close_all()
    strategy.cancel("Long")
    strategy.cancel("Short")

if showlabel

    //Drawdown
    max = 0.0
    max := max(strategy.equity, nz(max[1]))
    dd = (strategy.equity / max - 1) * 100
    min = 100.0
    min := min(dd, nz(min[1]))

    //Label
    min := round(min * 100) / 100
    labeltext = "Drawdown: " + tostring(min) + "%"
    var label la = na
    label.delete(la)
    tc = min > -100 ? color.white : color.red
    osx = timenow + round(change(time)*10)
    osy = highest(100)