Estrategia de reversión de stop siguiendo tendencia
Descripción general
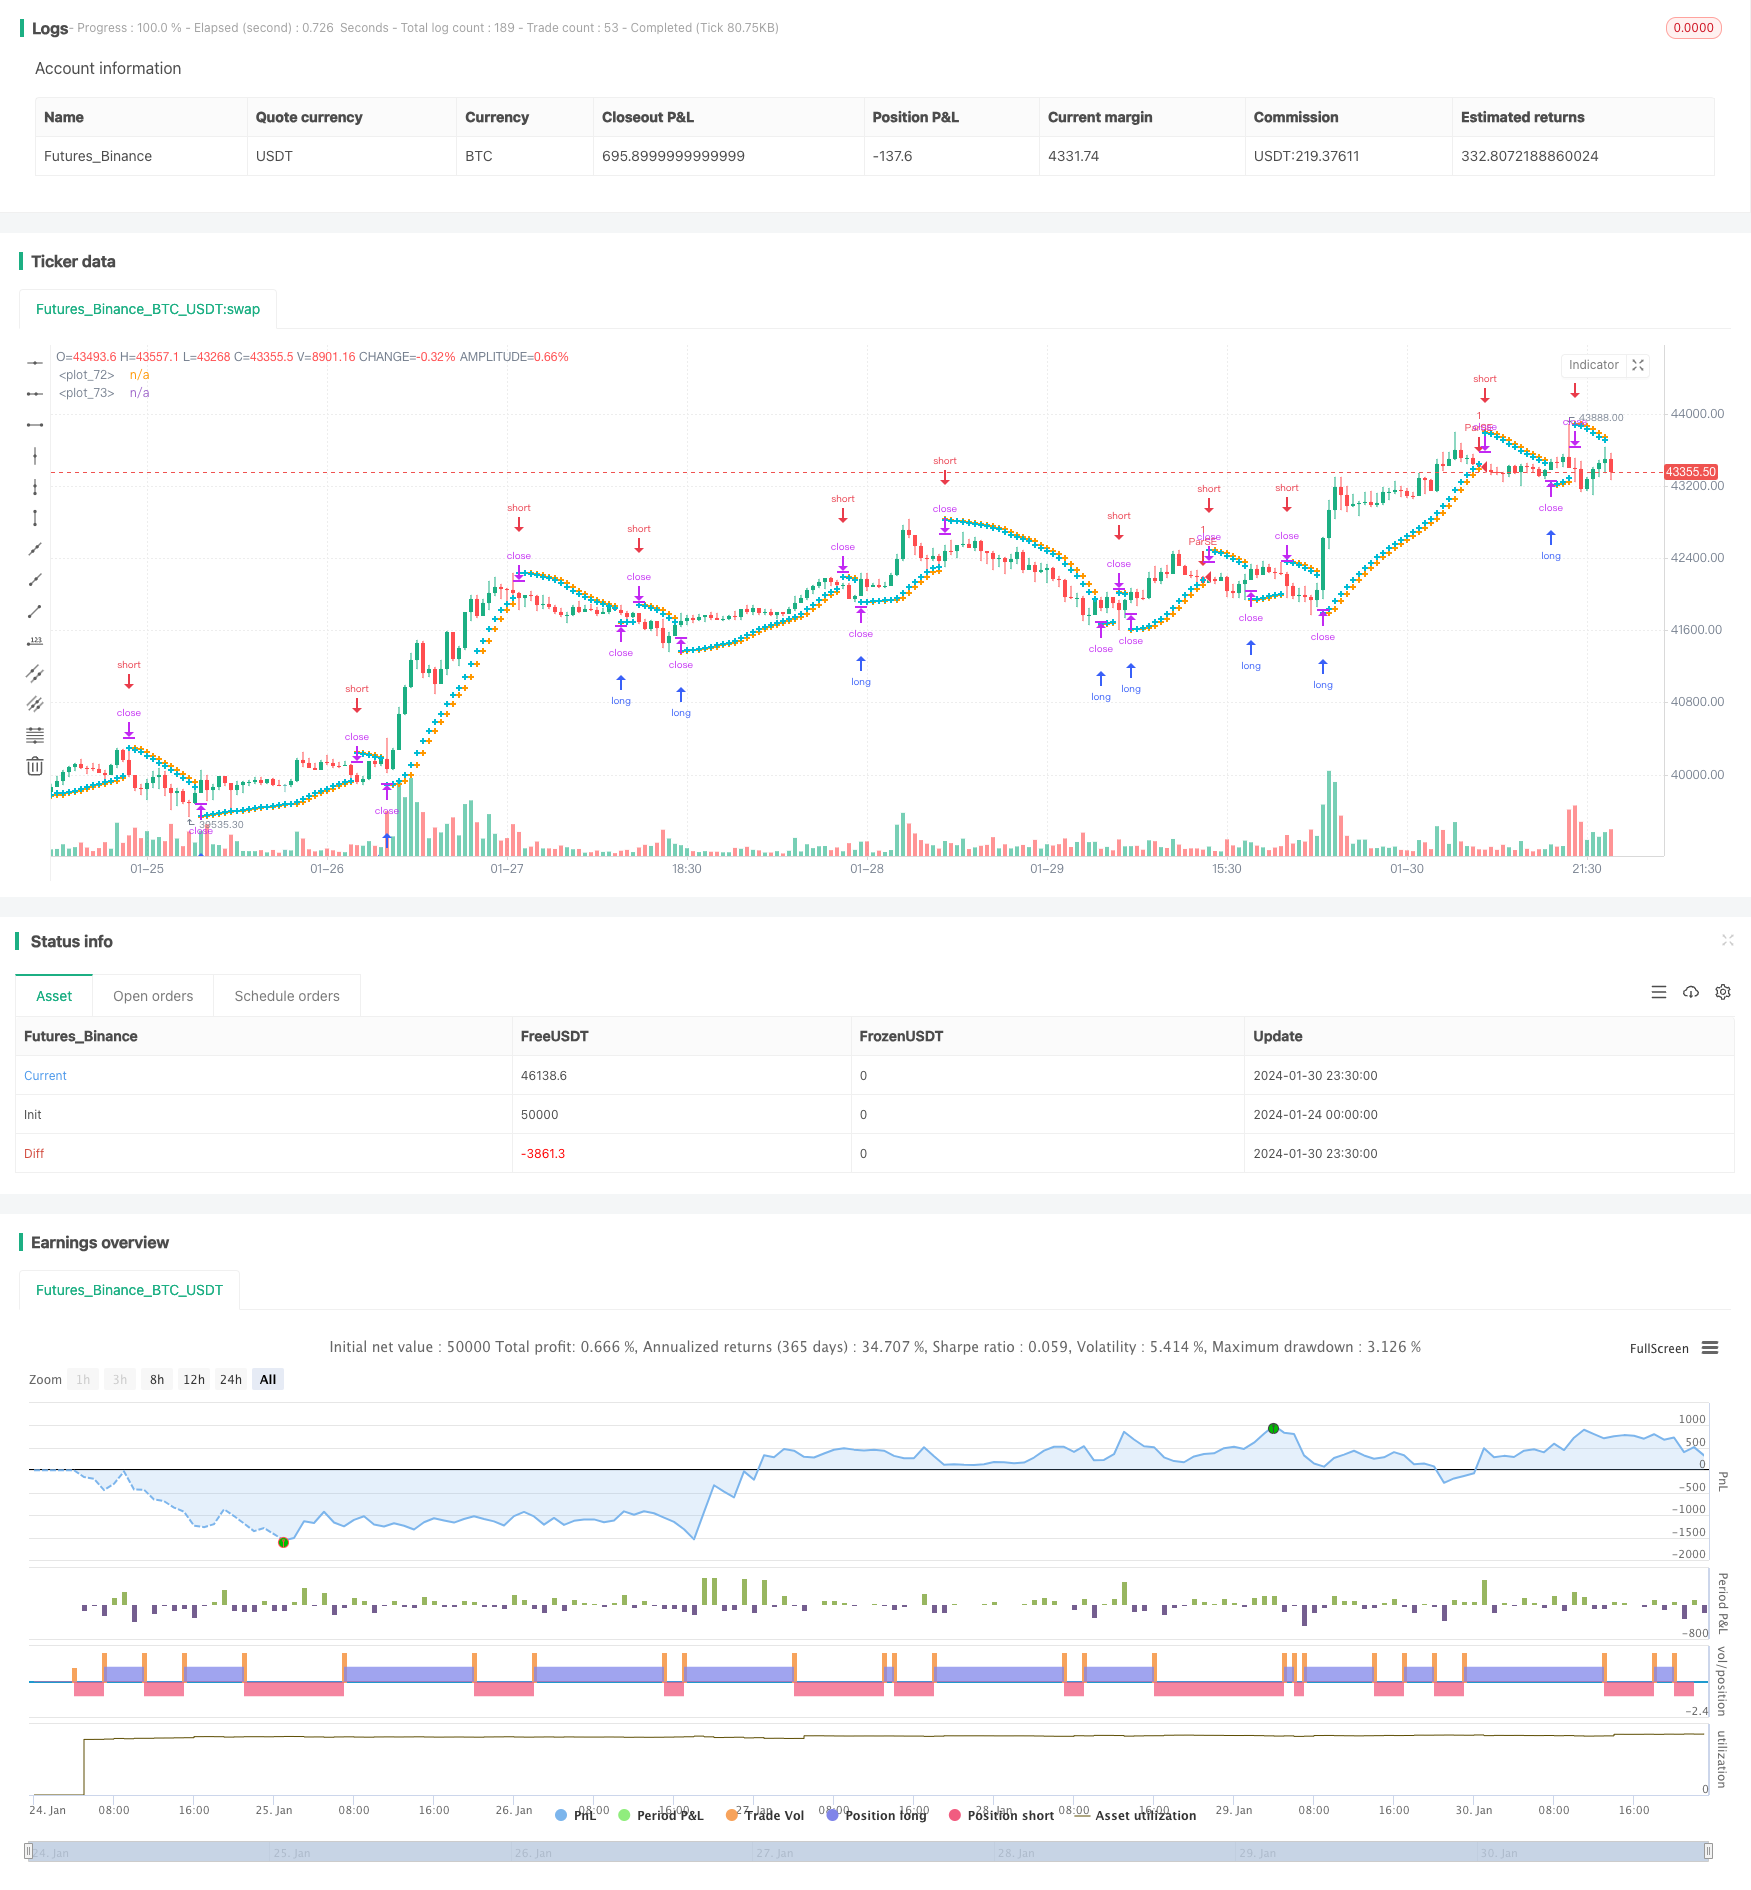
La estrategia de reversión de pérdidas de seguimiento de tendencias es una estrategia que utiliza el indicador Parabolic SAR para identificar tendencias y entrar en posiciones de reversión cuando las tendencias se revierten. La estrategia combina un mecanismo de stop loss y stop loss para controlar el riesgo.
Principio de estrategia
La estrategia utiliza el indicador Parabolic SAR para juzgar la tendencia actual del mercado. El nombre completo de Parabolic SAR es Parabolic Stop and Reverse, que indica que la línea de parálisis se detiene y se invierte. Su línea de indicador se parece a una serie de líneas de parálisis en el gráfico de precios, y estos puntos de parálisis representan posibles puntos de reversión.
Cuando el SAR desciende y está por debajo del precio, representa una tendencia alcista; cuando el SAR sube y está por encima del precio, representa una tendencia bajista. La estrategia consiste en determinar la dirección de la tendencia actual en función de la posición del SAR.
Concretamente, la estrategia se abre cuando el SAR está en tendencia ascendente y por encima del precio; la estrategia se abre cuando el SAR está en tendencia descendente y por debajo del precio. Es decir, se entra en una posición inversa cuando el SAR muestra una reversión de la tendencia.
Además, la estrategia también tiene un mecanismo de stop loss y stop stop. Si se hace en exceso, es posible establecer un precio de stop loss para limitar las pérdidas; al mismo tiempo, es posible establecer un precio de stop stop para liquidar la posición después de que el precio alcance un determinado objetivo de ganancias.
Análisis de las ventajas
La estrategia, combinada con indicadores de tendencia y mecanismos de stop loss/stop loss, tiene las siguientes ventajas principales:
- La capacidad de captar oportunamente la oportunidad de invertir la tendencia y realizar operaciones de reversión.
- Con los paros de pérdidas y los paros, se puede controlar activamente el riesgo y la ganancia.
- El SAR parabólico es un indicador de reversión de tendencia bastante común y de mejor eficacia.
- Las reglas de la estrategia son simples, claras, fáciles de entender y de implementar.
Análisis de riesgos
La estrategia también tiene algunos riesgos a tener en cuenta:
- El indicador Parabolic SAR no es perfecto y a veces emite una señal errónea.
- La fijación de un precio de stop loss o stop stop debe ser razonable, de lo contrario puede ser prematuro.
- Las comisiones de transacción también afectan a los beneficios finales.
- El nuevo trendlengthening tras la reversión puede ser más breve.
Para estos riesgos, se puede ajustar la optimización de los parámetros, o en colaboración con otros indicadores de filtración.
Dirección de optimización
La estrategia puede ser optimizada en las siguientes direcciones:
- Optimización de los parámetros de Parabolic SAR para encontrar la combinación óptima de parámetros.
- Prueba diferentes estrategias de detención de pérdidas, como la detención de pérdidas de seguimiento.
- Añadir indicadores o condiciones para filtrar las señales de inversión.
- Añadir un control de posición para ampliar o reducir la posición según las condiciones del mercado.
- Parámetros de ajuste para las diferentes variedades de transacción.
Resumir
La estrategia de seguimiento de tendencias para detener el cambio de tendencia es una estrategia de negociación más clásica en general. Tiene la función de identificar el cambio de tendencia, al tiempo que ayuda a controlar el riesgo con medidas de detener y detener.
/*backtest
start: 2024-01-24 00:00:00
end: 2024-01-31 00:00:00
period: 30m
basePeriod: 15m
exchanges: [{"eid":"Futures_Binance","currency":"BTC_USDT"}]
*/

//@version=4
strategy("Parabolic SAR Strategy", overlay=true)
start = input(0.02)
increment = input(0.02)
maximum = input(0.2)
var bool uptrend = na
var float EP = na
var float SAR = na
var float AF = start
var float nextBarSAR = na
if bar_index > 0
	firstTrendBar = false
	SAR := nextBarSAR
	if bar_index == 1
		float prevSAR = na
		float prevEP = na
		lowPrev = low[1]
		highPrev = high[1]
		closeCur = close
		closePrev = close[1]
		if closeCur > closePrev
			uptrend := true
			EP := high
			prevSAR := lowPrev
			prevEP := high
		else
			uptrend := false
			EP := low
			prevSAR := highPrev
			prevEP := low
		firstTrendBar := true
		SAR := prevSAR + start * (prevEP - prevSAR)
	if uptrend
		if SAR > low
			firstTrendBar := true
			uptrend := false
			SAR := max(EP, high)
			EP := low
			AF := start
	else
		if SAR < high
			firstTrendBar := true
			uptrend := true
			SAR := min(EP, low)
			EP := high
			AF := start
	if not firstTrendBar
		if uptrend
			if high > EP
				EP := high
				AF := min(AF + increment, maximum)
		else
			if low < EP
				EP := low
				AF := min(AF + increment, maximum)
	if uptrend
		SAR := min(SAR, low[1])
		if bar_index > 1
			SAR := min(SAR, low[2])
	else
		SAR := max(SAR, high[1])
		if bar_index > 1
			SAR := max(SAR, high[2])
	nextBarSAR := SAR + AF * (EP - SAR)
	if barstate.isconfirmed
		if uptrend
			strategy.entry("ParSE", strategy.short, stop=nextBarSAR, comment="ParSE")
			strategy.cancel("ParLE")
		else
			strategy.entry("ParLE", strategy.long, stop=nextBarSAR, comment="ParLE")
			strategy.cancel("ParSE")
plot(SAR, style=plot.style_cross, linewidth=3, color=color.orange)
plot(nextBarSAR, style=plot.style_cross, linewidth=3, color=color.aqua)
//Stop Loss Inputs
use_short_stop_loss = input(false, title="Short Stop Loss", group="Stop Loss and Take Profit", inline="Short_SL")
short_stop_loss = input(title="(%)", type=input.float, minval=0.0, step=0.1,
     defval=5, group="Stop Loss and Take Profit", inline="Short_SL") * 0.01
use_long_stop_loss = input(false, title="Long Stop Loss", group="Stop Loss and Take Profit", inline="Long_SL")
long_stop_loss = input(title="(%)", type=input.float, minval=0.0, step=0.1,
     defval=5, group="Stop Loss and Take Profit", inline="Long_SL") * 0.01

//Take Profit Inputs
use_short_take_profit = input(false, title="Short Take Profit", group="Stop Loss and Take Profit", inline="Short_TP")
short_take_profit = input(title="(%)", type=input.float, minval=0.0, step=0.1,
     defval = 20, group="Stop Loss and Take Profit", inline="Short_TP") * .01
use_long_take_profit = input(false, title="Long Take Profit", group="Stop Loss and Take Profit", inline="Long_TP")
long_take_profit = input(title="(%)", type=input.float, minval=0.0, step=0.1,
     defval = 20, group="Stop Loss and Take Profit", inline="Long_TP") * .01


longStopPrice  = strategy.position_avg_price * (1 - long_stop_loss)
shortStopPrice = strategy.position_avg_price * (1 + short_stop_loss)
longLimitPrice = strategy.position_avg_price * (1 + long_take_profit)
shortLimitPrice = strategy.position_avg_price * (1 - short_take_profit)


if (strategy.position_size > 0.0)
    if (use_long_stop_loss and not use_long_take_profit)
        strategy.exit("Long", stop = longStopPrice)
    if (use_long_take_profit and not use_long_stop_loss)
        strategy.exit("Long", limit = longLimitPrice)
    if (use_long_take_profit and use_long_stop_loss)
        strategy.exit("Long", stop = longStopPrice, limit=longLimitPrice)
if (strategy.position_size < 0.0)
    if (use_short_stop_loss and not use_short_take_profit)
        strategy.exit("Short", stop = shortStopPrice)
    if (use_short_take_profit and not use_short_stop_loss)
        strategy.exit("Short", limit = shortLimitPrice)
    if (use_short_take_profit and use_short_stop_loss)
        strategy.exit("Short", stop = shortStopPrice, limit = shortLimitPrice)

//plot(strategy.equity, title="equity", color=color.red, linewidth=2, style=plot.style_areabr)