Estrategia de trading cuantitativo de media móvil doble
Descripción general
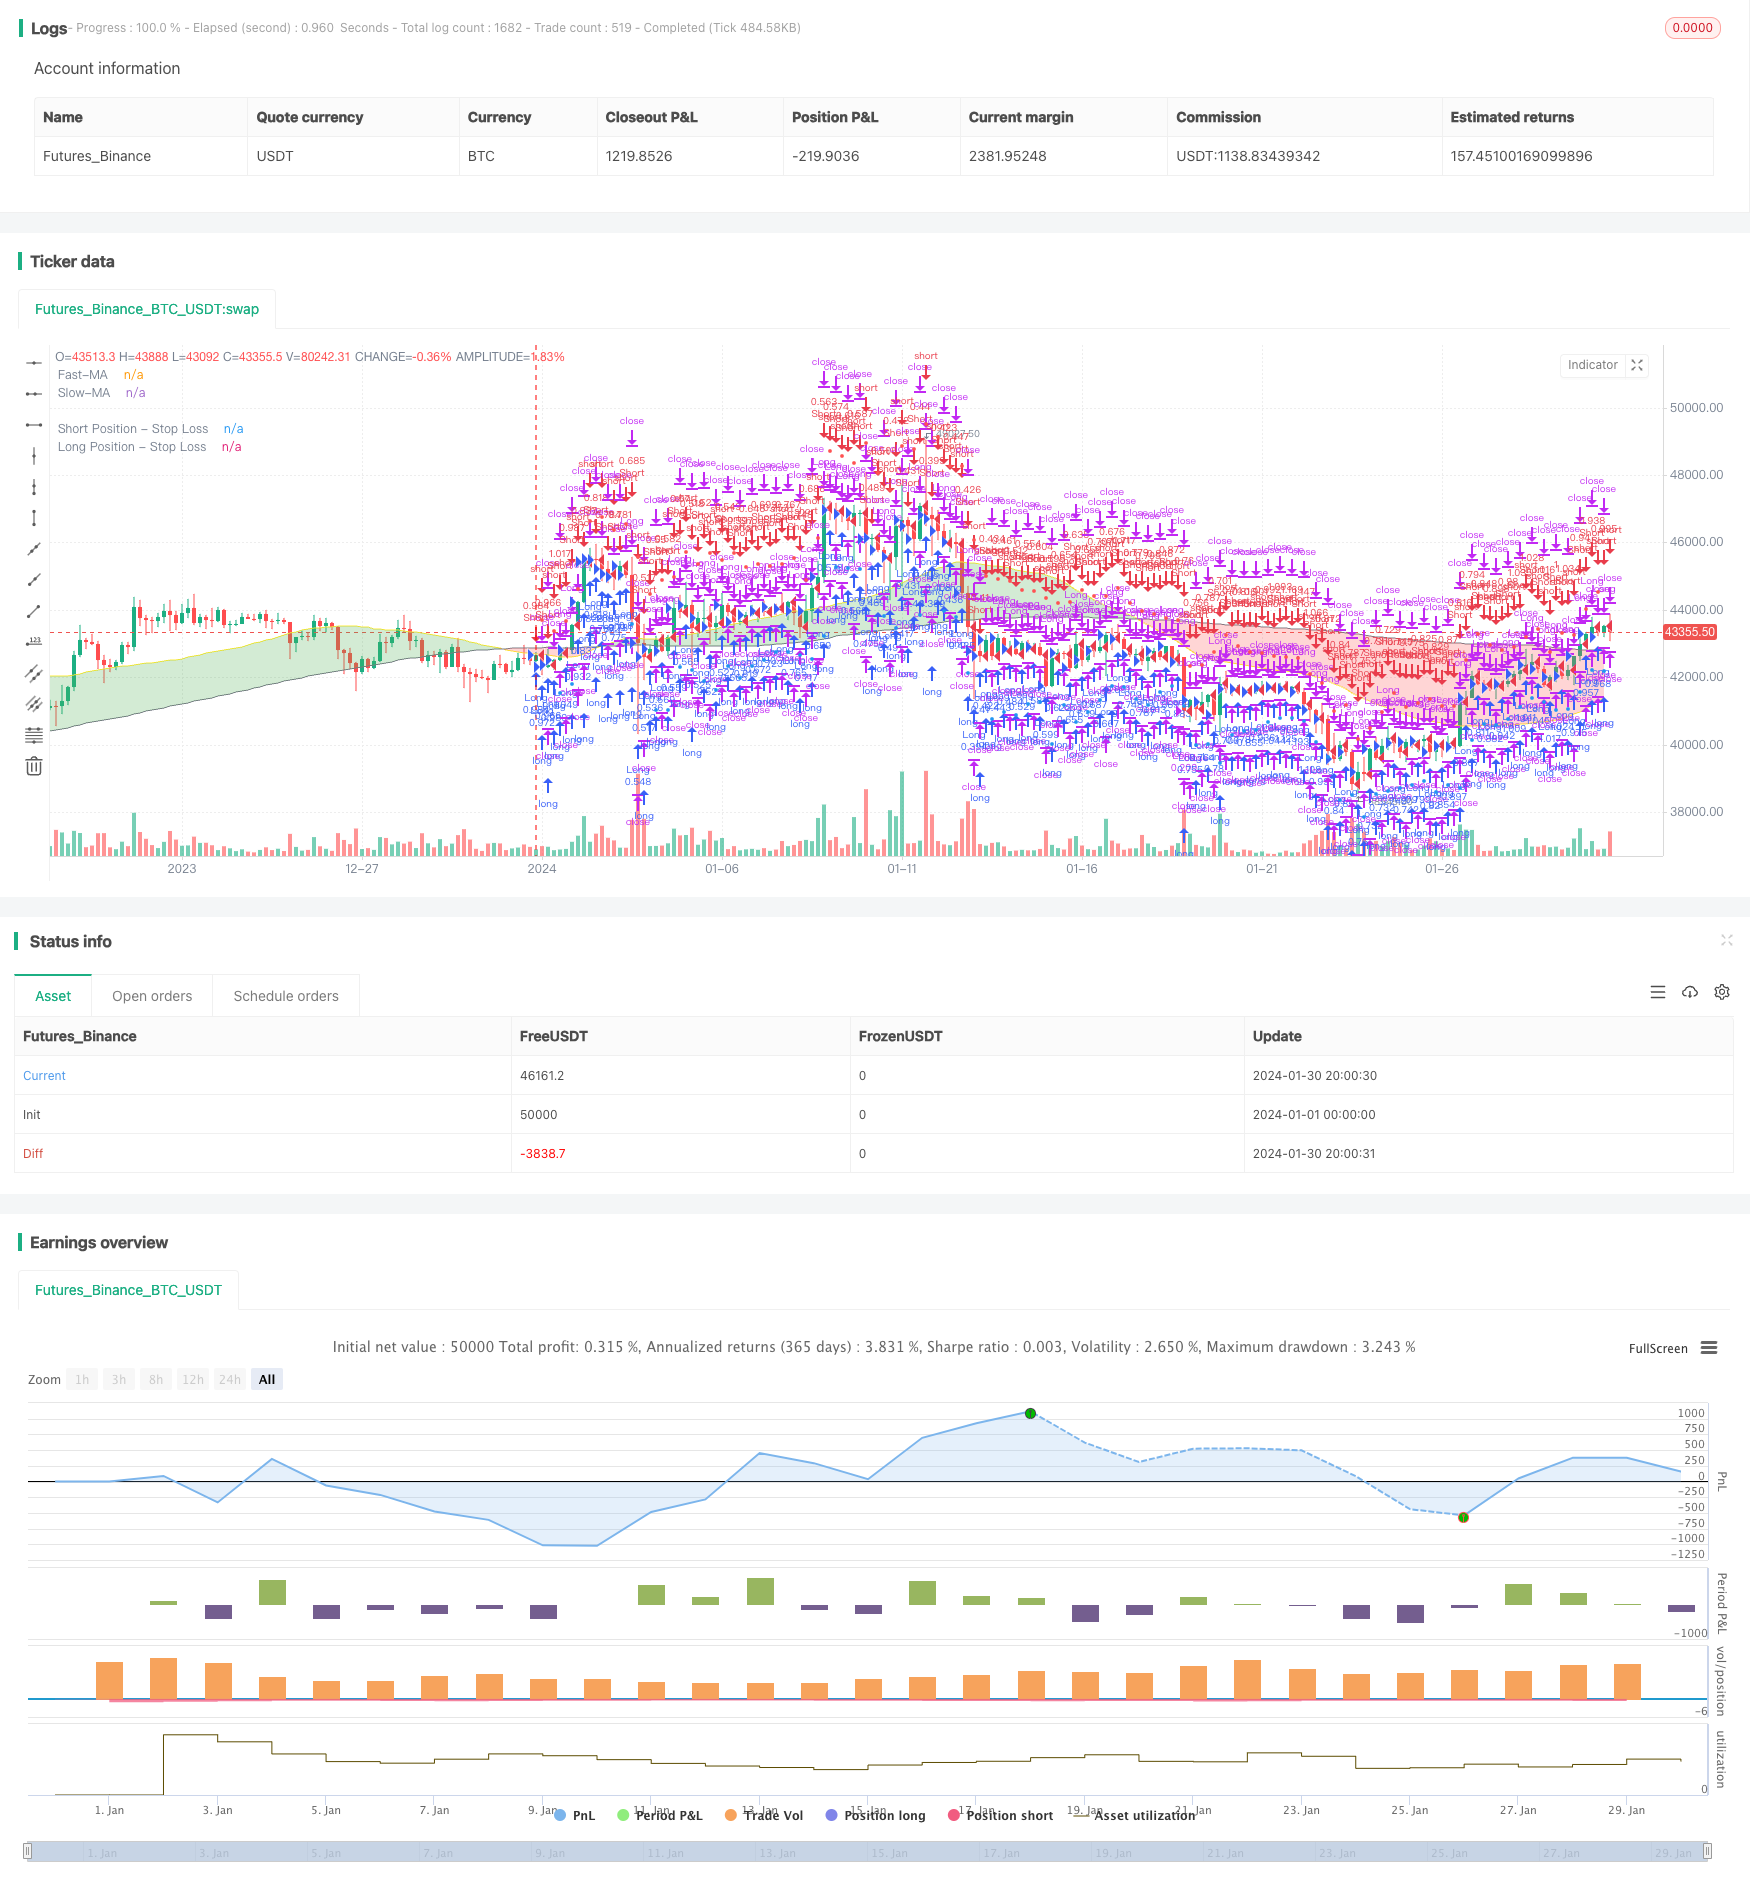
Esta estrategia es un tipo de estrategia de seguimiento de tendencias mediante el cálculo de promedios móviles rápidos y promedios móviles lentos, y en combinación con un indicador de la línea de parálisis. Haga más cuando atraviesa una media móvil lenta sobre una media móvil rápida y haga vacío cuando atraviesa una media móvil lenta por debajo de una media móvil rápida.
Principio de estrategia
- Calcula las medias móviles rápidas y las medias móviles lentas. Los parámetros de las medias móviles se pueden personalizar.
- Comparación de dos medias móviles para determinar la dirección de la tendencia del mercado. Cuando la media móvil rápida cruza la media móvil lenta, se considera un mercado de múltiples cabezas; cuando la media móvil rápida cruza la media móvil lenta, se considera un mercado de cabezas vacías.
- La combinación de la relación entre el precio de cierre y el promedio móvil sirve como confirmación adicional. La señal de compra se genera solo cuando la línea rápida atraviesa la línea lenta y el precio de cierre es superior a la línea rápida; la señal de venta se genera solo cuando la línea rápida atraviesa la línea lenta y el precio de cierre es inferior a la línea rápida.
- El uso de la línea de parallaje para filtrar brechas falsas. La señal de compra se produce solo cuando la línea rápida atraviesa la línea lenta y el precio de cierre es superior a la línea rápida y el precio de la acción es superior a la línea de parallaje; y viceversa.
- Establecer un límite de pérdidas basado en la pérdida máxima soportada. Calcular el precio de parada específico en combinación con el indicador ATR
Ventajas estratégicas
- Utilice las medias móviles para determinar la dirección de las tendencias del mercado y evite las operaciones frecuentes en el mercado de liquidación sin una dirección clara
- Las condiciones de doble filtración evitan con eficacia los problemas comunes de brechas falsas
- Estrategias de control de pérdidas individuales combinadas con el control de pérdidas
Riesgo estratégico
- Las estrategias de indicadores son propensas a generar falsas señales
- No tiene en cuenta el riesgo monetario
- La situación puede haberse perdido en las primeras etapas.
Para responder a estas preguntas, se puede optimizar en los siguientes aspectos:
- Optimización de los parámetros de las medias móviles para adaptarlos a las variedades específicas
- Se puede combinar con otros indicadores o modelos para filtrar la señal
- Tener en cuenta el riesgo monetario de la cobertura en tiempo real o la conversión automática de la cuenta del corredor
Dirección de optimización
- Optimizar los parámetros de las medias móviles para capturar mejor las tendencias
- Aumento de la gama de modelos para mejorar la precisión de la señal
- Verificación de múltiples ciclos de tiempo para evitar ser engañados
- Optimización de las estrategias de detención de pérdidas y mejora de la estabilidad de las estrategias
Resumir
Esta estrategia es una estrategia típica de seguimiento de tendencias de dos medias móviles y una combinación de indicadores. Para juzgar la tendencia del mercado, compara la dirección de las dos medias móviles de manera más rápida y lenta; y en combinación con varios indicadores de filtración, evita falsas señales, lo que genera una señal de negociación. Al mismo tiempo, la estrategia tiene una función de stop loss para controlar las pérdidas individuales.
/*backtest
start: 2024-01-01 00:00:00
end: 2024-01-31 00:00:00
period: 4h
basePeriod: 15m
exchanges: [{"eid":"Futures_Binance","currency":"BTC_USDT"}]
*/

// This source code is subject to the terms of the Mozilla Public License 2.0 at https://mozilla.org/MPL/2.0/
// © sosacur01

//@version=5
strategy(title="2 MA | Trend Following", overlay=true, pyramiding=1, commission_type=strategy.commission.percent, commission_value=0.2, initial_capital=10000)

//==========================================


//BACKTEST RANGE
useDateFilter = input.bool(true, title="Filter Date Range of Backtest",
     group="Backtest Time Period")
backtestStartDate = input(timestamp("1 jan 2000"),
     title="Start Date", group="Backtest Time Period",
     tooltip="This start date is in the time zone of the exchange " +
     "where the chart's instrument trades. It doesn't use the time " +
     "zone of the chart or of your computer.")
backtestEndDate = input(timestamp("1 Jul 2100"),
     title="End Date", group="Backtest Time Period",
     tooltip="This end date is in the time zone of the exchange " +
     "where the chart's instrument trades. It doesn't use the time " +
     "zone of the chart or of your computer.")
inTradeWindow = true
if not inTradeWindow and inTradeWindow[1]
    strategy.cancel_all()
    strategy.close_all(comment="Date Range Exit")

//--------------------------------------

//LONG/SHORT POSITION ON/OFF INPUT
LongPositions   = input.bool(title='On/Off Long Postion', defval=true, group="Long & Short Position")
ShortPositions  = input.bool(title='On/Off Short Postion', defval=true, group="Long & Short Position")

//---------------------------------------

//SLOW MA INPUTS
averageType1   = input.string(defval="SMA", group="Slow MA Inputs", title="Slow MA Type", options=["SMA", "EMA", "WMA", "HMA", "RMA", "SWMA", "ALMA", "VWMA", "VWAP"])
averageLength1 = input.int(defval=160, group="Slow MA Inputs", title="Slow MA Length", minval=50)
averageSource1 = input(close, title="Slow MA Source", group="Slow MA Inputs")


//SLOW MA TYPE
MovAvgType1(averageType1, averageSource1, averageLength1) =>
	switch str.upper(averageType1)
        "SMA"  => ta.sma(averageSource1, averageLength1)
        "EMA"  => ta.ema(averageSource1, averageLength1)
        "WMA"  => ta.wma(averageSource1, averageLength1)
        "HMA"  => ta.hma(averageSource1, averageLength1)
        "RMA"  => ta.rma(averageSource1, averageLength1)
        "SWMA" => ta.swma(averageSource1)
        "ALMA" => ta.alma(averageSource1, averageLength1, 0.85, 6)
        "VWMA" => ta.vwma(averageSource1, averageLength1)
        "VWAP" => ta.vwap(averageSource1)
        => runtime.error("Moving average type '" + averageType1 +
             "' not found!"), na


//----------------------------------

//FAST MA INPUTS
averageType2   = input.string(defval="SMA", group="Fast MA Inputs", title="Fast MA Type", options=["SMA","EMA","WMA","HMA","RMA","SWMA","ALMA","VWMA","VWAP"])
averageLength2 = input.int(defval=40, group="Fast MA Inputs", title="Fast MA Length", maxval=40)
averageSource2 = input(close, title="Fast MA Source", group="Fast MA Inputs")

//FAST MA TYPE
MovAvgType2(averageType2, averageSource2, averageLength2) =>
	switch str.upper(averageType2)
        "SMA"  => ta.sma(averageSource2, averageLength2)
        "EMA"  => ta.ema(averageSource2, averageLength2)
        "WMA"  => ta.wma(averageSource2, averageLength2)
        "HMA"  => ta.hma(averageSource2, averageLength2)
        "RMA"  => ta.rma(averageSource2, averageLength2)
        "SWMA" => ta.swma(averageSource2)
        "ALMA" => ta.alma(averageSource2, averageLength2, 0.85, 6)
        "VWMA" => ta.vwma(averageSource2, averageLength2)
        "VWAP" => ta.vwap(averageSource2)
        => runtime.error("Moving average type '" + averageType2 +
             "' not found!"), na

//---------------------------------------------------

//MA VALUES
FASTMA = MovAvgType2(averageType2, averageSource2, averageLength2)
SLOWMA = MovAvgType1(averageType1, averageSource1, averageLength1)

//BUY/SELL TRIGGERS
bullish_trend = FASTMA > SLOWMA and close > FASTMA
bearish_trend = FASTMA < SLOWMA and close < FASTMA

//MAs PLOT
plot1 = plot(SLOWMA,color=color.gray, linewidth=1, title="Slow-MA")
plot2 = plot(FASTMA,color=color.yellow, linewidth=1, title="Fast-MA")
fill(plot1, plot2, color=SLOWMA>FASTMA ? color.new(color.red, 70) : color.new(color.green, 70), title="EMA Clouds")

//-----------------------------------------------------

//PARABOLIC SAR USER INPUT
usepsarFilter = input.bool(title='Use Parabolic Sar?', defval=true, group = "Parabolic SAR Inputs")
psar_display  = input.bool(title="Display Parabolic Sar?", defval=false, group="Parabolic SAR Inputs")
start         = input.float(title="Start", defval=0.02, group="Parabolic SAR Inputs", step=0.001)
increment     = input.float(title="Increment", defval=0.02, group="Parabolic SAR Inputs", step=0.001)
maximum       = input.float(title="Maximum", defval=0.2, group="Parabolic SAR Inputs", step=0.001)

//SAR VALUES
psar        = request.security(syminfo.tickerid, "D", ta.sar(start, increment, maximum))

//BULLISH & BEARISH PSAR CONDITIONS
bullish_psar = (usepsarFilter ? low > psar : bullish_trend )
bearsish_psar = (usepsarFilter ? high < psar : bearish_trend)

//SAR PLOT
psar_plot    = if low > psar
    color.rgb(198, 234, 199, 13)
else
    color.rgb(219, 134, 134, 48)

plot(psar_display ? psar : na, color=psar_plot, title="Par SAR")

//-------------------------------------

//ENTRIES AND EXITS
long_entry  = if inTradeWindow and bullish_trend  and bullish_psar and LongPositions
    true
long_exit   = if inTradeWindow and bearish_trend
    true

short_entry = if inTradeWindow  and bearish_trend and bearsish_psar and ShortPositions
    true
short_exit  = if inTradeWindow  and bullish_trend
    true

//--------------------------------------

//RISK MANAGEMENT - SL, MONEY AT RISK, POSITION SIZING
atrPeriod                = input.int(14, "ATR Length", group="Risk Management Inputs")
sl_atr_multiplier        = input.float(title="Long Position - Stop Loss - ATR Multiplier", defval=2, group="Risk Management Inputs", step=0.5)
sl_atr_multiplier_short  = input.float(title="Short Position - Stop Loss - ATR Multiplier", defval=2, group="Risk Management Inputs", step=0.5)
i_pctStop                = input.float(2, title="% of Equity at Risk", step=.5, group="Risk Management Inputs")/100

//ATR VALUE
_atr = ta.atr(atrPeriod)

//CALCULATE LAST ENTRY PRICE
lastEntryPrice = strategy.opentrades.entry_price(strategy.opentrades - 1)

//STOP LOSS - LONG POSITIONS
var float sl = na

//CALCULTE SL WITH ATR AT ENTRY PRICE - LONG POSITION
if (strategy.position_size[1] != strategy.position_size)
    sl := lastEntryPrice - (_atr * sl_atr_multiplier)

//IN TRADE - LONG POSITIONS
inTrade = strategy.position_size > 0

//PLOT SL - LONG POSITIONS
plot(inTrade ? sl : na, color=color.blue, style=plot.style_circles, title="Long Position - Stop Loss")

//CALCULATE ORDER SIZE - LONG POSITIONS
positionSize = (strategy.equity * i_pctStop) / (_atr * sl_atr_multiplier)

//============================================================================================

//STOP LOSS - SHORT POSITIONS
var float sl_short = na

//CALCULTE SL WITH ATR AT ENTRY PRICE - SHORT POSITIONS
if (strategy.position_size[1] != strategy.position_size)
    sl_short := lastEntryPrice + (_atr * sl_atr_multiplier_short)

//IN TRADE SHORT POSITIONS
inTrade_short = strategy.position_size < 0

//PLOT SL - SHORT POSITIONS
plot(inTrade_short ? sl_short : na, color=color.red, style=plot.style_circles, title="Short Position - Stop Loss")

//CALCULATE ORDER - SHORT POSITIONS
positionSize_short = (strategy.equity * i_pctStop) / (_atr * sl_atr_multiplier_short)


//===============================================

//LONG STRATEGY
strategy.entry("Long", strategy.long, comment="Long", when = long_entry, qty=positionSize)
if (strategy.position_size > 0)
    strategy.close("Long", when = (long_exit), comment="Close Long")
    strategy.exit("Long", stop = sl, comment="Exit Long")

//SHORT STRATEGY
strategy.entry("Short", strategy.short, comment="Short", when = short_entry, qty=positionSize_short)
if (strategy.position_size < 0)
    strategy.close("Short", when = (short_exit), comment="Close Short")
    strategy.exit("Short", stop = sl_short, comment="Exit Short")

//ONE DIRECTION TRADING COMMAND (BELLOW ONLY ACTIVATE TO CORRECT BUGS)