Estrategia de Ripple basada en el intervalo de backtest del indicador Coral Trend
Descripción general
Esta estrategia utiliza el indicador de tendencia de coral de LazyBear para determinar la dirección de la tendencia de los precios y los puntos de entrada potenciales mediante la identificación de la reversión de la dirección del indicador de tendencia de coral. Para filtrar las brechas falsas, esta estrategia utiliza el indicador ADX o el conjunto de indicadores Absolute Strength Histogram y HawkEye Volume como indicadores de confirmación de colaboración para lograr una entrada más confiable.
El mecanismo de salida utiliza el precio más alto / más bajo de la línea K de la raíz N más reciente multiplicado por la proporción de retorno de riesgo configurable para establecer los límites de pérdida y parada.
Principio de estrategia
Basado en el indicador de Coral Trend para determinar la dirección de la gran tendencia, cuando el indicador de color se mantiene sin cambios, el precio aparece una pequeña reversión en la dirección opuesta (pullback). En este caso, si la reversión termina, el precio vuelve a la dirección de la tendencia principal indicada por Coral Trend, entonces se puede considerar que es una mejor oportunidad de entrada.
Las condiciones de ingreso incluyen:
La dirección del indicador de Coral Trend coincide con la dirección de la operación ((multi-cabezas = verde, cabecera en blanco = rojo)
Desde la última vez que el precio ha roto completamente el indicador de Coral Trend (el punto más alto de la última barra supera la línea de Coral Trend), ha habido al menos 1 línea de K con puntos bajos todos por encima del indicador de Coral Trend (político) o puntos altos todos por debajo del indicador de Coral Trend (vacío)
Una pequeña reversión que ocurre en la dirección opuesta (retracción), durante la cual el precio de cierre se mantiene en el lado opuesto de la Coral Trend
Tras una pequeña corrección, el cierre regresó a la dirección de la tendencia principal indicada por la Coral Trend
Los siguientes son los requisitos principales. Al mismo tiempo, la estrategia utiliza el indicador ADX o el indicador de fuerza absoluta y el indicador de volumen de HawkEye como condición de confirmación de ingreso.
El indicador ADX requiere que su valor sea > 20 y que recientemente haya subido 1 línea K. Y el orden de las líneas verde y roja de DI coincide con la dirección de la operación.
El Histograma de Fuerza Absoluta requiere que su color coincida con la dirección de negociación: ((multi-cabeza = azul, cabecera = rojo)). El volumen de HawkEye requiere que su color coincida con la dirección de negociación: ((multi-cabeza = verde, cabecera = rojo)).
El mecanismo de salida es el uso del precio más alto o más bajo de la línea K de la raíz N más reciente multiplicado por la proporción de la ganancia del riesgo para establecer el nivel de pérdida y el nivel de parada. Tanto el valor de N como el nivel de ganancia del riesgo pueden configurarse a través de los parámetros.
Análisis de las ventajas
La mayor ventaja de esta estrategia es que, después de usar el indicador de Coral Trend para determinar la dirección de la tendencia principal, detecta las oportunidades de entrada mediante la identificación de su reversión y evita seguir el flujo de la ola en un mercado no en tendencia. Al mismo tiempo, la aplicación del indicador Confirm puede filtrar muchos brechas falsas, lo que aumenta la tasa de éxito de la entrada.
Además, la estrategia ofrece un mecanismo de control de riesgo completo, que incluye la configuración de la amplitud de stop loss y el control del porcentaje de la brecha de riesgo, de modo que incluso las pérdidas de transacciones individuales no tienen un impacto significativo en el capital total.
Análisis de riesgos
El mayor riesgo de esta estrategia reside en que la utilización de los indicadores para el juicio de entrada, es fácil de crear la ilusión de que la dependencia completa de la configuración de los parámetros puede obtener ganancias automáticas. En realidad, la optimización de los parámetros y la configuración de las reglas necesitan combinar la ley de los cambios en los precios subyacentes, intuir el efecto de la vinculación de los indicadores con los precios, para establecer una configuración más adecuada para su propio estilo de negociación y variedad.
Además, la configuración de los puntos de parada y de parada debe ser adecuada, ya que un multiplicador de parada demasiado grande puede provocar que no se pueda detener el juego, mientras que un punto de parada demasiado pequeño es demasiado arriesgado. Esto debe ajustarse según la volatilidad de las diferentes variedades y la capacidad de asumir el riesgo personal.
Dirección de optimización
La estrategia se puede optimizar en las siguientes áreas:
Ajuste de los parámetros del indicador Coral Trend para que sea más sensible a los cambios en los precios de las diferentes variedades
Probar diferentes indicadores de confirmación o combinaciones de indicadores, como KDJ, MACD, etc., para que las señales de entrada sean más precisas
Ajuste el método de cálculo de los puntos de parada y los puntos de parada según la volatilidad de las diferentes variedades para un mejor control del riesgo
El módulo de administración de fondos se ha añadido, lo que permite ajustar el volumen de encargo individual en función de la cantidad de posiciones, lo que permite un control efectivo de las pérdidas totales
Aumentar el módulo de control de la hora de negociación para que la estrategia se ejecute solo en períodos de tiempo específicos y evitar pérdidas en períodos de gran volatilidad
Resumir
Esta estrategia utiliza Coral Trend para determinar la tendencia de la línea media larga, y luego, al determinar su reversión, en combinación con la filtración de señales de confirmación de brechas falsas, para construir una estrategia de seguimiento de tendencias más confiable. Al mismo tiempo, la configuración de control de viento perfeccionada también permite que la estrategia funcione a largo plazo y la estabilidad de los fondos.
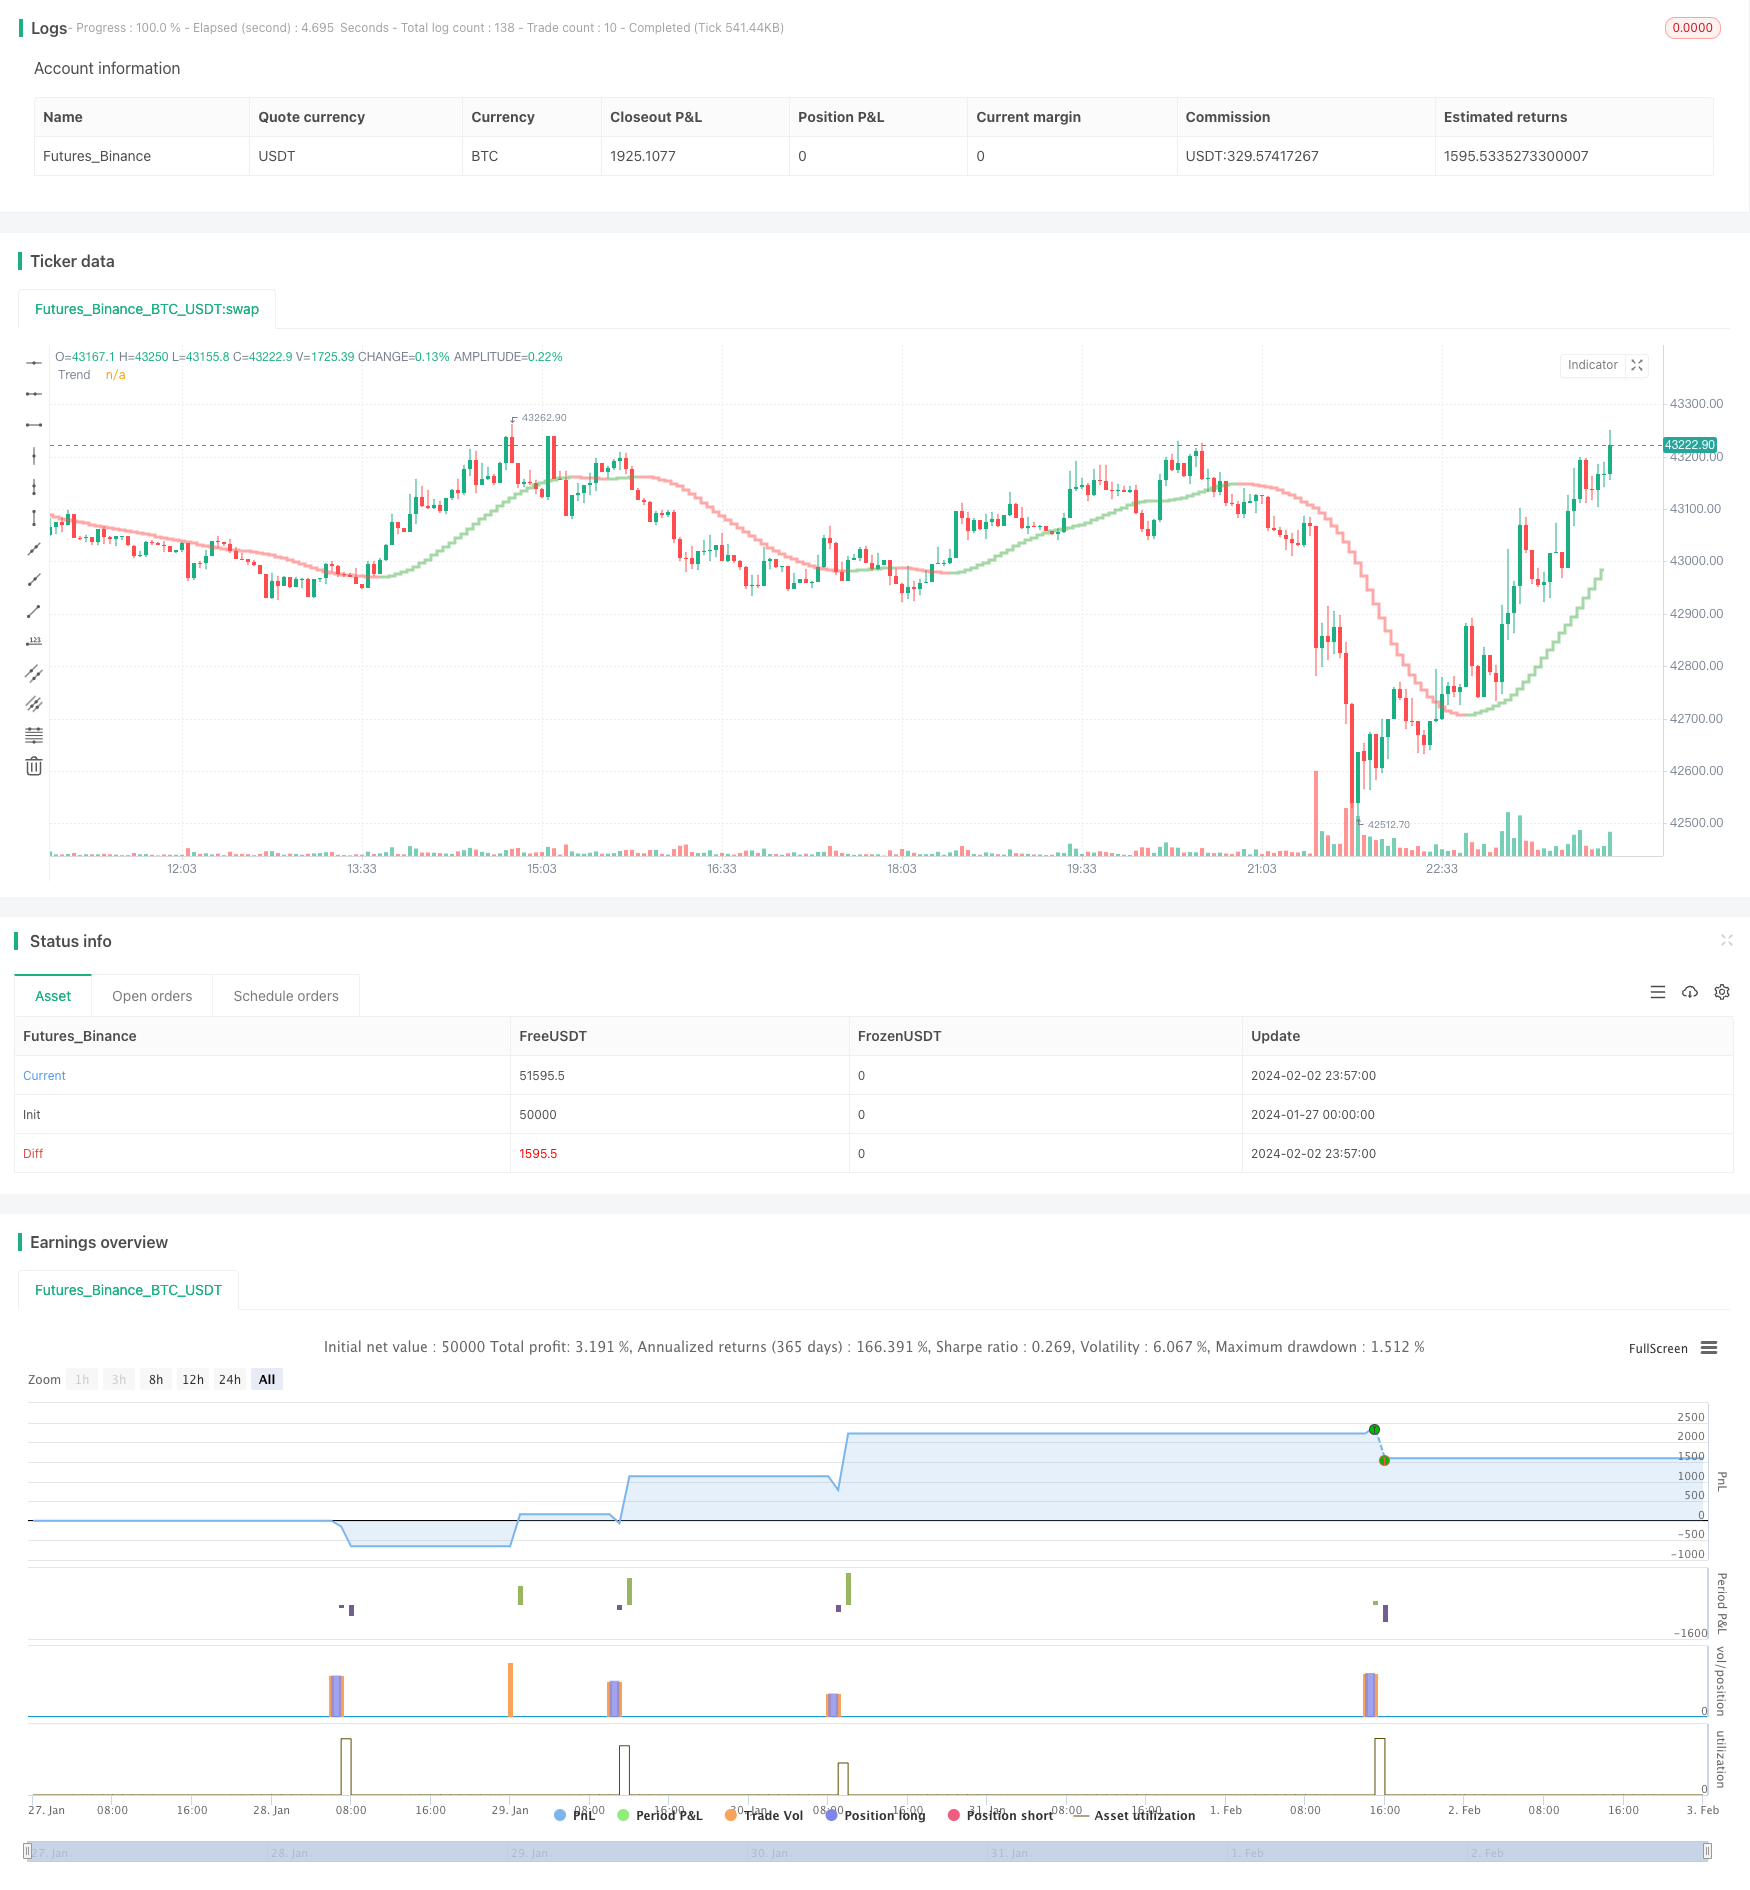
/*backtest
start: 2024-01-27 00:00:00
end: 2024-02-03 00:00:00
period: 3m
basePeriod: 1m
exchanges: [{"eid":"Futures_Binance","currency":"BTC_USDT"}]
*/

// This source code is subject to the terms of the Mozilla Public License 2.0 at https://mozilla.org/MPL/2.0/
// © kevinmck100

// @description
//
// Strategy is taken from the TradeIQ YouTube video called "I Finally Found 80% Win Rate Trading Strategy For Crypto"
// Check out the full video for further details/clarification on strategy entry/exit conditions.
//
// It incorporates the following features:
//
//      - Risk management:  Configurable X% loss per stop loss
//                          Configurable R:R ratio
//
//      - Trade entry:      Conditions outlines below
//
//      - Trade exit:       Conditions outlined below
//
//      - Backtesting:      Configurable backtesting range by date
//
//      - Trade drawings:   TP/SL boxes drawn for all trades (can be turned on and off)
//                          Trade exit information labels (can be turned on and off)
//                          NOTE: Trade drawings will only be applicable when using overlay strategies
//
//      - Debugging:        Includes section with useful debugging techniques
//
// Strategy conditions:
//
//      - Trade entry:      LONG:   C1: Coral Trend is bullish
//                                  C2: At least 1 candle where low is above Coral Trend since last cross above Coral Trend
//                                  C3: Pullback happens and price closes below Coral Trend
//                                  C4: Coral Trend colour remains bullish for duration of pullback
//                                  C5: After valid pullback, price then closes above Coral Trend
//                                  C6: Optional confirmation indicators (choose either C6.1 or C6.2 or NONE):
//                                      C6.1: ADX and DI (Single indicator)
//                                          C6.1.1: Green line is above red line
//                                          C6.1.2: Blue line > 20
//                                          C6.1.3: Blue trending up over last 1 candle
//                                      C6.2: Absolute Strengeh Histogram + HawkEye Volume Indicator (Two indicators combined)
//                                          C6.2.1: Absolute Strengeh Histogram colour is blue
//                                          C6.2.2: HawkEye Volume Indicator colour is green
//                          SHORT:  C1: Coral Trend is bearish
//                                  C2: At least 1 candle where high is below Coral Trend since last cross below Coral Trend
//                                  C3: Pullback happens and price closes above Coral Trend
//                                  C4: Coral Trend colour remains bearish for duration of pullback
//                                  C5: After valid pullback, price then closes below Coral Trend
//                                  C6: Optional confirmation indicators (choose either C6.1 or C6.2 or NONE):
//                                      C6.1: ADX and DI (Single indicator)
//                                          C6.1.1: Red line is above green line
//                                          C6.1.2: Blue line > 20
//                                          C6.1.3: Blue trending up over last 1 candle
//                                      C6.2: Absolute Strengeh Histogram + HawkEye Volume Indicator (Two indicators combined)
//                                          C6.2.1: Absolute Strengeh Histogram colour is red
//                                          C6.2.2: HawkEye Volume Indicator colour is red
//                          NOTE: All the optional confirmation indicators cannot be overlayed with Coral Trend so feel free to add each separately to the chart for visual purposes
//
//
//      - Trade exit:       Stop Loss:      Calculated by recent swing low over previous X candles (configurable with "Local High/Low Lookback")
//                          Take Profit:    Calculated from R:R multiplier * Stop Loss size
//
// @credits
//
// Coral Trend Indicator [LazyBear]     by @LazyBear
// Absolute Strength Histogram | jh     by @jiehonglim
// Indicator: HawkEye Volume Indicator  by @LazyBear
// ADX and DI                           by @BeikabuOyaji

//@version=5
INITIAL_CAPITAL = 1000
DEFAULT_COMMISSION = 0.02
MAX_DRAWINGS = 500
IS_OVERLAY = true

strategy("Coral Trend Pullback Strategy (TradeIQ)", "Coral Trend Pullback", overlay = IS_OVERLAY, initial_capital = INITIAL_CAPITAL, currency = currency.NONE, max_labels_count = MAX_DRAWINGS, max_boxes_count = MAX_DRAWINGS, max_lines_count = MAX_DRAWINGS, default_qty_type = strategy.cash, commission_type = strategy.commission.percent, commission_value = DEFAULT_COMMISSION)

// =============================================================================
// INPUTS
// =============================================================================

// ---------------
// Risk Management
// ---------------
riskReward          = input.float(1.5,  "Risk : Reward        1 :",     group = "Strategy: Risk Management",    inline = "RM1", minval = 0, step = 0.1, tooltip = "Previous high or low (long/short dependant) is used to determine TP level. 'Risk : Reward' ratio is then used to calculate SL based of previous high/low level.\n\nIn short, the higher the R:R ratio, the smaller the SL since TP target is fixed by previous high/low price data.")
accountRiskPercent  = input.float(1,    "Portfolio Risk %        ",     group = "Strategy: Risk Management",    inline = "RM2", minval = 0, step = 0.1, tooltip = "Percentage of portfolio you lose if trade hits SL.\n\nYou then stand to gain\n  Portfolio Risk % * Risk : Reward\nif trade hits TP.")

localHlLookback     = input.int (5,     "Local High/Low Lookback     ", group = "Strategy: Stop Loss Settings", inline = "SL1", minval = 1,             tooltip = "This strategy calculates the Stop Loss value from the recent local high/low. This lookback period determines the number of candles to include for the local high/low.")

// ----------
// Date Range
// ----------
startYear           = input.int (2010,  "Start Date  ",                 group = "Strategy: Date Range",         inline = "DR1", minval    = 1900, maxval = 2100)
startMonth          = input.int (1,     "",                             group = "Strategy: Date Range",         inline = "DR1", options   = [1, 2, 3, 4, 5, 6, 7, 8, 9, 10, 11, 12])
startDate           = input.int (1,     "",                             group = "Strategy: Date Range",         inline = "DR1", options   = [1, 2, 3, 4, 5, 6, 7, 8, 9, 10, 11, 12, 13, 14, 15, 16, 17, 18, 19, 20, 21, 22, 23, 24, 25, 26, 27, 28, 29, 30, 31])
endYear             = input.int (2100,  "End Date    ",                 group = "Strategy: Date Range",         inline = "DR2", minval    = 1900, maxval = 2100)
endMonth            = input.int (1,     "",                             group = "Strategy: Date Range",         inline = "DR2", options   = [1, 2, 3, 4, 5, 6, 7, 8, 9, 10, 11, 12])
endDate             = input.int (1,     "",                             group = "Strategy: Date Range",         inline = "DR2", options   = [1, 2, 3, 4, 5, 6, 7, 8, 9, 10, 11, 12, 13, 14, 15, 16, 17, 18, 19, 20, 21, 22, 23, 24, 25, 26, 27, 28, 29, 30, 31])

// ----------------
// Drawing Settings
// ----------------
showTpSlBoxes       = input.bool(true,  "Show TP / SL Boxes",           group = "Strategy: Drawings",           inline = "D1",  tooltip = "Show or hide TP and SL position boxes.\n\nNote: TradingView limits the maximum number of boxes that can be displayed to 500 so they may not appear for all price data under test.")
showLabels          = input.bool(false, "Show Trade Exit Labels",       group = "Strategy: Drawings",           inline = "D2",  tooltip = "Useful labels to identify Profit/Loss and cumulative portfolio capital after each trade closes.\n\nAlso note that TradingView limits the max number of 'boxes' that can be displayed on a chart (max 500). This means when you lookback far enough on the chart you will not see the TP/SL boxes. However you can check this option to identify where trades exited.")

// ------------------
// Indicator Settings
// ------------------

// Coral Trend
ctSm                = input.int  (25,       "Smoothing Period       ",              group = "Leading Indicator: Coral Trand Settings",                      inline = "CT1")
ctCd                = input.float(0.4,      "Constant D          ",                 group = "Leading Indicator: Coral Trand Settings",                      inline = "CT2", step = 0.1)

// Confirmation indicator inputs
confirmationInd     = input.string("ADX and DI", "Entry Confirmation Method    ",   group = "Confirmation Indicator: Indicator Selection",                  inline = "IS1", options=["None", "ADX and DI", "Absolute Strength Histogram + HawkEye Volume"], tooltip = "Select one of the possible confirmation indicator(s) which can be used to confirm entry signals from the main Coral Trend indicator conditions. See strategy conditions to understand the logic behind each confirmation indicator")
// ADX and DI
adxLen              = input.int(14, "ADX Length           ",                        group = "Confirmation Indicator: ADX and DI Settings",                  inline = "AD1")
midLine             = input.int(20, "Mid Line            ",                         group = "Confirmation Indicator: ADX and DI Settings",                  inline = "AD2", tooltip = "Mid line on standard ADX and DI indicator. In this strategy the DI must be above this line for entry confirmation.")
// Absolute Strength Histogram
ashLength           = input.int(9, "Period of Evaluation       ",                   group = "Confirmation Indicator: Absolute Strength Histogram Settings", inline = "ASH1")
ashSmooth           = input.int(6, "Period of Smoothing      ",                     group = "Confirmation Indicator: Absolute Strength Histogram Settings", inline = "ASH2")
ashSrc              = input.source(close, "Source             ",                    group = "Confirmation Indicator: Absolute Strength Histogram Settings", inline = "ASH3")
ashMode             = input.string("RSI", "Indicator Method       ",                group = "Confirmation Indicator: Absolute Strength Histogram Settings", inline = "ASH4", options=["RSI", "STOCHASTIC", "ADX"])
sahMaType           = input.string("SMA", "MA              ",                       group = "Confirmation Indicator: Absolute Strength Histogram Settings", inline = "ASH5", options=["ALMA", "EMA", "WMA", "SMA", "SMMA", "HMA"])
ashAlmaOffset       = input.float(0.85, "* Arnaud Legoux (ALMA) Offset",            group = "Confirmation Indicator: Absolute Strength Histogram Settings", inline = "ASH6", minval=0, step=0.01)
ashAlmaSigma        = input.int(6, "* Arnaud Legoux (ALMA) Sigma",                  group = "Confirmation Indicator: Absolute Strength Histogram Settings", inline = "ASH7", minval=0)
// HawkEye Volume Indicator
hevLength           = input.int(200, "Length             ",                         group = "Confirmation Indicator: HawkEye Volume Settings",              inline = "HV1")
hevDivisor          = input.float(1.6, "Divisor             ",                      group = "Confirmation Indicator: HawkEye Volume Settings",              inline = "HV2", step=0.1)

// =============================================================================
// INDICATORS
// =============================================================================

// -----------
// Coral Trend
// -----------
src             = close
di              = (ctSm - 1.0) / 2.0 + 1.0
c1              = 2 / (di + 1.0)
c2              = 1 - c1
c3              = 3.0 * (ctCd * ctCd + ctCd * ctCd * ctCd)
c4              = -3.0 * (2.0 * ctCd * ctCd + ctCd + ctCd * ctCd * ctCd)
c5              = 3.0 * ctCd + 1.0 + ctCd * ctCd * ctCd + 3.0 * ctCd * ctCd
var float i1    = na
var float i2    = na
var float i3    = na
var float i4    = na
var float i5    = na
var float i6    = na
i1             := c1 * src + c2 * nz(i1[1])
i2             := c1 * i1  + c2 * nz(i2[1])
i3             := c1 * i2  + c2 * nz(i3[1])
i4             := c1 * i3  + c2 * nz(i4[1])
i5             := c1 * i4  + c2 * nz(i5[1])
i6             := c1 * i5  + c2 * nz(i6[1])

bfr             = -ctCd * ctCd * ctCd * i6 + c3 * i5 + c4 * i4 + c5 * i3
bfrC            = bfr > nz(bfr[1]) ? color.new(color.green, 50) : bfr < nz(bfr[1]) ? color.new(color.red, 50) : color.new(color.blue, 50)
plot(bfr, "Trend", linewidth = 3, style = plot.style_stepline, color = bfrC)

// ----------
// ADX and DI
// ----------
TrueRange                           = math.max(math.max(high - low, math.abs(high - nz(close[1]))), math.abs(low - nz(close[1])))
DirectionalMovementPlus             = high - nz(high[1]) > nz(low[1]) - low ? math.max(high - nz(high[1]), 0) : 0
DirectionalMovementMinus            = nz(low[1]) - low > high - nz(high[1]) ? math.max(nz(low[1]) - low, 0) : 0

SmoothedTrueRange                   = 0.0
SmoothedTrueRange                  := nz(SmoothedTrueRange[1]) - nz(SmoothedTrueRange[1]) / adxLen + TrueRange

SmoothedDirectionalMovementPlus     = 0.0
SmoothedDirectionalMovementPlus    := nz(SmoothedDirectionalMovementPlus[1]) - nz(SmoothedDirectionalMovementPlus[1]) / adxLen + DirectionalMovementPlus

SmoothedDirectionalMovementMinus    = 0.0
SmoothedDirectionalMovementMinus   := nz(SmoothedDirectionalMovementMinus[1]) - nz(SmoothedDirectionalMovementMinus[1]) / adxLen + DirectionalMovementMinus

DIPlus                              = SmoothedDirectionalMovementPlus / SmoothedTrueRange * 100
DIMinus                             = SmoothedDirectionalMovementMinus / SmoothedTrueRange * 100
DX                                  = math.abs(DIPlus - DIMinus) / (DIPlus + DIMinus) * 100
ADX                                 = ta.sma(DX, adxLen)

// ---------------------------
// Absolute Strength Histogram
// ---------------------------
ashMa(ashType, ashSrc, ashLen) =>
    float result = 0
    if ashType == 'SMA'  // Simple
        result := ta.sma(ashSrc, ashLen)
        result
    if ashType == 'EMA'  // Exponential
        result := ta.ema(ashSrc, ashLen)
        result
    if ashType == 'WMA'  // Weighted
        result := ta.wma(ashSrc, ashLen)
        result
    if ashType == 'SMMA'  // Smoothed
        ashWma = ta.wma(ashSrc, ashLen)
        ashSma = ta.sma(ashSrc, ashLen)
        result := na(ashWma[1]) ? ashSma : (ashWma[1] * (ashLen - 1) + ashSrc) / ashLen
        result
    if ashType == 'HMA'  // Hull
        result := ta.wma(2 * ta.wma(ashSrc, ashLen / 2) - ta.wma(ashSrc, ashLen), math.round(math.sqrt(ashLen)))
        result
    if ashType == 'ALMA'  // Arnaud Legoux
        result := ta.alma(ashSrc, ashLen, ashAlmaOffset, ashAlmaSigma)
        result
    result

Price           = ashSrc
Price1          = ashMa('SMA', Price, 1)
Price2          = ashMa('SMA', Price[1], 1)

//RSI
Bulls0          = 0.5 * (math.abs(Price1 - Price2) + Price1 - Price2)
Bears0          = 0.5 * (math.abs(Price1 - Price2) - (Price1 - Price2))

//STOCHASTIC
Bulls1          = Price1 - ta.lowest(Price1, ashLength)
Bears1          = ta.highest(Price1, ashLength) - Price1

//ADX
Bulls2          = 0.5 * (math.abs(high - high[1]) + high - high[1])
Bears2          = 0.5 * (math.abs(low[1] - low) + low[1] - low)

Bulls           = ashMode == 'RSI' ? Bulls0 : ashMode == 'STOCHASTIC' ? Bulls1 : Bulls2
Bears           = ashMode == 'RSI' ? Bears0 : ashMode == 'STOCHASTIC' ? Bears1 : Bears2
AvgBulls        = ashMa(sahMaType, Bulls, ashLength)
AvgBears        = ashMa(sahMaType, Bears, ashLength)

SmthBulls       = ashMa(sahMaType, AvgBulls, ashSmooth)
SmthBears       = ashMa(sahMaType, AvgBears, ashSmooth)

isTrendBullish  = SmthBulls > SmthBears ? true : false

// ------------------------
// HawkEye Volume Indicator
// ------------------------
hevRange1   = high - low
hevRangeAvg = ta.sma(hevRange1, hevLength)
hevVolumeA  = ta.sma(volume, hevLength)

hevHigh1    = high[1]
hevLow1     = low[1]
hevMid1     = hl2[1]

hevU1       = hevMid1 + (hevHigh1 - hevLow1) / hevDivisor
hevD1       = hevMid1 - (hevHigh1 - hevLow1) / hevDivisor

rEnabled1   = hevRange1 > hevRangeAvg and close < hevD1 and volume > hevVolumeA
rEnabled2   = close < hevMid1
rEnabled    = rEnabled1 or rEnabled2

gEnabled1   = close > hevMid1
gEnabled2   = hevRange1 > hevRangeAvg and close > hevU1 and volume > hevVolumeA
gEnabled3   = high > hevHigh1 and hevRange1 < hevRangeAvg / 1.5 and volume < hevVolumeA
gEnabled4   = low < hevLow1 and hevRange1 < hevRangeAvg / 1.5 and volume > hevVolumeA
gEnabled    = gEnabled1 or gEnabled2 or gEnabled3 or gEnabled4

grEnabled1  = hevRange1 > hevRangeAvg and close > hevD1 and close < hevU1 and volume > hevVolumeA and volume < hevVolumeA * 1.5 and volume > volume[1]
grEnabled2  = hevRange1 < hevRangeAvg / 1.5 and volume < hevVolumeA / 1.5
grEnabled3  = close > hevD1 and close < hevU1
grEnabled   = grEnabled1 or grEnabled2 or grEnabled3

// =============================================================================
// STRATEGY LOGIC
// =============================================================================

// ---------
// FUNCTIONS
// ---------

percentAsPoints(pcnt) =>
    math.round(pcnt / 100 * close / syminfo.mintick)

calcStopLossPrice(pointsOffset, isLong) =>
    priceOffset = pointsOffset * syminfo.mintick
    if isLong
        close - priceOffset
    else
        close + priceOffset

calcProfitTrgtPrice(pointsOffset, isLong) =>
    calcStopLossPrice(-pointsOffset, isLong)


printLabel(barIndex, msg) => label.new(barIndex, close, msg)

printTpSlHitBox(left, right, slHit, tpHit, entryPrice, slPrice, tpPrice) =>
    if showTpSlBoxes
        box.new (left = left,   top = entryPrice,   right = right,  bottom = slPrice,   bgcolor = slHit ? color.new(color.red, 60)   : color.new(color.gray, 90), border_width = 0)
        box.new (left = left,   top = entryPrice,   right = right,  bottom = tpPrice,   bgcolor = tpHit ? color.new(color.green, 60) : color.new(color.gray, 90), border_width = 0)
        line.new(x1 = left,     y1 = entryPrice,    x2 = right,     y2 = entryPrice,    color = color.new(color.yellow, 20))
        line.new(x1 = left,     y1 = slPrice,       x2 = right,     y2 = slPrice,       color = color.new(color.red, 20))
        line.new(x1 = left,     y1 = tpPrice,       x2 = right,     y2 = tpPrice,       color = color.new(color.green, 20))

printTpSlNotHitBox(left, right, entryPrice, slPrice, tpPrice) =>
    if showTpSlBoxes
        box.new (left = left,   top = entryPrice,   right = right,  bottom = slPrice,   bgcolor = color.new(color.gray, 90), border_width = 0)
        box.new (left = left,   top = entryPrice,   right = right,  bottom = tpPrice,   bgcolor = color.new(color.gray, 90), border_width = 0)
        line.new(x1 = left,     y1 = entryPrice,    x2 = right,     y2 = entryPrice,    color = color.new(color.yellow, 20))
        line.new(x1 = left,     y1 = slPrice,       x2 = right,     y2 = slPrice,       color = color.new(color.red, 20))
        line.new(x1 = left,     y1 = tpPrice,       x2 = right,     y2 = tpPrice,       color = color.new(color.green, 20))

printTradeExitLabel(x, y, posSize, entryPrice, pnl) =>
    if showLabels
        labelStr = "Position Size: " + str.tostring(math.abs(posSize), "#.##") + "\nPNL: " + str.tostring(pnl, "#.##") + "\nCapital: " + str.tostring(strategy.equity, "#.##") + "\nEntry Price: " + str.tostring(entryPrice, "#.##")
        label.new(x = x, y = y, text = labelStr, color = pnl > 0 ? color.new(color.green, 60) : color.new(color.red, 60), textcolor = color.white, style = label.style_label_down)

printVerticalLine(col) => line.new(bar_index, close, bar_index, close * 1.01, extend = extend.both, color = col)

// ----------
// CONDITIONS
// ----------

inDateRange                 = true

// Condition 1: Coral Trend color matches trend direction (long=green, short=red)
isCoralBullish              = bfr > nz(bfr[1])
isCoralBearish              = bfr < nz(bfr[1])

// Condition 2: At least 1 candle completely above/below (long/short) Coral Trend since last cross above/below (long/short) Coral Trend (could potentially try also with only close above)
sincePrePullbackBullBreakout= ta.barssince(ta.crossover(close, bfr))
sincePrePullbackBearBreakout= ta.barssince(ta.crossunder(close, bfr))
prePullbackBullBreakout     = ta.barssince(low > bfr and high > bfr) < sincePrePullbackBullBreakout[1]
prePullbackBearBreakout     = ta.barssince(low < bfr and high < bfr) < sincePrePullbackBearBreakout[1]

// Condition 3: Pullback closes below/above (long/short) Coral Trend
barssinceBullPullbackStart  = ta.barssince(ta.crossunder(close, bfr))
barssinceBearPullbackStart  = ta.barssince(ta.crossover(close, bfr))
barssincePullbackStart      = isCoralBullish ? barssinceBullPullbackStart : isCoralBearish ? barssinceBearPullbackStart : na

// Condition 4: Coral Trend colour matched trend direction for duration of pullback
sinceBullish                = ta.barssince(ta.crossover(bfr, nz(bfr[1])))
sinceBearish                = ta.barssince(ta.crossunder(bfr, nz(bfr[1])))
barssinceCoralflip          = isCoralBullish ? sinceBullish : isCoralBearish ? sinceBearish : na
isPullbackValid             = barssincePullbackStart < barssinceCoralflip

// Condition 5: After valid pullback, price then closes above/below (long/short) Coral Trend
entryBreakout               = (isCoralBullish and ta.crossover(close, bfr)) or (isCoralBearish and ta.crossunder(close, bfr))

// Condition 6: Confirmation indicators (6.1 or 6.2, optional depending on settings) confirms trade entry
// 6.1:         ADX and DI
//      6.1.1:  Green and red match trend (long=(green > red), short=(red > green))
//      6.1.2:  Blue > 20
//      6.1.3:  Blue trending up over last 1 candle
// 6.2:         Absolute Strengeh Histogram + HawkEye Volume Indicator
//      6.2.1:  Absolute Strengeh Histogram colour matches trend (long=blue, short=red)
//      6.2.2:  HawkEye Volume Indicator colour matches trend (long=green, short=red)
var longTradeConfirmed  = false
var shortTradeConfirmed = false
if confirmationInd      == "ADX and DI"
    isAdxUp             = ADX       > ADX [1]
    isAdxValid          = ADX       > midLine   and isAdxUp
    longTradeConfirmed := DIPlus    > DIMinus   and isAdxValid
    shortTradeConfirmed:= DIMinus   > DIPlus    and isAdxValid
else if confirmationInd == "Absolute Strength Histogram + HawkEye Volume"
    isAshBullish        = SmthBulls > SmthBears ? true : false
    isHevBullish        = not grEnabled     and gEnabled ? true : false
    isHevBearish        = not grEnabled     and rEnabled ? true : false
    longTradeConfirmed := isAshBullish      and isHevBullish
    shortTradeConfirmed:= not isAshBullish  and isHevBearish
else if confirmationInd == "None"
    longTradeConfirmed := true
    shortTradeConfirmed:= true

// Combine all entry conditions
goLong              = inDateRange and isCoralBullish and prePullbackBullBreakout and isPullbackValid and entryBreakout and longTradeConfirmed
goShort             = inDateRange and isCoralBearish and prePullbackBearBreakout and isPullbackValid and entryBreakout and shortTradeConfirmed

// Trade entry and exit variables
var tradeEntryBar   = bar_index
var profitPoints    = 0.
var lossPoints      = 0.
var slPrice         = 0.
var tpPrice         = 0.
var inLong          = false
var inShort         = false
var entryPrice      = 0.

// Entry decisions
openLong            = (goLong and not inLong)
openShort           = (goShort and not inShort)
flippingSides       = (goLong and inShort) or (goShort and inLong)
enteringTrade       = openLong or openShort
inTrade             = inLong or inShort

// Exit calculations
entryPrice         := close
longSlPrice         = ta.lowest(localHlLookback)
shortSlPrice        = ta.highest(localHlLookback)
slAmount            = isCoralBullish ? entryPrice - longSlPrice : shortSlPrice - entryPrice
slPercent           = math.abs((1 - (entryPrice - slAmount) / entryPrice) * 100)
tpPercent           = slPercent * riskReward

// Risk calculations
riskAmt             = strategy.equity * accountRiskPercent / 100
entryQty            = math.abs(riskAmt / slPercent * 100)  / close

if openLong
    if strategy.position_size < 0
        printTpSlNotHitBox(tradeEntryBar + 1, bar_index + 1, strategy.position_avg_price, slPrice, tpPrice)
        printTradeExitLabel(bar_index + 1, math.max(tpPrice, slPrice), strategy.position_size, strategy.position_avg_price, strategy.openprofit)
    strategy.entry("Long", strategy.long, qty = entryQty, alert_message = "Long Entry")
    enteringTrade   := true
    inLong          := true
    inShort         := false

if openShort
    if strategy.position_size > 0
        printTpSlNotHitBox(tradeEntryBar + 1, bar_index + 1, strategy.position_avg_price, slPrice, tpPrice)
        printTradeExitLabel(bar_index + 1, math.max(tpPrice, slPrice), strategy.position_size, strategy.position_avg_price, strategy.openprofit)
    strategy.entry("Short", strategy.short, qty = entryQty, alert_message = "Short Entry")
    enteringTrade   := true
    inShort         := true
    inLong          := false

if enteringTrade
    profitPoints    := percentAsPoints(tpPercent)
    lossPoints      := percentAsPoints(slPercent)
    slPrice         := calcStopLossPrice(lossPoints, openLong)
    tpPrice         := calcProfitTrgtPrice(profitPoints, openLong)
    tradeEntryBar   := bar_index

strategy.exit("TP/SL", profit = profitPoints, loss = lossPoints, comment_profit = "TP Hit", comment_loss = "SL Hit", alert_profit = "TP Hit Alert", alert_loss = "SL Hit Alert")

// =============================================================================
// DRAWINGS
// =============================================================================

// -----------
// TP/SL Boxes
// -----------

slHit           = (inShort and high >= slPrice) or (inLong  and low <= slPrice)
tpHit           = (inLong  and high >= tpPrice) or (inShort and low <= tpPrice)

exitTriggered   = slHit or tpHit
ctEntryPrice    = strategy.closedtrades.entry_price (strategy.closedtrades - 1)
pnl             = strategy.closedtrades.profit      (strategy.closedtrades - 1)
posSize         = strategy.closedtrades.size        (strategy.closedtrades - 1)

// Print boxes for trades closed at profit or loss
if (inTrade and exitTriggered)
    inShort    := false
    inLong     := false
    // printTpSlHitBox(tradeEntryBar, bar_index, slHit, tpHit, ctEntryPrice, slPrice, tpPrice)
    // printTradeExitLabel(bar_index, math.max(tpPrice, slPrice), posSize, ctEntryPrice, pnl)

// Print TP/SL box for current open trade
// if barstate.islastconfirmedhistory and strategy.position_size != 0
//     printTpSlNotHitBox(tradeEntryBar + 1, bar_index + 1, strategy.position_avg_price, slPrice, tpPrice)

// // =============================================================================
// // DEBUGGING
// // =============================================================================

// Data window plots
plotchar(prePullbackBullBreakout,   "prePullbackBullBreakout",  "")
plotchar(prePullbackBearBreakout,   "prePullbackBearBreakout",  "")
plotchar(barssincePullbackStart,    "barssincePullbackStart",   "")
plotchar(isCoralBullish,            "isCoralBullish",           "")
plotchar(isCoralBearish,            "isCoralBearish",           "")
plotchar(barssinceCoralflip,        "barssinceCoralflip",       "")
plotchar(isPullbackValid,           "isPullbackValid",          "")
plotchar(entryBreakout,             "entryBreakout",            "")
plotchar(slHit,                     "slHit",                    "")
plotchar(tpHit,                     "tpHit",                    "")
plotchar(slPrice,                   "slPrice",                  "")

// Label plots
// plotDebugLabels = false
// if plotDebugLabels
//     if bar_index == tradeEntryBar
//         printLabel(bar_index, "Position size: " + str.tostring(entryQty * close, "#.##"))