Estrategia cuantitativa basada en el pivote de Kamachira y las bandas de Bollinger

1
Follow
1782
Followers
Descripción general
La estrategia primero calcula los puntos cardinales de Camachira en función de los máximos, mínimos y cierre de la fecha de negociación anterior. Luego se filtra el precio en combinación con el indicador de la banda de Brin, generando una señal de negociación cuando el precio rompe los puntos cardinales.
Principio de estrategia
- Calcular el precio máximo, mínimo y el precio de cierre del día anterior
- Calcula el eje de Camachilla con la fórmula H4, H3, H2, H1 y los subtramos L1, L2, L3 y L4
- Calculando el día 20 de la subida y bajada del tren de Bryn.
- Hacer más cuando el precio sube y baja, y hacer menos cuando baja
- El punto de parada está situado cerca de la banda de Brin en la vía ascendente o descendente
Análisis de las ventajas
- El eje de Camachilla contiene varios puntos de resistencia de soporte clave para aumentar la fiabilidad de la señal de negociación
- En combinación con el indicador de la banda de Bryn, se puede filtrar eficazmente las brechas falsas
- La combinación de varios conjuntos de parámetros, la flexibilidad de negociación
Análisis de riesgos
- La configuración incorrecta de los parámetros del indicador de la banda de Bryn puede causar errores en las señales de negociación
- Los puntos clave del eje de Camachira se calculan en función de los precios del día de negociación anterior, que pueden verse afectados por el salto nocturno
- Las operaciones con múltiples cabezas en blanco tienen riesgos de pérdidas
Dirección de optimización
- Optimización de los parámetros de la banda de Bryn para encontrar la combinación óptima de parámetros
- Combinación de otros indicadores para filtrar falsas señales de ruptura
- Aumentar las estrategias de detener las pérdidas y reducir las pérdidas individuales
Resumir
La estrategia utiliza el eje de Camachilla y el indicador de las bandas de Brin para generar señales de negociación cuando el precio supera los puntos de resistencia de soporte clave. Se puede optimizar los parámetros y filtrar las señales para aumentar la rentabilidad y la estabilidad de la estrategia. En general, la estrategia de negociación es clara, operable y digna de ser verificada en el terreno.
Source
Pine
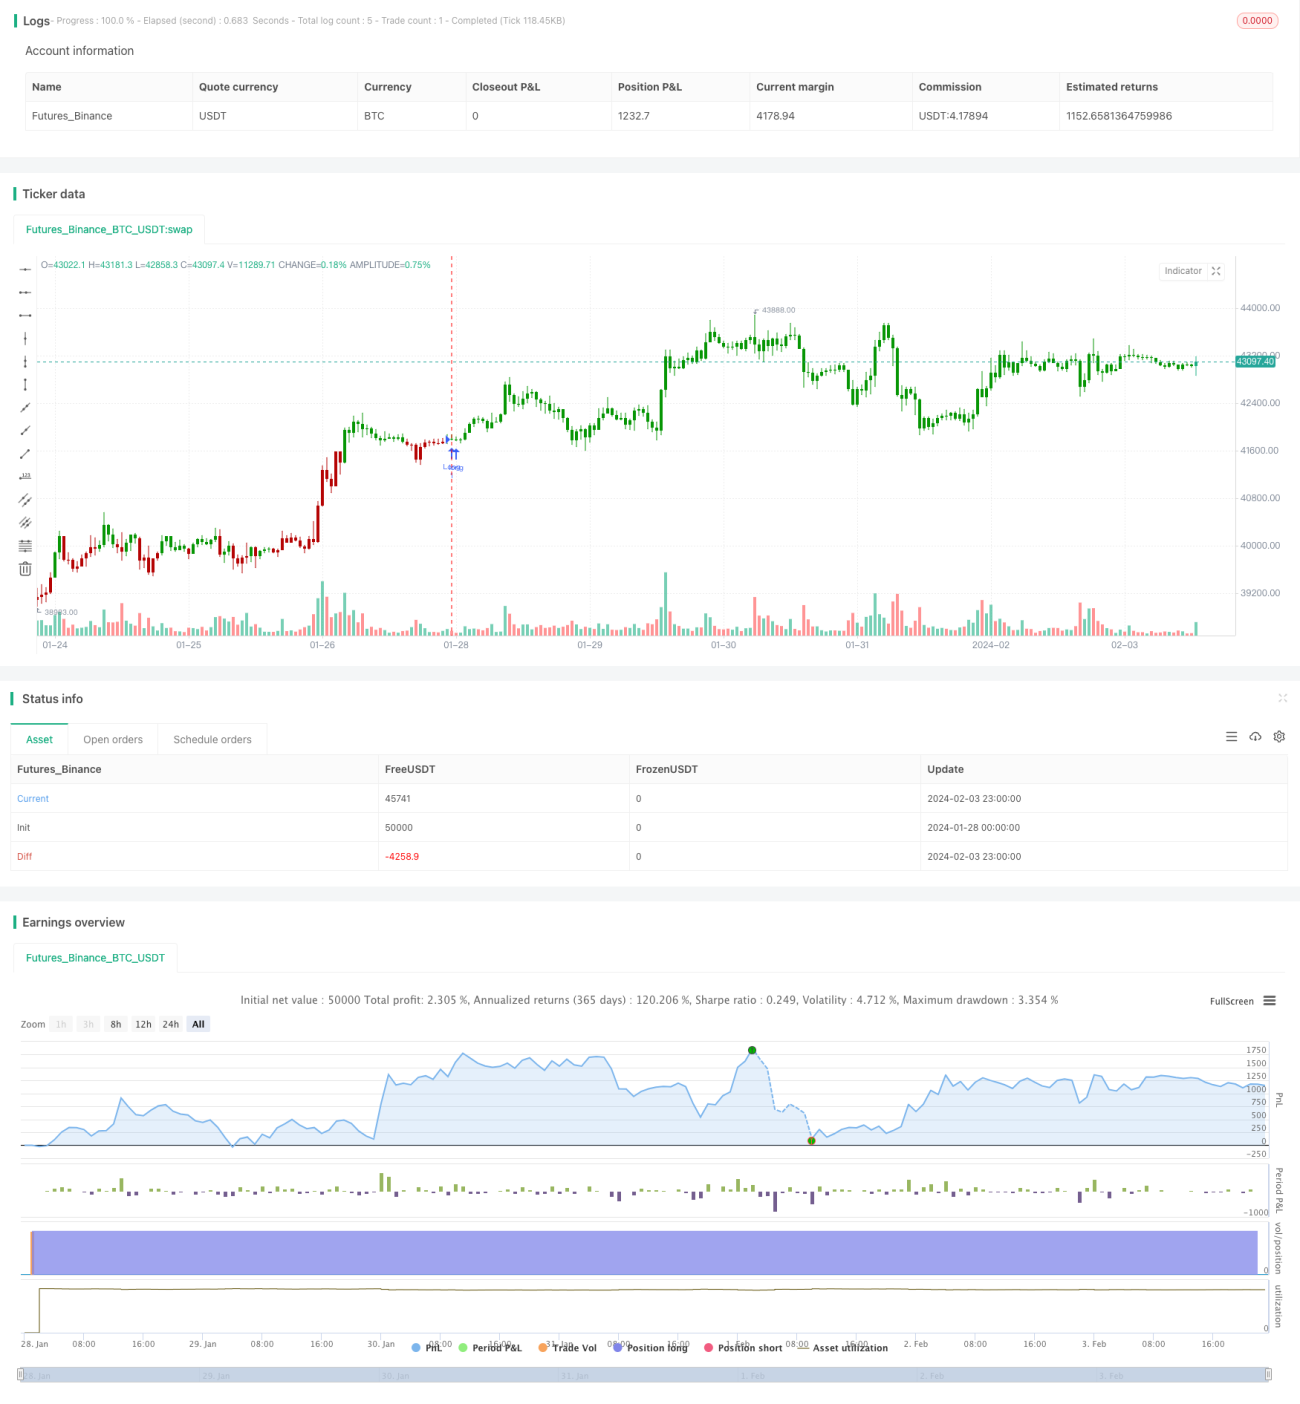
/*backtest
start: 2024-01-28 00:00:00
end: 2024-02-04 00:00:00
period: 1h
basePeriod: 15m
exchanges: [{"eid":"Futures_Binance","currency":"BTC_USDT"}]
*/

//@version=4
////////////////////////////////////////////////////////////
//  Copyright by HPotter v1.0 12/05/2020
// Camarilla pivot point formula is the refined form of existing classic pivot point formula. Strategy parameters
Related strategies
Comment
All comments (0)
No data
- 1