Estrategia de trading cuantitativo basada en el canal SSL y la tendencia de onda

Descripción general
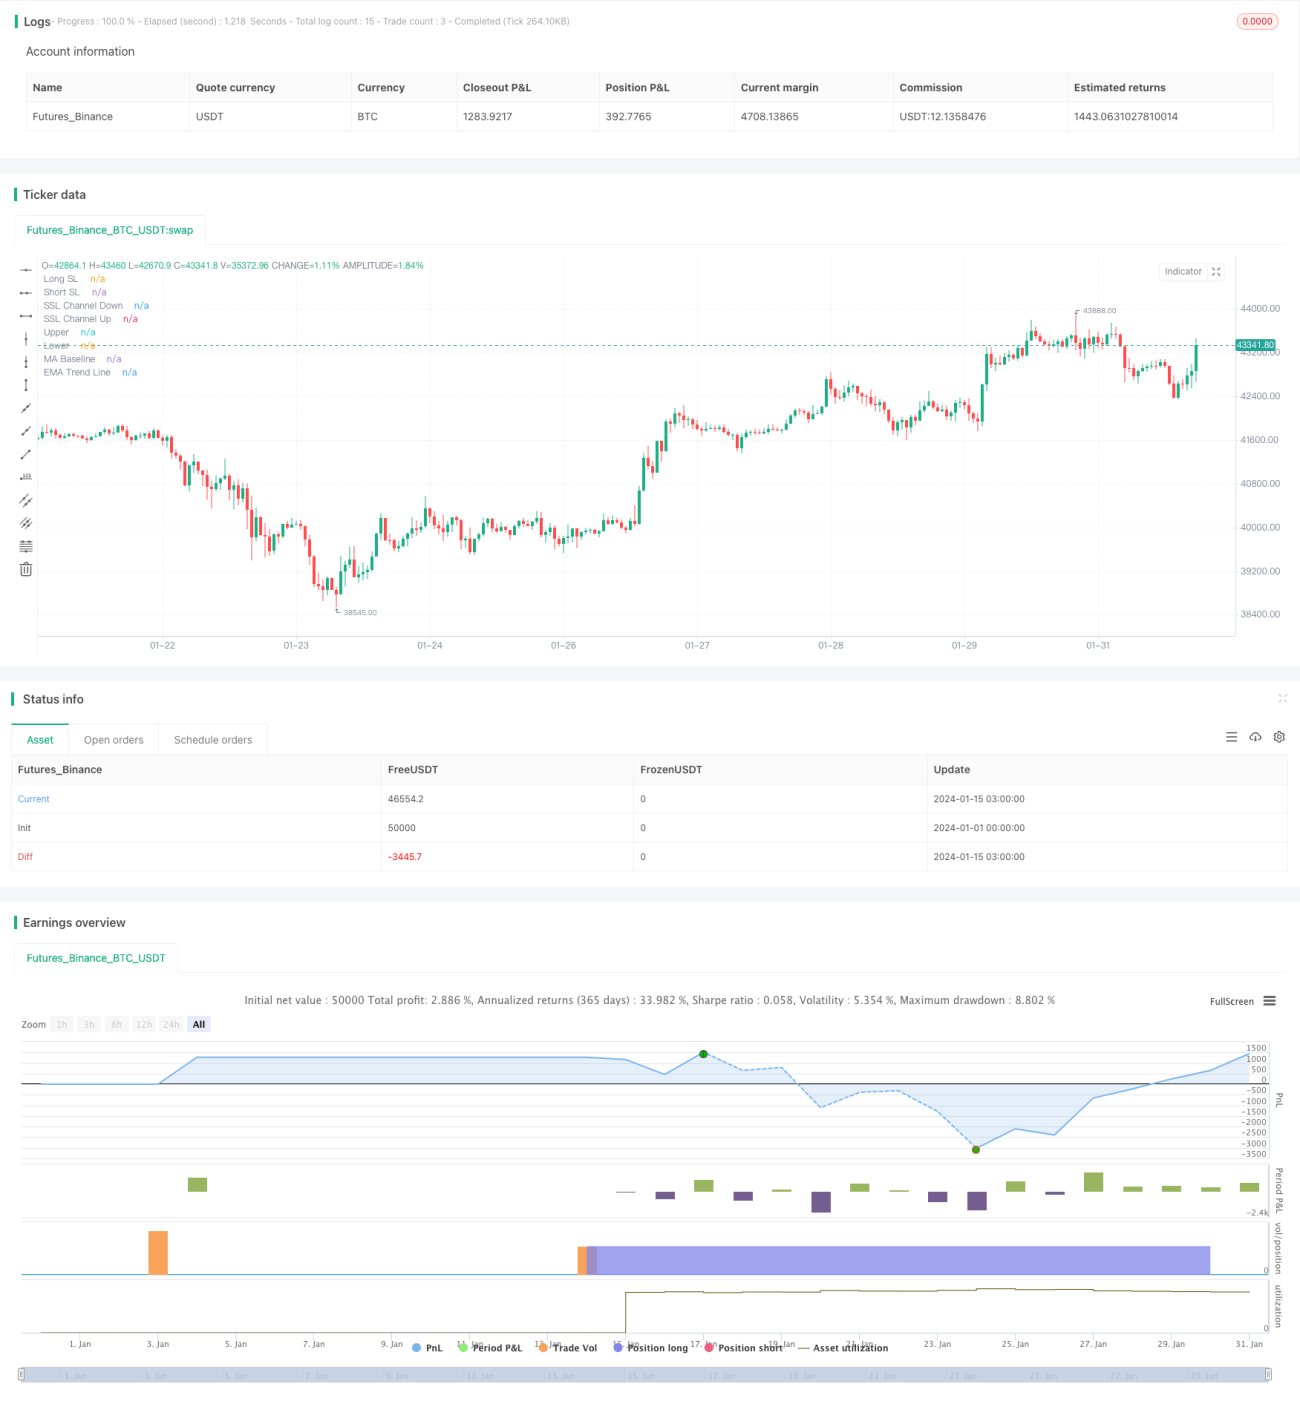
La estrategia se basa principalmente en el indicador de canal SSL y el indicador de tendencias de ondas, en combinación con otros indicadores auxiliares, para lograr una estrategia de comercio cuantitativa más completa. El nombre de la estrategia contiene los indicadores centrales de canal SSL y tendencias de ondas, así como las palabras clave de comercio cuantitativo, que cumplen con los requisitos.
Principio de estrategia
La estrategia se basa en seis condiciones de entrada, de las cuales las dos primeras son las condiciones centrales:
- La línea de base de los indicadores mixtos SSL es azul (al alza) o rojo (a la baja).
- El indicador de la vía SSL se bifurca hacia arriba (a la baja) o hacia abajo (a la baja)
- El indicador de tendencia de ondas se bifurca hacia arriba (a la baja) o hacia abajo (a la baja)
- La línea de entrada K no supera el umbral
- La línea K de entrada está dentro del corredor de Bryn.
- Los puntos de parada no tocan la línea recta
Cuando se cumplen estas seis condiciones, la estrategia entra en juego con una posición de plus o de minus. La distancia de parada se calcula en función de los valores del indicador ATR, y la distancia de parada es el doble de la RRR de la parada.
La estrategia también cuenta con un mecanismo de gestión de riesgos completo, que incluye la configuración de stop loss, el control del tamaño de la posición y el control de la máxima retirada. Además, la estrategia traza líneas auxiliares en el gráfico para ver de forma intuitiva cada punto de parada y parada, así como las pérdidas y ganancias específicas. Esto es muy útil para el análisis y la optimización de la estrategia.
Análisis de las ventajas
La mayor ventaja de esta estrategia es que el uso de los indicadores de la vía SSL para determinar la dirección de la tendencia es muy preciso, y la confirmación de indicadores como la tendencia de la ola puede reducir considerablemente las señales falsas. Al mismo tiempo, las estrictas condiciones de entrada también pueden evitar transacciones innecesarias, lo que reduce el número de transacciones y reduce los costos de transacción.
Además, el sistema de gestión de riesgos y fondos de esta estrategia es una gran ventaja. Una buena estrategia de stop loss y stop-loss preestablecida puede controlar eficazmente la pérdida máxima de una sola operación.
Análisis de riesgos
El mayor riesgo de esta estrategia es que las estrictas condiciones de entrada pueden perder algunas oportunidades de negociación, lo que puede afectar la rentabilidad. La rentabilidad de esta estrategia también se ve afectada cuando el mercado está en un estado de agitación.
Además, los indicadores como la tendencia de las olas que juzgan la eficacia de la tendencia del mercado también pueden verse afectados por anomalías del mercado como la falsa ruptura. En este caso, es necesario ajustar los parámetros o agregar otros indicadores para su confirmación.
En general, el riesgo de la estrategia es controlado. A través de ajustes y optimizaciones de parámetros, la estrategia puede adaptarse mejor a diferentes entornos de mercado.
Dirección de optimización
La estrategia también tiene varias opciones de optimización:
-
Optimización de los parámetros de la tendencia de las olas para determinar con mayor precisión el punto de inflexión de la tendencia
-
Añadir otros indicadores para la confirmación, como KDJ, MACD, etc., para evitar el efecto de la falsa brecha
-
Se pueden ajustar los parámetros de optimización para diferentes variedades y diferentes ciclos para mejorar la estabilidad de la estrategia
-
Agrega algoritmos de aprendizaje automático, utiliza entrenamiento de datos históricos y optimiza los parámetros de la estrategia en tiempo real
-
El uso de algoritmos como el factor de alta frecuencia para aumentar la frecuencia de operaciones y la rentabilidad de las estrategias
Con la implementación de estas medidas de optimización, se espera alcanzar un mayor nivel de rentabilidad y estabilidad de la estrategia.
Resumir
En general, la estrategia integra una variedad de indicadores y un mecanismo de entrada estricto, que garantiza un alto índice de ganancias y un buen efecto de control de riesgos. En combinación con la dirección de optimización futura, la estrategia tiene un gran potencial de desarrollo y es una estrategia de comercio cuantitativa recomendable.
- 1