
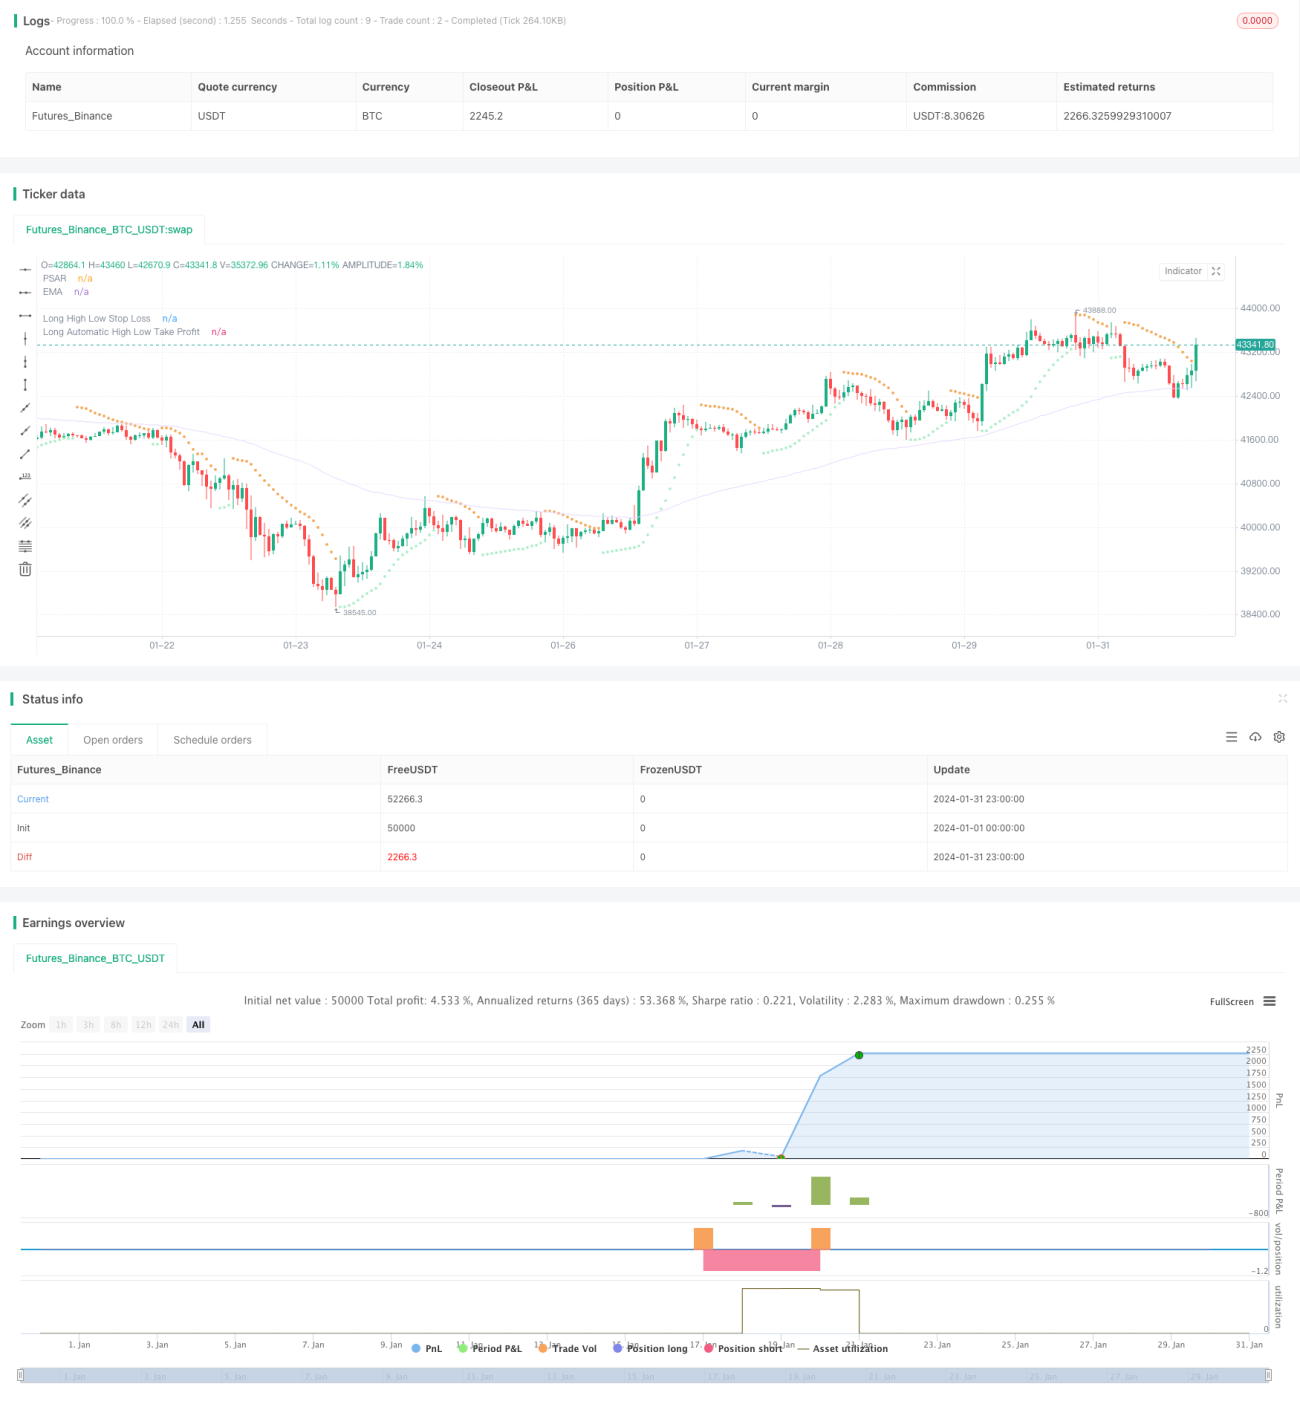
El objetivo de esta estrategia es equilibrar el comportamiento psicológico y comercial de los comerciantes para obtener un rendimiento más estable mediante la configuración de diferentes parámetros. Utiliza indicadores como la línea media, el cinturón de Brin y el canal de Keltner para determinar la tendencia y la volatilidad del mercado, en combinación con el indicador PSAR para determinar la señal de reversión y el indicador de expansión TTM para determinar la dinámica.
La principal lógica de esta estrategia es la siguiente:
Para determinar la tendencia, utilice la línea media de la EMA para determinar la dirección de la tendencia del precio, el precio está en alza por encima de la EMA y baja por debajo
Reversión de juicio: utiliza el PSAR para determinar el punto de cambio de precio. El punto PSAR aparece por encima del precio como una señal de alza y por debajo del precio como una señal de baja
Determinación de la dinámica: utiliza el indicador TTM Squeeze para determinar la volatilidad y la dinámica del mercado. El indicador TTM Squeeze mide la volatilidad mediante la comparación de la anchura de las bandas de Bryn y los canales de Keltner. Exprimir significa que la volatilidad es muy baja.
Genera una señal de negociación: genera una señal de plus cuando el precio atraviesa la línea media EMA, el punto PSAR y el indicador TTM Squeeze desactiva la compresión; genera una señal de plus cuando el precio atraviesa la línea media EMA, el punto PSAR y el indicador TTM Squeeze entra en la compresión
Método de stop loss: utiliza un stop loss de alto y bajo nivel. Multiplica el múltiplo establecido como punto de stop loss según el precio más alto o más bajo del último ciclo determinado
Método de parada: Se utiliza la parada automática de la relación de riesgo-recibo. Se obtiene la parada de acuerdo con la proporción de la distancia del punto de parada al precio actual multiplicado por el parámetro de la relación de riesgo-recibo establecido.
A través de la configuración de parámetros, se puede controlar la frecuencia de las operaciones, la gestión de posiciones, los puntos de parada y los puntos de parada, equilibrando la psicología de las operaciones.
La estrategia tiene las siguientes ventajas:
Los resultados de las pruebas de detección son muy similares a los de las pruebas de diagnóstico.
La inversión es la principal, la tendencia es secundaria, para capturar el punto de inflexión, reducir la probabilidad de que el golpe de alto y bajo, el golpe de bajo y el golpe de bajo
El indicador TTMSqueeze es eficaz para determinar los ajustes en la tendencia y evitar que las transacciones no sean válidas durante el período de ajuste
El método de alto y bajo stop es sencillo y práctico, y la distancia de stop se puede ajustar según el mercado
El método de riesgo-retorno-comparación-deterioro digitalizará la relación de ganancias y pérdidas para facilitar el ajuste
La configuración de los parámetros es flexible y se puede ajustar a las preferencias de riesgo personales
La estrategia también tiene los siguientes riesgos:
La combinación de varios indicadores, aunque mejora la precisión de la señal, también aumenta la probabilidad de saltarse el punto de entrada
Las estrategias basadas en inversiones pueden ser ineficaces en un contexto de tendencia
El alto y bajo límite de pérdidas a veces se supera y no se puede evitar el riesgo por completo
El riesgo-beneficio-resistencia también puede fallar debido a la subida o al ajuste de los precios
La configuración incorrecta de los parámetros puede causar pérdidas o paradas frecuentes
La estrategia se puede optimizar en los siguientes aspectos:
Añadir o ajustar el peso del indicador para que la señal sea más precisa
Optimización de los parámetros de los indicadores de inversión y tendencia para mejorar la probabilidad de obtener ganancias
Optimización de los parámetros de alto y bajo stop para que el stop sea más razonable
Prueba de diferentes proporciones de riesgo-beneficio para obtener mejores resultados
Ajuste de los parámetros del número de posiciones para reducir el impacto de las pérdidas individuales
La estrategia en su conjunto, a través de un conjunto de indicadores de juicio y ajuste de parámetros, puede equilibrar eficazmente la psicología de comercio, obtener un beneficio positivo estable. Aunque todavía hay cierto espacio para el mejoramiento, pero ya tiene un valor de aplicación en el mercado. A través de la retroalimentación del mercado y el ajuste de parámetros, esta estrategia espera ser una herramienta eficaz para controlar la psicología de comercio, obtener ganancias estables a largo plazo.
/*backtest
start: 2024-01-01 00:00:00
end: 2024-01-31 23:59:59
period: 1h
basePeriod: 15m
exchanges: [{"eid":"Futures_Binance","currency":"BTC_USDT"}]
*/
//@version=5
// This source code is subject to the terms of the Mozilla Public License 2.0 at https://mozilla.org/MPL/2.0/
// © simwai
strategy('Octopus Nest Strategy 🐙', shorttitle='🐙', overlay=true )
// -- Colors --
color maximumYellowRed = color.rgb(255, 203, 98) // yellow
color rajah = color.rgb(242, 166, 84) // orange
color magicMint = color.rgb(171, 237, 198)
color languidLavender = color.rgb(232, 215, 255)
color maximumBluePurple = color.rgb(181, 161, 226)
color skyBlue = color.rgb(144, 226, 244)
color lightGray = color.rgb(214, 214, 214)
color quickSilver = color.rgb(163, 163, 163)
color mediumAquamarine = color.rgb(104, 223, 153)
color carrotOrange = color.rgb(239, 146, 46)
// -- Inputs --
float src = input.source(close, 'Choose Source', group='General', inline='1')
bool isSignalLabelEnabled = input.bool(title='Show Signal Labels?', defval=true, group='General', inline='2')
bool isPsarAdaptive = input.bool(title='Is PSAR Adaptive?', defval=false, group='General', inline='2')
float highLowStopLossMultiplier = input.float(defval=0.98, step=0.01, minval=0, maxval=1, title='Multiplier', group='High Low Stop Loss', inline='1')
float highLowStopLossBackupMultiplier = input.float(defval=0.98, step=0.01, minval=0, maxval=1, title='Backup Multiplier', group='High Low Stop Loss', inline='1')
int highLowStopLossLookback = input.int(defval=20, step=5, minval=1, title='Lookback', group='High Low Stop Loss', inline='2')
float automaticHighLowTakeProfitRatio = input.float(defval=1.125, step=0.1, minval=0, title='Risk Reward Ratio', group='Automatic High Low Take Profit', inline='2')
int emaLength = input.int(100, minval=2, title='Length', group='EMA', inline='1')
int ttmLength = input.int(title='Length', defval=20, minval=0, group='TTM Squeeze', inline='1')
float psarStart = input.float(0.02, 'Start', step=0.01, minval=0.0, group='PSAR', inline='1')
float psarInc = input.float(0.02, 'Increment', step=0.01, minval=0.01, group='PSAR', inline='1')
float psarMax = input.float(0.2, 'Max', step=0.05, minval=0.0, group='PSAR', inline='2')
startAFactor = input.float(0.02, 'Starting Acceleration Factor', step = 0.001, group='Adaptive PSAR', inline='1')
minStep = input.float(0.0, 'Min Step', step = 0.001, group='Adaptive PSAR', inline='1')
maxStep = input.float(0.02, 'Max Step', step = 0.001, group='Adaptive PSAR', inline='2')
maxAFactor = input.float(0.2, 'Max Acceleration Factor', step = 0.001, group='Adaptive PSAR', inline='2')
hiloMode = input.string('On', 'HiLo Mode', options = ['Off', 'On'], group='Adaptive PSAR')
adaptMode = input.string('Kaufman', 'Adaptive Mode', options = ['Off', 'Kaufman', 'Ehlers'], group='Adaptive PSAR')
adaptSmth = input.int(5, 'Adaptive Smoothing Period', minval = 1, group='Adaptive PSAR')
filt = input.float(0.0, 'Filter in Pips', group='Adaptive PSAR', minval = 0)
minChng = input.float(0.0, 'Min Change in Pips', group='Adaptive PSAR', minval = 0)
SignalMode = input.string('Only Stops', 'Signal Mode', options = ['Only Stops', 'Signals & Stops'], group='Adaptive PSAR')
// -- Functions --
tr(_high, _low, _close) => math.max(_high - _low, math.abs(_high - _close[1]), math.abs(_low - _close[1]))
// -- Calculation --
var string lastTrade = 'initial'
float _low = low
float _high = high
float _close = close
// -- TTM Squeeze – Credits to @Greeny --
bband(ttmLength, mult) =>
ta.sma(src, ttmLength) + mult * ta.stdev(src, ttmLength)
keltner(ttmLength, mult) =>
ta.ema(src, ttmLength) + mult * ta.ema(tr(_high, _low, _close), ttmLength)
e1 = (ta.highest(_high, ttmLength) + ta.lowest(_low, ttmLength)) / 2 + ta.sma(src, ttmLength)
osc = ta.linreg(src - e1 / 2, ttmLength, 0)
diff = bband(ttmLength, 2) - keltner(ttmLength, 1)
osc_color = osc[1] < osc[0] ? osc[0] >= 0 ? #00ffff : #cc00cc : osc[0] >= 0 ? #009b9b : #ff9bff
mid_color = diff >= 0 ? color.green : color.red
// -- PSAR --
// Credits to @Bjorgum
calcBaseUnit() =>
bool isForexSymbol = syminfo.type == 'forex'
bool isYenPair = syminfo.currency == 'JPY'
float result = isForexSymbol ? isYenPair ? 0.01 : 0.0001 : syminfo.mintick
// Credits to @loxx
_afact(mode,input, per, smooth) =>
eff = 0., seff = 0.
len = 0, sum = 0., max = 0., min = 1000000000.
len := mode == 'Kaufman' ? math.ceil(per) : math.ceil(math.max(20, 5 * per))
for i = 0 to len
if (mode == 'Kaufman')
sum += math.abs(input[i] - input[i + 1])
else
max := input[i] > max ? input[i] : max
min := input[i] < min ? input[i] : min
if (mode == 'Kaufman' and sum != 0)
eff := math.abs(input - input[len]) / sum
else
if (mode == 'Ehlers' and (max - min) > 0)
eff := (input - min) / (max - min)
seff := ta.ema(eff, smooth)
seff
hVal2 = nz(high[2]), hVal1 = nz(high[1]), hVal0 = high
lowVal2 = nz(low[2]), lowVal1 = nz(low[1]), lowVal0 = low
hiprice2 = nz(high[2]), hiprice1 = nz(high[1]), hiprice0 = high
loprice2 = nz(low[2]), loprice1 = nz(low[1]), loprice0 = low
upSig = 0., dnSig = 0.
aFactor = 0., step = 0., trend = 0.
upTrndSAR = 0., dnTrndSAR = 0.
length = (2 / maxAFactor - 1)
if (hiloMode == 'On')
hiprice0 := high
loprice0 := low
else
hiprice0 := src
loprice0 := hiprice0
if bar_index == 1
trend := 1
hVal1 := hiprice1
hVal0 := math.max(hiprice0, hVal1)
lowVal1 := loprice1
lowVal0 := math.min(loprice0, lowVal1)
aFactor := startAFactor
upTrndSAR := lowVal0
dnTrndSAR := 0.
else
hVal0 := hVal1
lowVal0 := lowVal1
trend := nz(trend[1])
aFactor := nz(aFactor[1])
inputs = 0.
inprice = src
if (adaptMode != 'Off')
if (hiloMode == 'On')
inprice := src
else
inprice := hiprice0
if (adaptMode == 'Kaufman')
inputs := inprice
else
if (adaptMode == 'Ehlers')
if (nz(upTrndSAR[1]) != 0.)
inputs := math.abs(inprice - nz(upTrndSAR[1]))
else
if (nz(dnTrndSAR[1]) != 0.)
inputs := math.abs(inprice - nz(dnTrndSAR[1]))
step := minStep + _afact(adaptMode, inputs, length, adaptSmth) * (maxStep - minStep)
else
step := maxStep
upTrndSAR := 0., dnTrndSAR := 0., upSig := 0., dnSig := 0.
if (nz(trend[1]) > 0)
if (nz(trend[1]) == nz(trend[2]))
aFactor := hVal1 > hVal2 ? nz(aFactor[1]) + step : aFactor
aFactor := aFactor > maxAFactor ? maxAFactor : aFactor
aFactor := hVal1 < hVal2 ? startAFactor : aFactor
else
aFactor := nz(aFactor[1])
upTrndSAR := nz(upTrndSAR[1]) + aFactor * (hVal1 - nz(upTrndSAR[1]))
upTrndSAR := upTrndSAR > loprice1 ? loprice1 : upTrndSAR
upTrndSAR := upTrndSAR > loprice2 ? loprice2 : upTrndSAR
else
if (nz(trend[1]) == nz(trend[2]))
aFactor := lowVal1 < lowVal2 ? nz(aFactor[1]) + step : aFactor
aFactor := aFactor > maxAFactor ? maxAFactor : aFactor
aFactor := lowVal1 > lowVal2 ? startAFactor : aFactor
else
aFactor := nz(aFactor[1])
dnTrndSAR := nz(dnTrndSAR[1]) + aFactor * (lowVal1 - nz(dnTrndSAR[1]))
dnTrndSAR := dnTrndSAR < hiprice1 ? hiprice1 : dnTrndSAR
dnTrndSAR := dnTrndSAR < hiprice2 ? hiprice2 : dnTrndSAR
hVal0 := hiprice0 > hVal0 ? hiprice0 : hVal0
lowVal0 := loprice0 < lowVal0 ? loprice0 : lowVal0
if (minChng > 0)
if (upTrndSAR - nz(upTrndSAR[1]) < minChng * calcBaseUnit() and upTrndSAR != 0. and nz(upTrndSAR[1]) != 0.)
upTrndSAR := nz(upTrndSAR[1])
if (nz(dnTrndSAR[1]) - dnTrndSAR < minChng * calcBaseUnit() and dnTrndSAR != 0. and nz(dnTrndSAR[1]) != 0.)
dnTrndSAR := nz(dnTrndSAR[1])
dnTrndSAR := trend < 0 and dnTrndSAR > nz(dnTrndSAR[1]) ? nz(dnTrndSAR[1]) : dnTrndSAR
upTrndSAR := trend > 0 and upTrndSAR < nz(upTrndSAR[1]) ? nz(upTrndSAR[1]) : upTrndSAR
if (trend < 0 and hiprice0 >= dnTrndSAR + filt * calcBaseUnit())
trend := 1
upTrndSAR := lowVal0
upSig := SignalMode == 'Signals & Stops' ? lowVal0 : upSig
dnTrndSAR := 0.
aFactor := startAFactor
lowVal0 := loprice0
hVal0 := hiprice0
else if (trend > 0 and loprice0 <= upTrndSAR - filt * calcBaseUnit())
trend := -1
dnTrndSAR := hVal0
dnSig := SignalMode == 'Signals & Stops' ? hVal0 : dnSig
upTrndSAR := 0.
aFactor := startAFactor
lowVal0 := loprice0
hVal0 := hiprice0
psar = upTrndSAR > 0 ? upTrndSAR : dnTrndSAR
psar := isPsarAdaptive ? psar : ta.sar(psarStart, psarInc, psarMax)
plot(psar, title='PSAR', color=src < psar ? rajah : magicMint, style=plot.style_circles)
// -- EMA --
float ema = ta.ema(src, emaLength)
plot(ema, title='EMA', color=languidLavender)
// -- Signals --
var string isTradeOpen = ''
var string signalCache = ''
bool enterLong = src > ema and ta.crossover(src, psar) and ta.crossover(osc, 0)
bool enterShort = src < ema and ta.crossunder(src, psar) and ta.crossunder(osc, 0)
// bool exitLong = ta.crossunder(src, ema)
// bool exitShort = ta.crossover(src, ema)
if (signalCache == 'long entry')
signalCache := ''
enterLong := true
else if (signalCache == 'short entry')
signalCache := ''
enterShort := true
if (isTradeOpen == '')
if (enterLong)
isTradeOpen := 'long'
else if (enterShort)
isTradeOpen := 'short'
else if (isTradeOpen == 'long')
if (enterLong)
enterLong := false
else if (isTradeOpen == 'short')
if (enterShort)
enterShort := false
plotshape((isSignalLabelEnabled and enterLong and (isTradeOpen == 'long')) ? psar : na, title='LONG', text='L', style=shape.labelup, color=mediumAquamarine, textcolor=color.white, size=size.tiny, location=location.absolute)
plotshape((isSignalLabelEnabled and enterShort and (isTradeOpen == 'short')) ? psar : na, title='SHORT', text='S', style=shape.labeldown, color=carrotOrange, textcolor=color.white, size=size.tiny, location=location.absolute)
// -- High Low Stop Loss and Take Profit --
bool isHighLowStopLossEnabled = true
bool isAutomaticHighLowTakeProfitEnabled = true
bool recalculateStopLossTakeProfit = false
bool isStrategyEntryEnabled = false
bool isLongEnabled = true
bool isShortEnabled = true
bool isStopLossTakeProfitRecalculationEnabled = true
bool longStopLossTakeProfitRecalculation = isStopLossTakeProfitRecalculationEnabled ? true : (lastTrade == 'short' or lastTrade == 'initial')
bool shortStopLossTakeProfitRecalculation = isStopLossTakeProfitRecalculationEnabled ? true : (lastTrade == 'long' or lastTrade == 'initial')
var float longHighLowStopLoss = 0
var float shortHighLowStopLoss = 0
float highLowStopLossLowest = ta.lowest(_low, highLowStopLossLookback)
float highLowStopLossHighest = ta.highest(_high, highLowStopLossLookback)
if (isHighLowStopLossEnabled)
if (((enterLong and longStopLossTakeProfitRecalculation) or recalculateStopLossTakeProfit) and (isStrategyEntryEnabled ? not(strategy.position_size > 0) : true))
if (highLowStopLossLowest == _low)
longHighLowStopLoss := _high * highLowStopLossBackupMultiplier
else if (highLowStopLossLowest > 0)
longHighLowStopLoss := highLowStopLossLowest * highLowStopLossMultiplier
if (((enterShort and shortStopLossTakeProfitRecalculation) or recalculateStopLossTakeProfit) and (isStrategyEntryEnabled ? not(strategy.position_size < 0) : true))
if (highLowStopLossHighest == _high)
shortHighLowStopLoss := _high * (1 + (1 - highLowStopLossBackupMultiplier))
else if (highLowStopLossHighest > 0)
shortHighLowStopLoss := highLowStopLossHighest * (1 + (1 - highLowStopLossMultiplier))
plot((isLongEnabled and isHighLowStopLossEnabled and (isTradeOpen == 'long')) ? longHighLowStopLoss : na, 'Long High Low Stop Loss', color=magicMint, style=plot.style_circles, trackprice=false)
plot((isShortEnabled and isHighLowStopLossEnabled and (isTradeOpen == 'short')) ? shortHighLowStopLoss : na, 'Short High Low Stop Loss ', color=rajah, style=plot.style_circles, trackprice=false)
// -- Automatic High Low Take Profit --
var float longAutomaticHighLowTakeProfit = na
var float shortAutomaticHighLowTakeProfit = na
if (isAutomaticHighLowTakeProfitEnabled)
if (((enterLong and longStopLossTakeProfitRecalculation) or recalculateStopLossTakeProfit) and (isStrategyEntryEnabled ? not(strategy.position_size > 0) : true))
longHighLowStopLossPercentage = 1 - (longHighLowStopLoss / _close)
longAutomaticHighLowTakeProfit := _close * (1 + (longHighLowStopLossPercentage * automaticHighLowTakeProfitRatio))
if (((enterShort and shortStopLossTakeProfitRecalculation) or recalculateStopLossTakeProfit) and (isStrategyEntryEnabled ? not(strategy.position_size > 0) : true))
shortHighLowStopLossPercentage = 1 - (_close / shortHighLowStopLoss)
shortAutomaticHighLowTakeProfit := _close * (1 - (shortHighLowStopLossPercentage * automaticHighLowTakeProfitRatio))
plot((isAutomaticHighLowTakeProfitEnabled and isHighLowStopLossEnabled and (isTradeOpen == 'long')) ? longAutomaticHighLowTakeProfit : na, 'Long Automatic High Low Take Profit', color=magicMint, style=plot.style_circles, trackprice=false)
plot((isAutomaticHighLowTakeProfitEnabled and isHighLowStopLossEnabled and (isTradeOpen == 'short')) ? shortAutomaticHighLowTakeProfit : na, 'Short Automatic High Low Take Profit', color=rajah, style=plot.style_circles, trackprice=false)
// log.info('Automatic Long High Low Take Profit: ' + str.tostring(longAutomaticHighLowTakeProfit))
// log.info('Automatic Short High Low Take Profit: ' + str.tostring(shortAutomaticHighLowTakeProfit))
// log.info('Long High Low Stop Loss: ' + str.tostring(longHighLowStopLoss))
// log.info('Short High Low Stop Loss: ' + str.tostring(shortHighLowStopLoss))
bool longHighLowStopLossCondition = ta.crossunder(_close, longHighLowStopLoss)
bool shortHighLowStopLossCondition = ta.crossover(_close, shortHighLowStopLoss)
bool longAutomaticHighLowTakeProfitCondition = ta.crossover(_close, longAutomaticHighLowTakeProfit)
bool shortAutomaticHighLowTakeProfitCondition = ta.crossunder(_close, shortAutomaticHighLowTakeProfit)
bool exitLong = (longHighLowStopLossCondition or longAutomaticHighLowTakeProfitCondition) and strategy.position_size > 0
bool exitShort = (shortHighLowStopLossCondition or shortAutomaticHighLowTakeProfitCondition) and strategy.position_size < 0
plotshape((isSignalLabelEnabled and exitLong and (isTradeOpen == 'long')) ? psar : na, title='LONG EXIT', style=shape.circle, color=magicMint, size=size.tiny, location=location.absolute)
plotshape((isSignalLabelEnabled and exitShort and (isTradeOpen == 'short')) ? psar : na, title='SHORT EXIT', style=shape.circle, color=rajah, size=size.tiny, location=location.absolute)
// Long Exits
if (exitLong)
strategy.close('long', comment=longAutomaticHighLowTakeProfitCondition ? 'EXIT_LONG_TP' : 'EXIT_LONG_SL')
isTradeOpen := ''
// Short Exits
if (exitShort)
strategy.close('short', comment=shortAutomaticHighLowTakeProfitCondition ? 'EXIT_SHORT_TP' : 'EXIT_SHORT_SL')
isTradeOpen := ''
// Long Entries
if (enterLong and (strategy.position_size == 0))
strategy.entry('long', strategy.long, comment='ENTER_LONG')
// Short Entries
if (enterShort and (strategy.position_size == 0))
strategy.entry('short', strategy.short, comment='ENTER_SHORT')
// Save last trade state
if (enterLong or exitLong)
lastTrade := 'long'
if (enterShort or exitShort)
lastTrade := 'short'
barcolor(color=isTradeOpen == 'long' ? mediumAquamarine : isTradeOpen == 'short' ? carrotOrange : na)