Estrategia de cruce de líneas rápidas y lentas de doble EMA
Descripción general
La estrategia de cruce de doble EMA es una estrategia de comercio cuantitativa basada en el cruce de la línea media de EMA de dos períodos diferentes para abrir y cerrar posiciones. La estrategia es simple, efectiva y fácil de entender, y es una estrategia de comercio cuantitativa de uso común.
Principio de estrategia
La estrategia utiliza dos líneas medias de EMA, una línea EMA de 25 ciclos como línea rápida y otra de 50 ciclos como línea lenta. Cuando la línea rápida atraviesa la línea lenta, haga más; cuando la línea rápida atraviesa la línea lenta, haga vacío.
Después de hacer más, configure el stop-loss como el 2% del precio de entrada, el stop-loss como el 2% del precio de entrada, y cuando el precio alcance el stop-loss o el stop-loss, apague la posición.
El núcleo de esta estrategia es utilizar el cruce de las líneas rápidas y lentas de EMA para determinar la tendencia y la reversión del mercado. Al subir, juzgar como un mercado alcista y hacer más, al bajar, juzgar como un mercado bajista y hacer vacío. La configuración de stop loss para bloquear las ganancias y controlar el riesgo.
Análisis de las ventajas
La estrategia de cruce de líneas de doble EMA tiene las siguientes ventajas:
- La idea es clara, la lógica es simple, la implementación es fácil de entender.
- El uso de la línea rápida y la línea lenta en conjunto permite capturar tendencias de línea corta y media.
- En la actualidad, el mercado de la tecnología de la información está creciendo rápidamente, y el mercado de la información está creciendo rápidamente.
- El riesgo está controlado y el Stop Loss es razonable.
En general, la estrategia utiliza una lógica clara para juzgar el mercado y aprovechar las ventajas de la propia EMA para obtener una buena ganancia de corto y medio plazo con un riesgo controlado.
Análisis de riesgos
La estrategia de cruce de líneas de doble EMA también tiene algunos riesgos:
- Cuando el mercado fluctúa fuertemente, las señales de cruce de líneas de la EMA pueden ser inexactas y existe la probabilidad de que sean mal interpretadas.
- Si el punto de parada no se establece razonablemente, se puede perder un mercado más grande o asumir una pérdida mayor.
- El impacto de las comisiones de transacción y los puntos de deslizamiento no puede ser ignorado.
Estos riesgos pueden ser optimizados de la siguiente manera:
- En combinación con otros indicadores para juzgar el mercado, evitar las señales de error de la EMA cruzada.
- Prueba y optimiza los puntos de ajuste de la parada de pérdidas para encontrar el equilibrio entre los beneficios y los riesgos.
- Elegir plataformas de intercambio con tarifas bajas y aumentar el volumen de transacciones adecuadamente.
Dirección de optimización
La estrategia también tiene las siguientes principales direcciones de optimización:
- Optimización de los parámetros de ciclo de la EMA para encontrar la combinación óptima de parámetros.
- Aumentar el conocimiento de otros indicadores para formar una cartera de operaciones y mejorar la precisión.
- Ajuste dinámico del punto de parada. El seguimiento del punto de parada se amplifica cuando las pérdidas alcanzan una cierta amplitud, el punto de parada se mueve cuando las ganancias alcanzan una cierta amplitud, etc.
- Distinguir entre el mercado de capas múltiples y el mercado de capas vacías, y hacer transacciones orientadas.
Estas optimizaciones pueden mejorar la rentabilidad y la tasa de ganancias, a la vez que mantienen la estrategia simple y clara.
Resumir
La estrategia de cruce de líneas de doble EMA es una estrategia de comercio cuantitativa muy práctica en general. Es fácil de entender y implementar, capta eficazmente las tendencias del mercado. También tiene cierto espacio de optimización, y puede aumentar aún más la rentabilidad mediante el ajuste y la combinación de parámetros. Esta idea de estrategia simple y directa vale la pena que los inversores aprendan y apliquen.
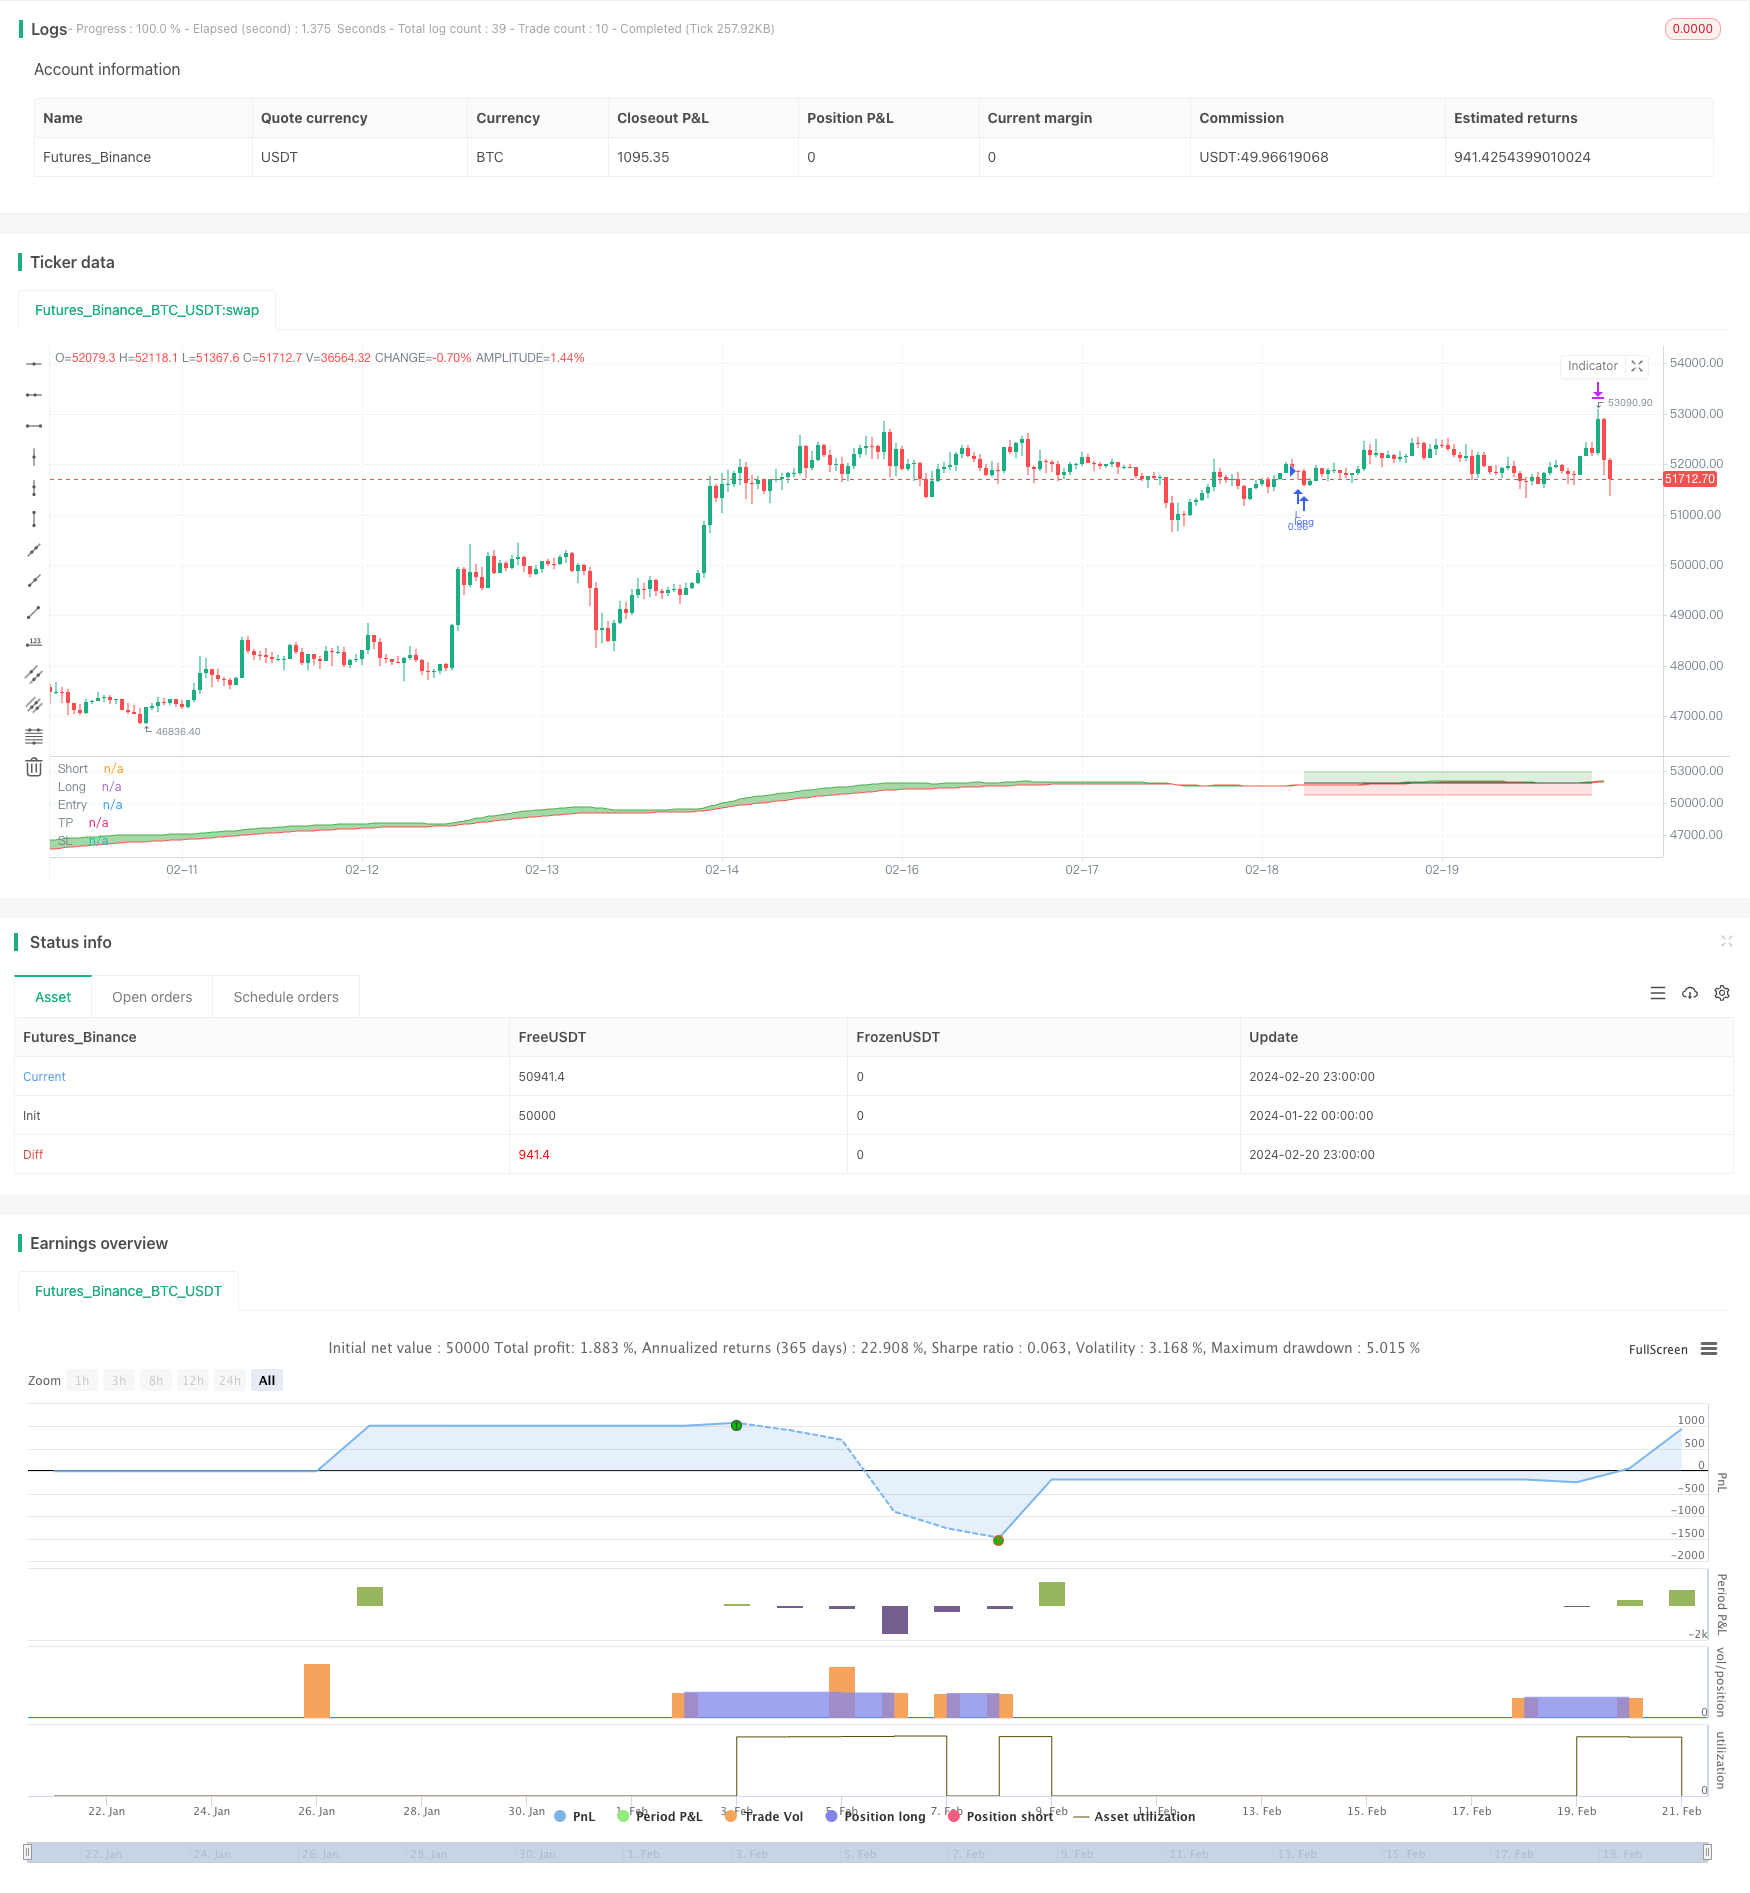
/*backtest
start: 2024-01-22 00:00:00
end: 2024-02-21 00:00:00
period: 1h
basePeriod: 15m
exchanges: [{"eid":"Futures_Binance","currency":"BTC_USDT"}]
*/

// SEMA-X(SEMA CROSS) [AB] : Simple EMA cross strategy Alert & Backtest
// 1. 2 EMA cross
// 2. Next candle entry
// 3. TP & SL

//@version=5
strategy("SEMA-X", "SEMA-X", overlay=false, margin_long=1,
 initial_capital=1000000, default_qty_type=strategy.percent_of_equity, default_qty_value=100,
 commission_type=strategy.commission.percent, commission_value=0.075, slippage=3)

//****************************************************************************//
// Input
//****************************************************************************//
// EMA length
emaLen25 = input.int(25, "Short", minval=1, confirm=true, group="[EMA]----------", inline="1")
emaLen50 = input.int(50, "Long",  minval=1, confirm=true, group="[EMA]----------", inline="1")

// TP & SL
isLong   = input.bool(true, "Long - ",    confirm=true, group="[TP & SL(%)]----------", inline="1")
tpLong   = input.float(2, "TP", minval=0, confirm=true, group="[TP & SL(%)]----------", inline="1")*0.01
slLong   = input.float(2, "SL", minval=0, confirm=true, group="[TP & SL(%)]----------", inline="1")*0.01
isShort  = input.bool(false, "Short - ",  confirm=true, group="[TP & SL(%)]----------", inline="2")
tpShort  = input.float(2, "TP", minval=0, confirm=true, group="[TP & SL(%)]----------", inline="2")*0.01
slShort  = input.float(2, "SL", minval=0, confirm=true, group="[TP & SL(%)]----------", inline="2")*0.01

// Backtest period
sTime = input(timestamp("0001-01-01"), "Start", group="[Backtest]----------")
eTime = input(timestamp("9999-01-01"), "End",   group="[Backtest]----------")
inDateRange   = true
periodBg      = input.bool(false, "Backtest BGcolor", confirm=true, group="[Backtest]----------", inline="1")
bgLong        = input.bool(false, "Position BGcolor", confirm=true, group="[Backtest]----------", inline="1")
periodBgColor = periodBg and inDateRange ? color.new(color.green, 95) : na
bgcolor(periodBgColor, title="Backtest BGcolor")
bgColorLong   = bgLong and strategy.position_size>0 ? color.new(color.green, 95) : na
bgcolor(bgColorLong, title="Position BGcolor")

// IRISBOT
exchange = input.string("binance",  "Exchange", confirm=true, group="[IRISBOT]----------", inline="2", options=["binance", "bybit", "upbit"])
account  = input.string("account1", "Account",  confirm=true, group="[IRISBOT]----------", inline="2")
symbol   = input.string("BTC/USDT", "Symbol",   confirm=true, group="[IRISBOT]----------", inline="3")
strategy = input.string("sema-x",   "Strategy", confirm=true, group="[IRISBOT]----------", inline="3")
token    = input.string("token",    "Token",    confirm=true, group="[IRISBOT]----------", inline="4")
stRatio  = input.float(100.0,       "Ratio(%)", confirm=true, group="[IRISBOT]----------", inline="5", tooltip="하나의 거래소에서 이 전략을 몇 % 비중으로 투자할 것인가?") * 0.01
leverage = input.float(1,           "Leverage", confirm=true, group="[IRISBOT]----------", inline="5")
isPlotMsg = input.bool(false, "View alert msg", confirm=true, group="[IRISBOT]----------", inline="6")

//****************************************************************************//
// Process
//****************************************************************************//
ema25=ta.ema(close, emaLen25)
ema50=ta.ema(close, emaLen50)

// Entry condition
longCondition  = isLong and ta.crossover(ema25, ema50)
shortCondition = isShort and ta.crossunder(ema25, ema50)

// Entry price
var price=0.0
var pricePlot=0.0
if (longCondition or shortCondition) and strategy.position_size == 0
    price:=close
pricePlot:=price
if (strategy.position_size==0)
    pricePlot:=na

// Amount
amount = str.tostring(stRatio*100)

// IRISBOT alert msg (for auto trading, you can change this for autoview, tvextbot, thanksbot, etc webhookbot)
msgLong  = '{"exchange":"'+exchange+'","account":"'+account+'","strategy":"'+strategy+'","symbol":"'+symbol+'","type":"market","side":"buy","amount":"'+amount+'%","leverage":"'+str.tostring(leverage)+'","token":"'+token+'"}'
msgShort = '{"exchange":"'+exchange+'","account":"'+account+'","strategy":"'+strategy+'","symbol":"'+symbol+'","type":"market","side":"sell","amount":"'+amount+'%","leverage":"'+str.tostring(leverage)+'","token":"'+token+'"}'
msgExit  = '{"exchange":"'+exchange+'","account":"'+account+'","strategy":"'+strategy+'","symbol":"'+symbol+'","type":"market","side":"close","token":"'+token+'"}'

// Entry signal
if inDateRange
    strategy.entry("L", strategy.long,  when=longCondition,  comment="L", alert_message=msgLong)
    strategy.entry("S", strategy.short, when=shortCondition, comment="S", alert_message=msgShort)
    strategy.exit("XL", "L", profit=price*tpLong/syminfo.mintick,  loss=price*slLong/syminfo.mintick,  comment="X", alert_message=msgExit)
    strategy.exit("XS", "S", profit=price*tpShort/syminfo.mintick, loss=price*slShort/syminfo.mintick, comment="X", alert_message=msgExit)

//****************************************************************************//
// Plot
//****************************************************************************//
// Alert msg plot
var msgTable = table.new(position = position.bottom_right, columns = 2, rows = 3, bgcolor = color.new(color.blue, 80), border_width = 1)
if isPlotMsg
    if isLong
        table.cell(msgTable, 0, 0, "Long",  text_halign = text.align_left)
        table.cell(msgTable, 1, 0, msgLong,  text_halign = text.align_left)

    if isShort
        table.cell(msgTable, 0, 1, "Short", text_halign = text.align_left, bgcolor=color.new(color.red, 80))
        table.cell(msgTable, 1, 1, msgShort, text_halign = text.align_left, bgcolor=color.new(color.red, 80))

    if isLong or isShort
        table.cell(msgTable, 0, 2, "Exit",  text_halign = text.align_left, bgcolor=color.new(color.purple, 80))
        table.cell(msgTable, 1, 2, msgExit,  text_halign = text.align_left, bgcolor=color.new(color.purple, 80))

// EMA
e0=plot(ema25, "Short", color.green)
e1=plot(ema50, "Long", color.red)
fill(e0, e1, ema25>ema50 ? color.new(color.green, 50) : color.new(color.red, 50), "EMA BG")

// TP & SL
p0=plot(pricePlot, "Entry", color.black, style=plot.style_linebr)
p1=plot(pricePlot*(strategy.position_size>0 ? 1+tpLong : 1-tpShort), "TP", color.new(color.green, 50), style=plot.style_linebr)
p2=plot(pricePlot*(strategy.position_size>0 ? 1-slLong : 1+slShort), "SL", color.new(color.red, 50), style=plot.style_linebr)
fill(p0, p1, color.new(color.green, 80), "TP BG")
fill(p0, p2, color.new(color.red, 80), "SL BG")