Estrategia de ruptura de banderas
Descripción general
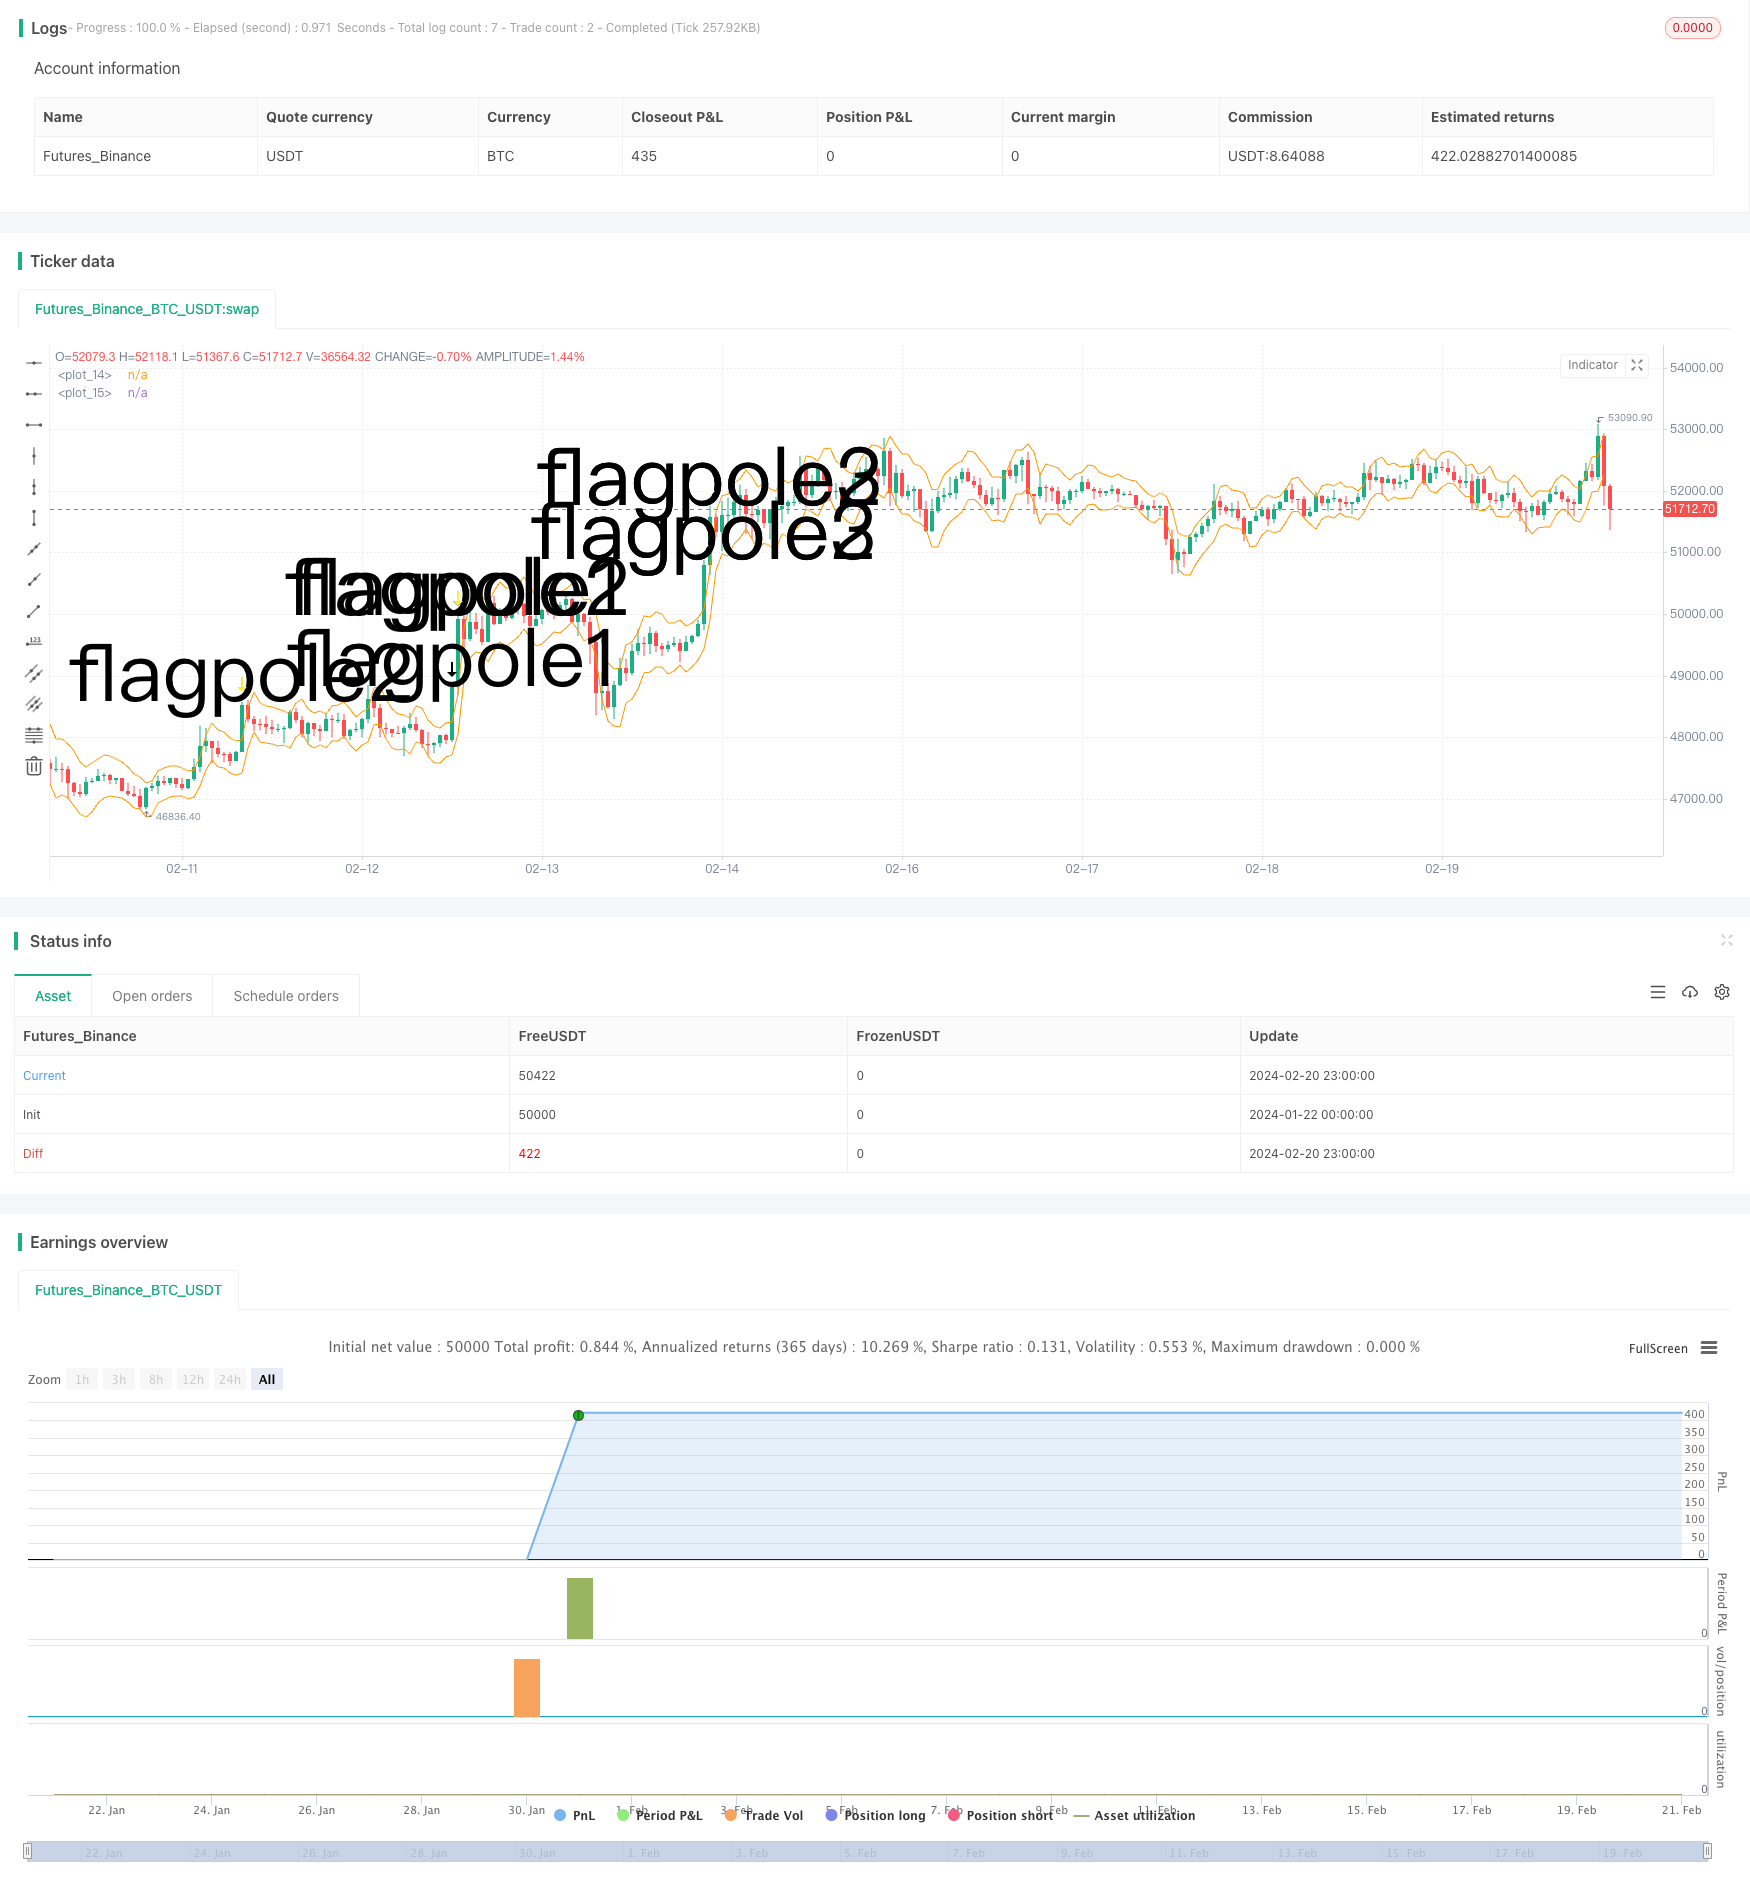
La estrategia de breakout de bandera es una estrategia de análisis técnico que tiene como objetivo capturar el comienzo de una tendencia mediante la identificación de un gráfico de bandera y la entrada en el punto de ruptura. La estrategia utiliza el indicador de medias reales de rango de fluctuación (ATR) para auxiliar en el juicio, para juzgar el rango de bandera después de la barra de bandera definida y así seleccionar las oportunidades de entrada.
Principio de estrategia
La estrategia se divide en los siguientes pasos:
- Determinar el estandarte: Necesidad de satisfacer la innovación de precios y el desafío de romper el canal ATR.
- Determinar la altura de la bandera: medir la distancia entre la cima de la bandera y la SMA anterior.
- Determinación del rango de la bandera: el punto más bajo de la bandera es el 33% de la altura del asta, como el rango mínimo de la bandera.
- Determina el tipo de bandera: determina si las 3 primeras líneas K están todas dentro de la bandera.
- Entradas: más cuando aparecen las banderas.
- Salida: liquidación después de la tenencia fija de 6 líneas K.
Al juzgar la barra y la bandera, la estrategia utiliza hábilmente el indicador ATR para juzgar las brechas evidentes y limita estrictamente la altura de la bandera dentro del 33% de la altura de la barra, evitando demasiadas falsas señales. Además, juzgar que 3 líneas K consecutivas forman la bandera es más confiable. En general, las reglas de la estrategia están diseñadas rigurosamente y tienen una cierta ventaja en la captura de brechas tempranas de la tendencia.
Análisis de las ventajas
La estrategia tiene las siguientes ventajas:
- El uso de la estructura de bandera para determinar tendencias es el método más clásico en el análisis técnico, con una mayor tasa de éxito.
- Los indicadores ATR y las restricciones estrictas de rango evitan una gran cantidad de falsos señales y mejoran la precisión de entrada.
- La salida fija de 6 líneas K puede bloquear parte de las ganancias, evitando el riesgo de que la tendencia se invierta.
- Las reglas de la estrategia son claras, fáciles de implementar, de aprender y de seguir.
- La flexibilidad es la mejor manera de buscar oportunidades en cualquier situación.
Análisis de riesgos
Los principales riesgos de la estrategia incluyen:
- La bandera no puede juzgar completamente las tendencias, y hay casos de fracasos.
- La salida de la línea 6K es demasiado arbitraria y podría ser prematura.
- Cuando la situación es demasiado agitada, es fácil que se produzcan falsas banderas.
- No hay control efectivo de las pérdidas individuales
Para los riesgos anteriores, podemos establecer una estrategia de stop loss, o optimizar el mecanismo de salida, para obtener ganancias a tiempo cuando los beneficios alcanzan una cierta proporción. Además, podemos filtrar junto con otros indicadores para evitar falsas señales cuando la situación es demasiado volátil.
Dirección de optimización
La estrategia puede ser optimizada en las siguientes direcciones:
- La combinación de indicadores como MACD, KD, etc., evita falsas señales en situaciones de temblor.
- La multiplicación de ATR, el ciclo de salida, etc., según la categoría de mercado, hace que la estrategia sea más adaptable.
- Establecer un stop loss móvil o considerar el retiro de ganancias en lugar de una salida dinámica.
- En este caso, el uso de un método de aprendizaje automático (machine learning) para encontrar características más precisas para determinar la altura de la bandera.
- Evaluación de las tasas reales de ganancias y pérdidas, ajuste dinámico del tamaño de la posición.
Resumir
En general, la estrategia de ruptura de bandera utiliza la tendencia de la determinación de la configuración tecnológica para comenzar, es un método más clásico, la estrategia es realmente rigurosa en el diseño de las reglas de entrada y puede filtrar una gran cantidad de falsas señales. Sin embargo, el control de riesgo y el mecanismo de salida todavía hay espacio para la optimización, que podemos considerar desde una perspectiva global, para que la estrategia funcione de manera estable en diferentes mercados. Si se comprueba y optimiza adecuadamente, la estrategia puede convertirse en un componente valioso en el sistema de comercio cuantitativo.
/*backtest
start: 2024-01-22 00:00:00
end: 2024-02-21 00:00:00
period: 1h
basePeriod: 15m
exchanges: [{"eid":"Futures_Binance","currency":"BTC_USDT"}]
*/

// © smith26
//This strategy enters on a bull flag and closes position 6 bars later.  Average true range is used instead of a moving average.
//The reason for ATR instead of MA is because with volatile securities, the flagpole must stand up a noticable "distance" above the trading range---which you can't determine with a MA alone.
//This is broken up into multiple parts: Defining a flagpole, defining the pole height, and defining the flag, which will be constrained to the top third (33%) of the pole height to be considered a flag.
//@version=4
strategy("Bull Flag v1.00", overlay=true)

ATR = atr(10) //Average True Range over last 10 bars.

upperATR = ohlc4[1] + ATR[1]  //Open + High + Low + Close divided by 4, + prior ATR.  Just used here for visually plotting the ATR upper channel.
lowerATR = ohlc4[1] - ATR[1] //Open + High + Low + Close divided by 4, - prior ATR.  Just used here for visually plotting the ATR lower channel.

//uncomment these two lines to see ATR channels
plot(upperATR, color=color.orange)
plot (lowerATR, color=color.orange)

//Current close higher than previous close, and current close minus current open is greater than 3 times the previous ATR.  "3x ATR" is chosen because any less was not a noticeable distance above the trading range.
flagpole1 = close>close[1] and (close-open) > (ATR[1] * 3)
plotshape(flagpole1, text="flagpole1", style=shape.arrowdown, size=size.huge) //Plots an arrow for flagpole1 for QA testing

//Two consecutive close higer than their previous close, and current close minus PREVIOUS open is greater than 3 times the previous ATR.
flagpole2 = close>close[1] and close[1]>close[2] and (close-open[1]) > (ATR[1] * 3)
plotshape(flagpole2, text="flagpole2", style=shape.arrowdown, size=size.huge, color=color.yellow) //Plots an arrow for flagpole2 for QA testing

//Three consecutive close higer than their previous close, and current close minus open from 2 bars ago is greater than 3 times the previous ATR.
flagpole3 = close>close[1] and close[1]>close[2] and close[2]>close[3] and (close-open[2]) > (ATR[1] * 3)
plotshape(flagpole3, text="flagpole3", style=shape.arrowdown, size=size.huge, color=color.white) //Plots an arrow for flagpole3 for QA testing

//A flagpole can be any of the three definitions of flagpole.
flagpole = flagpole1 or flagpole2 or flagpole3

//This will return the number of bars since "flagpole" was true.  Not being used, but could be useful.
//since_flagpole = barssince(flagpole)

after_pole_1 = flagpole[1] //This marks the bar directly after a flagpole.
//plotshape(after_pole_1, text="after_pole_1", style=shape.cross, size=size.large, color=color.white) //Plots a cross for after_pole_1 for QA testing
after_pole_2 = flagpole[2] //This marks the bar two bars after a flagpole.
after_pole_3 = flagpole[3] //This marks the bar three bars after a flagpole.

//This returns the price at the "top" of the flagpole (using close price) at the most recent occurence, 0.
pole_top = valuewhen(flagpole, close, 0)
//plot(pole_top, trackprice=true)  //plots a horizontal line at the most recent pole_top

//Measures the distance between last pole top and the previous SMA.
pole_height = pole_top - sma(close, 10)[1]
//plot(pole_height)

//This marks 33% below the pole_top, which will be the lowest point a flag can be.
flag_bottom = pole_top - (.33 * pole_height)
//plot(flag_bottom)

//The first, second, and third bars after the pole are considered part of a flag when open and close are between the pole_top and flag_bottom
flag1 = after_pole_1 and (open >= flag_bottom) and (open <= pole_top) and (close >= flag_bottom) and (close <= pole_top)
//plotshape(flag1, text="flag1", style=shape.flag, size=size.large, color=color.teal)
flag2 = after_pole_2 and (open >= flag_bottom) and (open <= pole_top) and (close >= flag_bottom) and (close <= pole_top)
//plotshape(flag2, text="flag2", style=shape.flag, size=size.large, color=color.teal)
flag3 = after_pole_3 and (open >= flag_bottom) and (open <= pole_top) and (close >= flag_bottom) and (close <= pole_top)
//plotshape(flag3, text="flag3", style=shape.flag, size=size.large, color=color.teal)

//When all three bars after a flagpole are a flag, the criteria are met and we have a "bull_flag"
//Specifically, when current bar is flag3, previous bar is flag2, and 2 bars ago is flag1, we have a bull_flag.
bull_flag = flag3 and flag2[1] and flag1[2]
plotshape(bull_flag, text="bull_flag", style=shape.flag, size=size.large, color=color.white) //Plots a flag for bull_flag for QA testing


if (bull_flag)
    strategy.entry("Long", strategy.long)

if barssince(bull_flag) == 6 //close 6 bars after entry.
    strategy.close("Long")