Estrategia de trading multi-temporal basada en el indicador de compresión

Descripción general
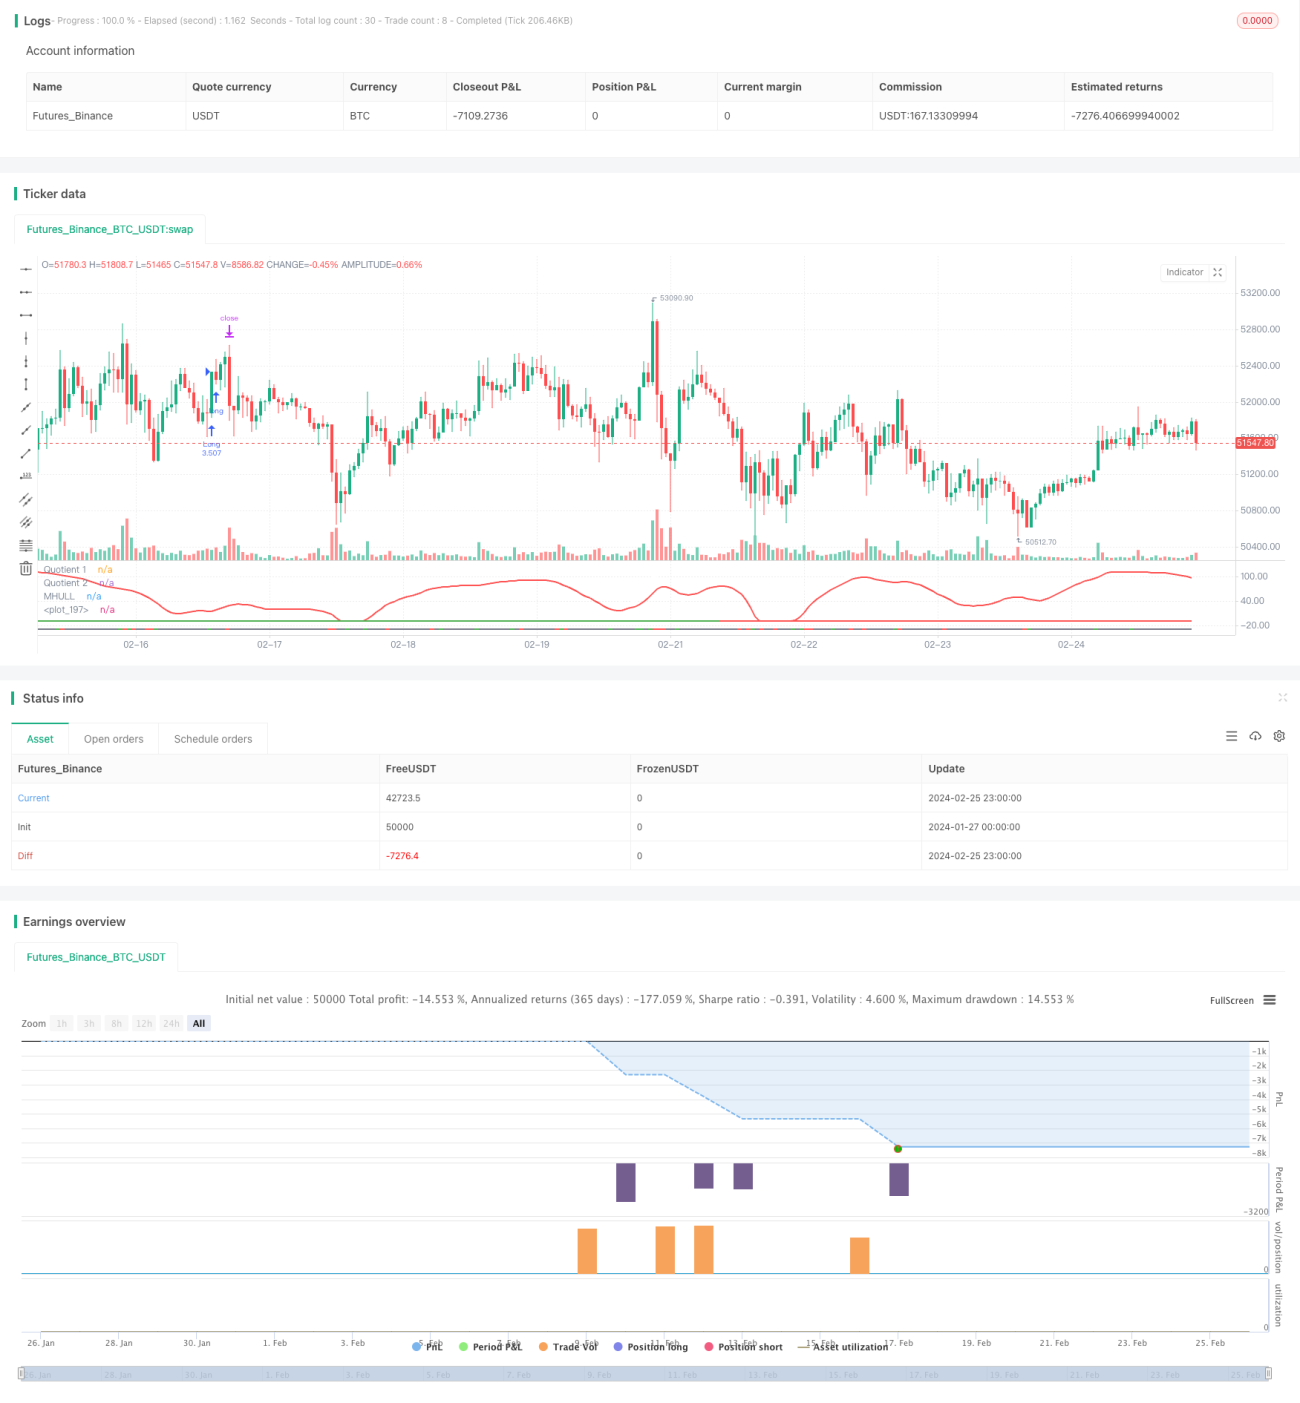
Esta estrategia combina tres indicadores: Boom Hunter, Hull Suite y Volatility Oscillator, para lograr una estrategia cuantitativa de seguimiento de tendencias y transacciones de ruptura en múltiples marcos de tiempo. La estrategia se aplica a activos digitales como Bitcoin con un alto nivel de volatilidad y situaciones de precios repentinas.
El principio
La lógica central de la estrategia se basa en los siguientes tres indicadores:
-
**El cazador de telas (Boom Hunter)**Un oscilador que utiliza la compresión de indicadores para determinar las señales de compra y venta mediante el cruce de dos indicadores (Quotient1 y Quotient2).
-
El conjunto Hull Suite: Un conjunto de indicadores de línea media móvil suave para juzgar la dirección de la tendencia a través de la relación entre la vía media y la vía ascendente y descendente.
-
El oscilador de volatilidadEl índice de volatilidad es un indicador oscilante de la información de fluctuaciones de precios cuantitativas.
La lógica de entrada de esta estrategia es que, al mismo tiempo que los dos indicadores de Quotient de los cazadores de telas se cruzan hacia arriba o hacia abajo, el precio debe romper la órbita media de Hull y desviarse de la órbita superior o inferior, mientras que el indicador de fluctuación se encuentra en la zona de sobreventa. De esta manera, se pueden filtrar algunas falsas señales de ruptura y mejorar la precisión de la entrada.
El stop loss se establece mediante la búsqueda de un mínimo o máximo de un período determinado (la línea K de 20 por defecto), mientras que las ganancias se obtienen mediante el porcentaje de stop loss multiplicado por el porcentaje de stop loss de la configuración (el triple por defecto). Las posiciones se calculan en función del porcentaje de los activos totales de la cuenta (el 3% por defecto) y el margen de stop loss de un indicador específico.
Las ventajas
- Utiliza la técnica de compresión de indicadores para extraer las principales señales de transacción en los precios y aumentar la probabilidad de obtener ganancias
- Verificación combinada de múltiples indicadores para evitar falsas rupturas y determinar con precisión la dirección de la tendencia
- Configuración de paradas de pérdidas dinámicas para el seguimiento de tendencias con riesgos controlables
- La adopción de indicadores de volatilidad para garantizar la negociación en un entorno de alta volatilidad
- Análisis de marcos de tiempo múltiples para mejorar la estabilidad de la estrategia
El riesgo
- El indicador de los cazadores de telas podría estar comprimido, lo que generaría una señal errónea.
- El paquete Hull se retrasará en el trayecto y no podrá rastrear los cambios en los precios en tiempo real.
- Si la volatilidad baja, se pierden oportunidades de negociación o se generan pérdidas de liquidación.
La solución:
- Ajuste de los parámetros del indicador de compresión, equilibrar la sensibilidad del indicador
- Intentar usar promedios móviles de índices como EHMA en lugar de un indicador de trayectoria media
- Aumentar otros indicadores de juicio para evitar la volatilidad engañosa
Optimización
La estrategia puede ser optimizada en los siguientes aspectos:
-
Optimización de parámetros: para obtener la mejor combinación de parámetros mediante la modificación de parámetros indicadores como la longitud de ciclo, el coeficiente de compresión, etc.
-
Optimización del marco de tiempoPrueba diferentes períodos de tiempo (un minuto, cinco minutos, treinta minutos, etc.) para encontrar el ciclo de negociación más adecuado.
-
Optimización de posiciones• Cambiar el tamaño y la proporción de las posiciones en cada transacción para encontrar el mejor uso de los fondos
-
Optimización de pérdidasAjuste de la posición de stop loss para obtener la mejor relación de riesgo-rentabilidad de acuerdo con las diferentes operaciones
-
Optimización de las condicionesAumentar o disminuir las condiciones de filtración de indicadores para obtener una hora de entrada más precisa
Resumir
Esta estrategia permite el seguimiento de la tendencia de las transacciones en un marco de tiempo múltiple a través de la combinación de los tres indicadores de los cazadores de telas, el kit de Hull y el oscilador de volatilidad. La estrategia es capaz de identificar el comportamiento repentino de los precios de manera efectiva y se aplica a activos digitales con alta volatilidad.
- 1