Estrategia de swing trading del RSI basada en ajustes intraanuales

Descripción general
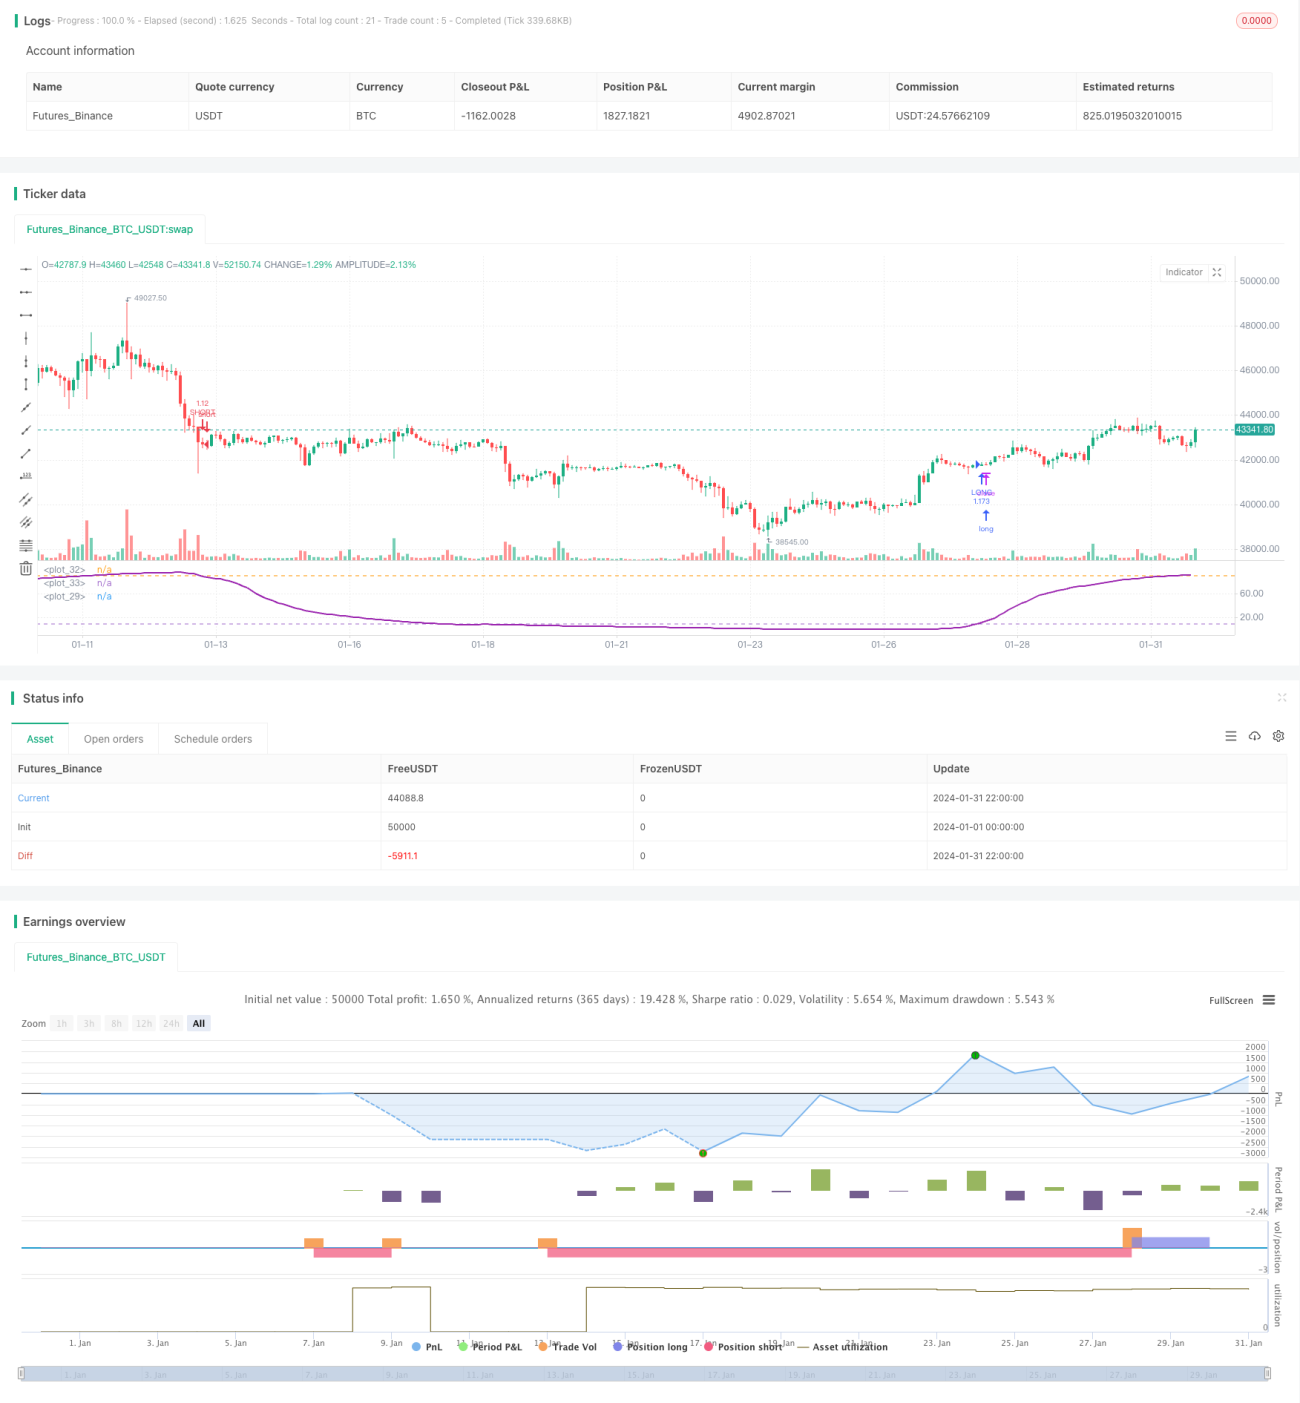
Esta estrategia es una estrategia de comercio de oscilación del RSI basada en ajustes interanuales, que emite una señal de comercio cuando el indicador RSI toca la línea de descenso y baja mediante el seguimiento de las características de oscilación entre el indicador RSI y el tren de descenso establecido.
Principio de estrategia
- Configuración de la longitud de la línea media de la MA, el parámetro RSI, el tren ascendente y descendente, el parámetro stop loss y el rango de ciclo de negociación
- Calcula el RSI, el RSI es igual a la media de las subidas y las bajadas.*100
- Trazar el indicador RSI y sus trayectorias
- El indicador RSI en la parte superior de la banda baja para hacer más señales, la parte inferior de la banda baja para hacer la señal de vacío
- La apertura de una posición para la creación de una OCO
- Detener y detener el daño de acuerdo con la lógica de detener y detener establecida
Análisis de las ventajas estratégicas
- Al establecer un ciclo de transacciones dentro del año, se puede evitar un entorno externo inapropiado.
- El indicador RSI puede reflejar de manera efectiva las situaciones de sobreventa y sobrecompra, y puede filtrar parte del ruido mediante la configuración de un rango razonable para el comercio de convulsiones.
- El OCO en el listado se combina con la configuración de stop loss para lograr un control de riesgo eficiente.
Análisis de riesgos estratégicos
- El RSI no puede garantizar la exactitud de los juicios críticos, y existe un cierto riesgo de error.
- La configuración incorrecta del ciclo de negociación durante el año puede perder mejores oportunidades de negociación o entrar en un entorno de negociación inadecuado.
- Un punto de parada demasiado alto puede causar una pérdida mayor, y un punto de parada demasiado pequeño puede causar una ganancia demasiado pequeña.
Se puede optimizar mediante el ajuste de los parámetros RSI, el rango de tiempo del ciclo de negociación, el stop loss ratio y otros métodos.
Dirección de optimización de la estrategia
- Prueba de los valores óptimos del RSI en diferentes mercados y períodos
- Analizar el ciclo de la economía en general para determinar el mejor momento del año para operar
- Determinación de la proporción de stop loss razonable mediante retroalimentación
- Optimización de la selección de variedades de comercio y aumento del tamaño de las posiciones
- Optimización en combinación con otras técnicas de negociación o indicadores de mejor calidad
Resumir
La estrategia controla el riesgo de negociación de manera efectiva mediante el seguimiento de la tendencia de las operaciones a través de la característica de la oscilación del indicador RSI en un período determinado del año. Se puede obtener una mayor eficacia de la estrategia mediante la optimización de los parámetros y la optimización de las reglas.
/*backtest
start: 2024-01-01 00:00:00
end: 2024-01-31 23:59:59
period: 2h
basePeriod: 15m
exchanges: [{"eid":"Futures_Binance","currency":"BTC_USDT"}]
*/

//@version=3
strategy(title = "Bitlinc MARSI Study AST",shorttitle="Bitlinc MARSI Study AST",default_qty_type = strategy.percent_of_equity, default_qty_value = 100,commission_type=strategy.commission.percent,commission_value=0.1,initial_capital=1000,currency="USD",pyramiding=0, calc_on_order_fills=false)

// === General Inputs ===- 1