Estrategia de seguimiento de tendencias de triple confirmación
Descripción general
La estrategia de seguimiento de tendencias de triple confirmación capta una alta probabilidad de tendencias mediante la combinación de las señales de los tres indicadores principales, como la línea media, la línea de memoria y la tendencia súper. Cuando los tres indicadores principales emiten señales de compra o venta al mismo tiempo, la estrategia entra en juego a tiempo y sigue la tendencia.
Principio de estrategia
La línea media para juzgar la tendencia principal
La estrategia utiliza una línea media de 52 ciclos de longitud para determinar la dirección de la tendencia principal. Cuando el precio cruza la línea media por encima, se considera una tendencia alcista; cuando el precio cruza la línea media por debajo, se considera una tendencia descendente.
Reversión de la identificación de líneas de memoria secundarias
La estrategia también utiliza la línea de olvido para identificar inversiones secundarias a corto plazo. La línea de olvido se calcula de manera similar a la línea media, pero el precio de cierre se sustituye por el precio de apertura para reflejar más rápidamente la información de la reversión del precio. Cuando el precio atraviesa la línea de olvido descendente, la línea de olvido corta de precios indica una señal de rebote estable; cuando el precio atraviesa la línea de olvido ascendente, la línea de olvido corta de precios indica una señal de retorno.
El punto de inflexión de las súper tendencias
La estrategia también combina con el indicador de tendencia súper para determinar los puntos de reversión clave. El indicador de tendencia súper combina con el período de la ventana y los datos de precios del indicador ATR, para ajustar dinámicamente la subida y bajada del canal y así determinar el momento de la reversión.
Filtración de señales de triple confirmación
Cuando la línea media, la línea de olvido y la tendencia súper de tres indicadores emiten señales de compra al mismo tiempo, la estrategia hace más; cuando los tres indicadores emiten señales de venta al mismo tiempo, la estrategia se vacía. Con la confirmación de los tres indicadores, se puede filtrar eficazmente las señales falsas y aumentar la probabilidad de entrada.
Análisis de las ventajas
El juicio multidimensional, alta probabilidad
La estrategia de la combinación de los tres indicadores de la línea media, la línea de olvido y la tendencia súper, para juzgar las tendencias y los puntos clave desde diferentes dimensiones, para asegurar una alta probabilidad de entrada.
Respuesta rápida, seguimiento en tiempo real
La introducción de la línea de olvido garantiza que la estrategia pueda reaccionar rápidamente a la reversión de la línea corta de los precios; el indicador de tendencias súper de la ATR se adapta al canal y también puede seguir los cambios de precios en tiempo real.
Automático para detener la pérdida y controlar el riesgo
La estrategia tiene una lógica de stop-stop automática, que puede ajustar el stop-stop en función de la dinámica del ATR, para controlar eficazmente las pérdidas individuales.
Riesgos y soluciones
El riesgo de una frecuencia de transacción excesiva
Debido a la frecuencia de las señales de negociación de la estrategia, es fácil que se produzca un exceso de negociación. Se puede aumentar adecuadamente el parámetro de ciclo de la línea media y reducir la frecuencia de la negociación.
Riesgo de incertidumbre inversa
El efecto de la línea de olvido y el indicador de tendencia súper para determinar el punto de inflexión es incierto, y puede haber un riesgo de error. Se pueden aumentar las condiciones de filtrado de los parámetros del indicador para garantizar una señal de inflexión de mayor probabilidad.
Riesgo de pérdidas en situaciones de crisis
En situaciones de crisis, la estrategia se abre y se detiene con frecuencia debido a la intersección repetida, lo que genera un riesgo de pérdida. Se puede identificar una situación de crisis y suspender la estrategia en esta etapa.
Dirección de optimización
Indicadores de fluctuación combinados
Se puede considerar la combinación de indicadores de tipo de volatilidad, como la banda de Brin. Cuando el precio está cerca de la banda de Brin, se evita la apertura de nuevas posiciones, lo que evita el riesgo de un mercado convulso.
Aumentar las condiciones de filtración de entrada
Se puede intentar agregar otros indicadores de juicio auxiliares, como KDJ, MACD, etc., y entrar en juego solo cuando también emiten señales al mismo tiempo. Esto puede filtrar aún más las señales falsas y reducir las transacciones innecesarias.
Optimización de las estrategias de stop loss
Las estrategias de stop-loss optimizadas, como el stop-loss móvil, el stop-loss móvil del índice, el stop-loss intermedio de la mitad de la posición, etc., hacen que los beneficios sean más estables.
Resumir
La estrategia de seguimiento de la tendencia de triple confirmación aprovecha las ventajas de los tres indicadores principales de la línea media, la línea de olvido y la tendencia súper, para lograr un juicio y captura de alta probabilidad de la tendencia. Al mismo tiempo, establece un mecanismo automático de parada de pérdidas para controlar eficazmente las pérdidas individuales.
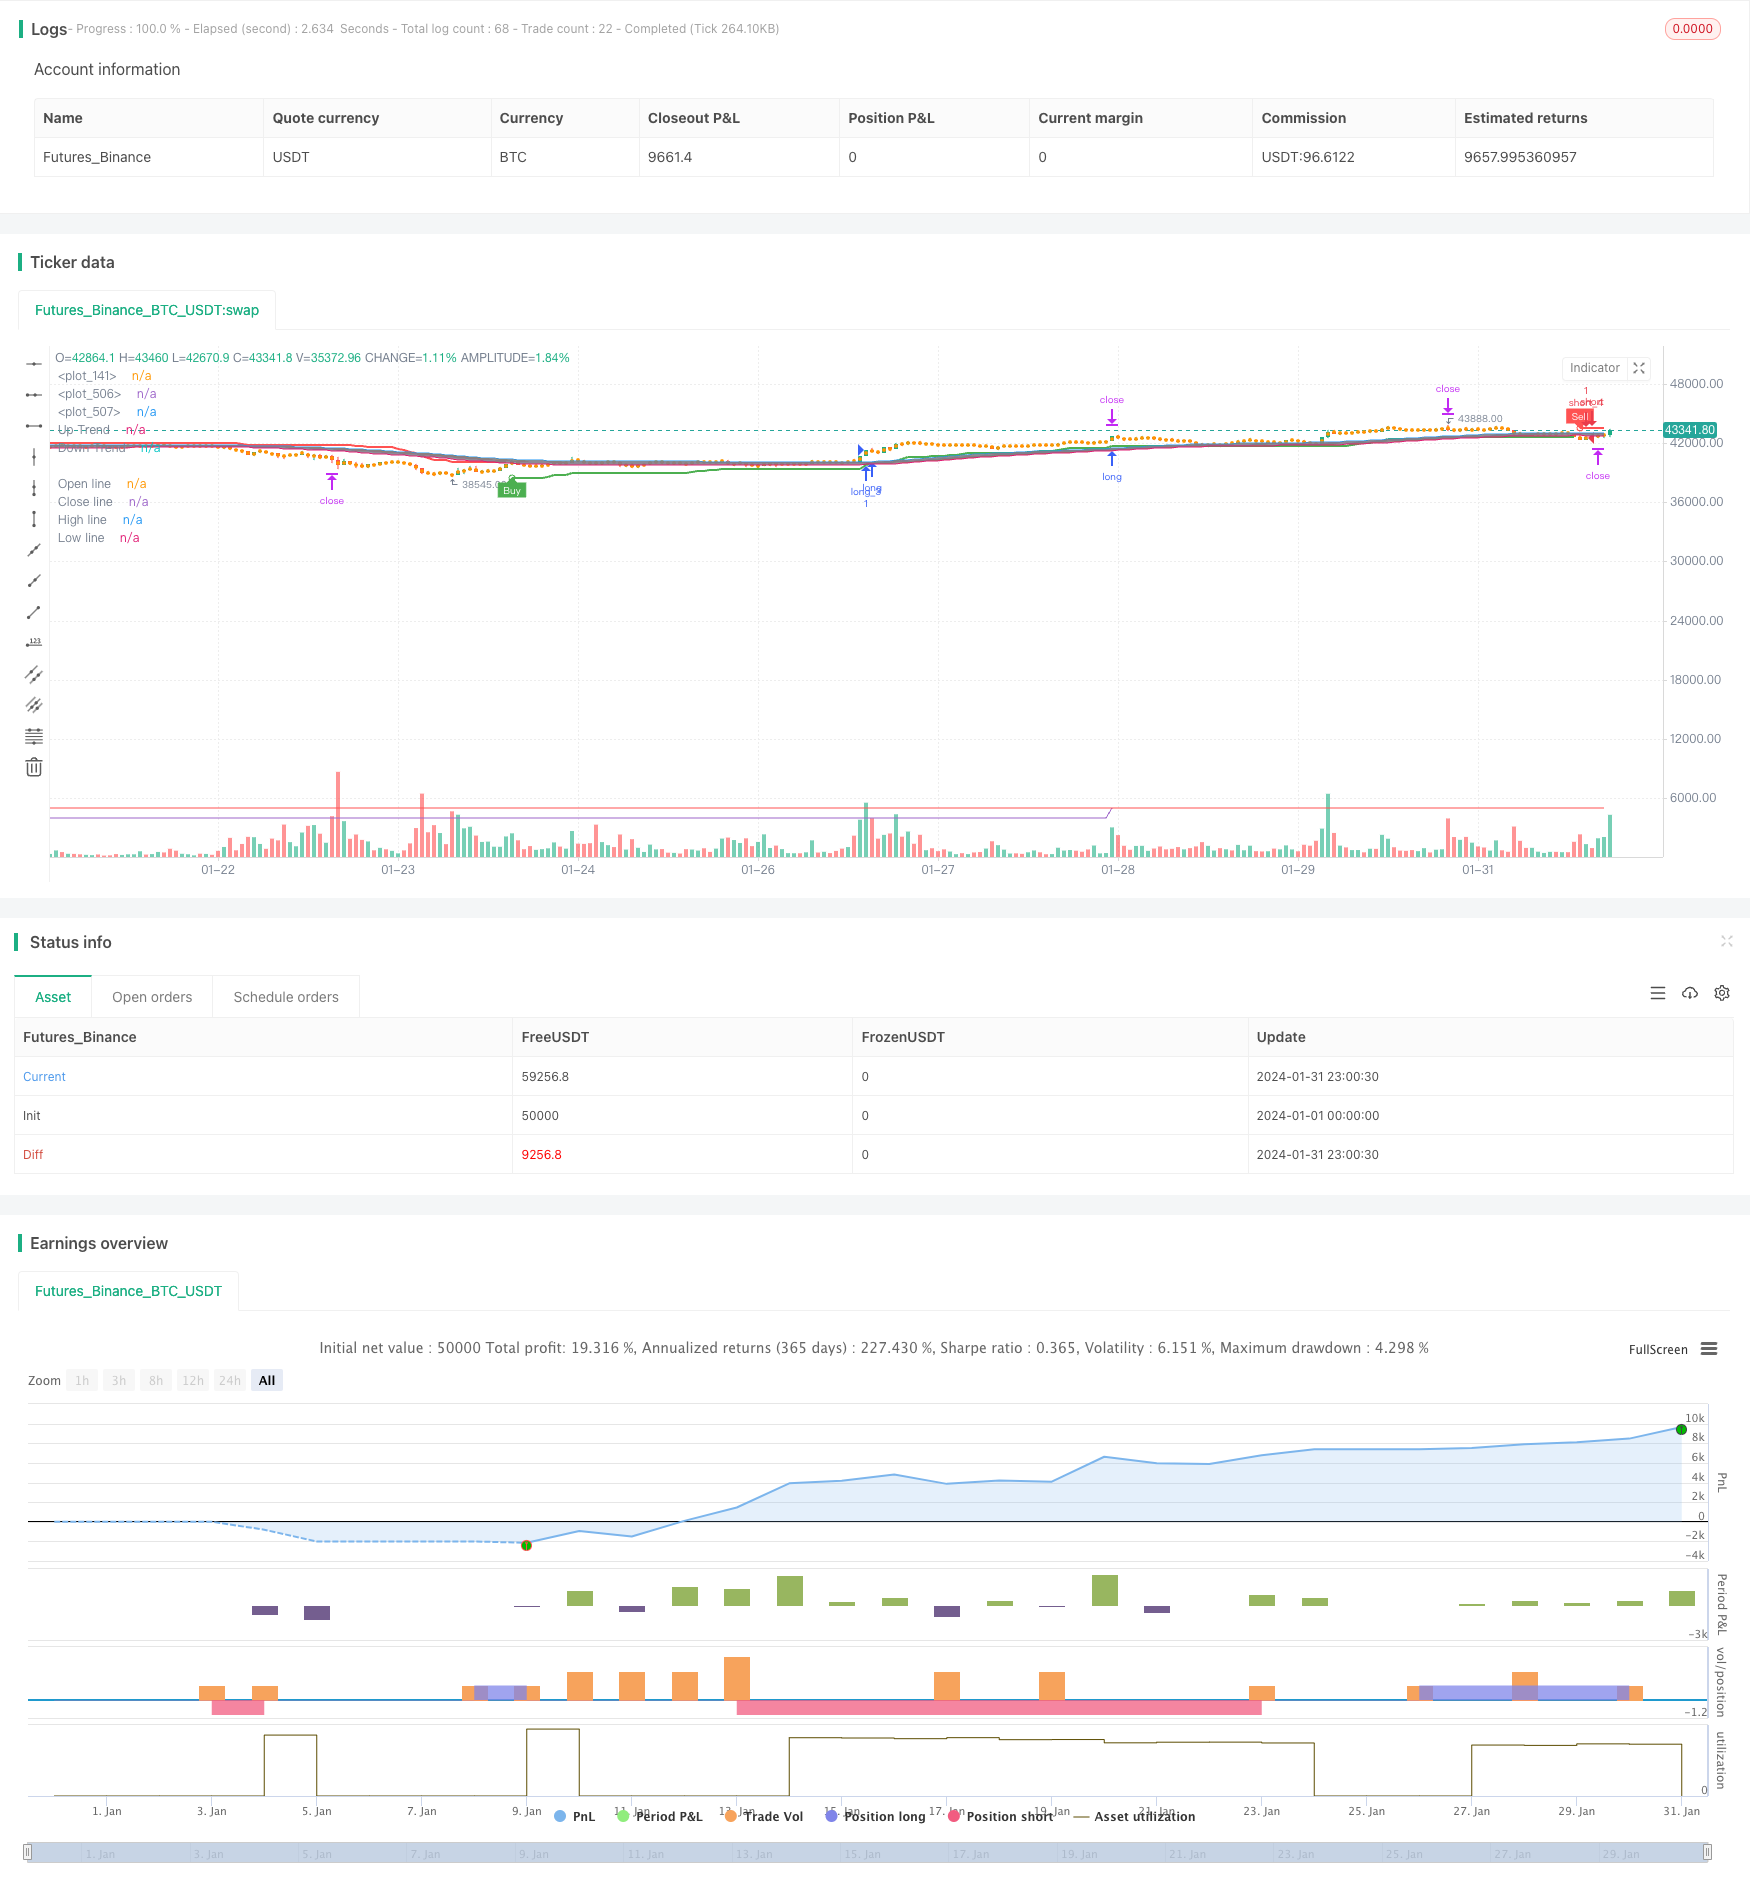
/*backtest
start: 2024-01-01 00:00:00
end: 2024-01-31 23:59:59
period: 1h
basePeriod: 15m
exchanges: [{"eid":"Futures_Binance","currency":"BTC_USDT"}]
*/

//@version=5


//custom variables
hei_col = 0  //1 for green 0 for red
qqe_col = 0  //1 for blue 0 for red
supa_col = 0  //1 for buy 0 for sell
float upratr=0
float lwratr=0
//end


strategy(title='Death_star', overlay=true,calc_on_every_tick = true)

ma_type = input.string(title='MA Type', defval='EMA', options=['EMA', 'SMA', 'SWMA', 'VWMA', 'WMA'])
ma_period = input.int(title='MA Period (Length)', defval=52, minval=1)
ma_period_smoothing = input.int(title='MA Period smoothing (Length)', defval=10, minval=1)

color_positive = input(title='Positive color (Bullish)', defval=color.new(#26A69A, 50))
color_negative = input(title='Negative color (Bearish)', defval=color.new(#EF5350, 50))
color_hl = input(title='High & Low cloud color', defval=color.new(#808080, 80))

show_line = input(title='Show (lines)', defval=false)
show_hl_cloud = input(title='Show (High & Low cloud)', defval=true)
show_oc_cloud = input(title='Show (Open & Close cloud)', defval=true)

//————————————————————————————————————————————————————————————————————————————————
// I.2. Settings, Function definition — — — — — — — — — — — — — — — — — — — — — —
//————————————————————————————————————————————————————————————————————————————————

f_ma_type(input_ma_type, input_source, input_ma_period) =>
    result = float(na)

    if input_ma_type == 'EMA'
        result := ta.ema(input_source, input_ma_period)
        result
    if input_ma_type == 'SMA'
        result := ta.sma(input_source, input_ma_period)
        result
    if input_ma_type == 'SWMA'
        result := ta.swma(input_source)
        result
    if input_ma_type == 'VWMA'
        result := ta.vwma(input_source, input_ma_period)
        result
    if input_ma_type == 'WMA'
        result := ta.wma(input_source, input_ma_period)
        result

    result

//————————————————————————————————————————————————————————————————————————————————
// II.1. Calculations, MA — — — — — — — — — — — — — — — — — — — — — — — — — — — —
//————————————————————————————————————————————————————————————————————————————————

o = f_ma_type(ma_type, open, ma_period)
c = f_ma_type(ma_type, close, ma_period)
h = f_ma_type(ma_type, high, ma_period)
l = f_ma_type(ma_type, low, ma_period)

//————————————————————————————————————————————————————————————————————————————————
// II.2. Calculations, Heikin Ashi — — — — — — — — — — — — — — — — — — — — — — — —
//————————————————————————————————————————————————————————————————————————————————

ha = ticker.heikinashi(syminfo.tickerid)

ha_o = request.security(ha, timeframe.period, o)
ha_c = request.security(ha, timeframe.period, c)
ha_h = request.security(ha, timeframe.period, h)
ha_l = request.security(ha, timeframe.period, l)

//————————————————————————————————————————————————————————————————————————————————
// II.3. Calculations, MA (Smoothing) — — — — — — — — — — — — — — — — — — — — — —
//————————————————————————————————————————————————————————————————————————————————

ha_o_smooth = f_ma_type(ma_type, ha_o, ma_period_smoothing)
ha_c_smooth = f_ma_type(ma_type, ha_c, ma_period_smoothing)
ha_h_smooth = f_ma_type(ma_type, ha_h, ma_period_smoothing)
ha_l_smooth = f_ma_type(ma_type, ha_l, ma_period_smoothing)

//————————————————————————————————————————————————————————————————————————————————
// III.1. Display, Colors — — — — — — — — — — — — — — — — — — — — — — — — — — — —
//————————————————————————————————————————————————————————————————————————————————

tren = ha_c_smooth >= ha_o_smooth

color_trend = tren ? color_positive : color_negative

hei_col := tren ? 1 : 0

color_show_line_positive = show_line ? color_positive : na
color_show_line_negative = show_line ? color_negative : na

color_show_hl_cloud = show_hl_cloud ? color_hl : na
color_show_oc_cloud = show_oc_cloud ? color_trend : na

//————————————————————————————————————————————————————————————————————————————————
// III.2. Display, Plotting & Filling — — — — — — — — — — — — — — — — — — — — — —
//————————————————————————————————————————————————————————————————————————————————

o_line = plot(ha_o_smooth, color=color_show_line_positive, title='Open line')
c_line = plot(ha_c_smooth, color=color_show_line_negative, title='Close line')

h_line = plot(ha_h_smooth, color=color_show_line_positive, title='High line')
l_line = plot(ha_l_smooth, color=color_show_line_negative, title='Low line')

fill(o_line, c_line, color=color_show_oc_cloud, title='Open & Close Trendcloud', transp=90)
fill(h_line, l_line, color=color_show_hl_cloud, title='High & Low Trendcloud', transp=90)

upratr:=(ha_h_smooth)
lwratr:=(ha_l_smooth)
// supa


Periods = input(title='ATR Period', defval=9)
src = input(hl2, title='Source')
Multiplier = input.float(title='ATR Multiplier', step=0.1, defval=3.9)
changeATR = input(title='Change ATR Calculation Method ?', defval=true)
showsignals = input(title='Show Buy/Sell Signals ?', defval=true)
highlighting = input(title='Highlighter On/Off ?', defval=true)
atr2 = ta.sma(ta.tr, Periods)
atr = changeATR ? ta.atr(Periods) : atr2
up = src - Multiplier * atr
up1 = nz(up[1], up)
up := close[1] > up1 ? math.max(up, up1) : up
dn = src + Multiplier * atr
dn1 = nz(dn[1], dn)
dn := close[1] < dn1 ? math.min(dn, dn1) : dn
trend = 1
trend := nz(trend[1], trend)
trend := trend == -1 and close > dn1 ? 1 : trend == 1 and close < up1 ? -1 : trend
upPlot = plot(trend == 1 ? up : na, title='Up Trend', style=plot.style_linebr, linewidth=2, color=color.new(color.green, 0))
buySignal = trend == 1 and trend[1] == -1
plotshape(buySignal ? up : na, title='UpTrend Begins', location=location.absolute, style=shape.circle, size=size.tiny, color=color.new(color.green, 0))
plotshape(buySignal and showsignals ? up : na, title='Buy', text='Buy', location=location.absolute, style=shape.labelup, size=size.tiny, color=color.new(color.green, 0), textcolor=color.new(color.white, 0))
dnPlot = plot(trend == 1 ? na : dn, title='Down Trend', style=plot.style_linebr, linewidth=2, color=color.new(color.red, 0))
sellSignal = trend == -1 and trend[1] == 1
plotshape(sellSignal ? dn : na, title='DownTrend Begins', location=location.absolute, style=shape.circle, size=size.tiny, color=color.new(color.red, 0))
plotshape(sellSignal and showsignals ? dn : na, title='Sell', text='Sell', location=location.absolute, style=shape.labeldown, size=size.tiny, color=color.new(color.red, 0), textcolor=color.new(color.white, 0))
mPlot = plot(ohlc4, title='', style=plot.style_circles, linewidth=0)
longFillColor = highlighting ? trend == 1 ? color.green : color.white : color.white
shortFillColor = highlighting ? trend == -1 ? color.red : color.white : color.white
supa_col := trend == 1 ? 1 : 0
fill(mPlot, upPlot, title='UpTrend Highligter', color=longFillColor, transp=90)
fill(mPlot, dnPlot, title='DownTrend Highligter', color=shortFillColor, transp=90)
alertcondition(buySignal, title='SuperTrend Buy', message='SuperTrend Buy!')
alertcondition(sellSignal, title='SuperTrend Sell', message='SuperTrend Sell!')
changeCond = trend != trend[1]
alertcondition(changeCond, title='SuperTrend Direction Change', message='SuperTrend has changed direction!')

//QQE


//By Glaz, Modified
//study("QQE MOD")
RSI_Period = input(6, title='RSI Length')
SF = input(5, title='RSI Smoothing')
QQE = input(3, title='Fast QQE Factor')
ThreshHold = input(3, title='Thresh-hold')
//

srctt = input(close, title='RSI Source')
//

//
Wilders_Period = RSI_Period * 2 - 1


Rsi = ta.rsi(srctt, RSI_Period)
RsiMa = ta.ema(Rsi, SF)
AtrRsi = math.abs(RsiMa[1] - RsiMa)
MaAtrRsi = ta.ema(AtrRsi, Wilders_Period)
dar = ta.ema(MaAtrRsi, Wilders_Period) * QQE

longband = 0.0
shortband = 0.0
trenda = 0

DeltaFastAtrRsi = dar
RSIndex = RsiMa
newshortband = RSIndex + DeltaFastAtrRsi
newlongband = RSIndex - DeltaFastAtrRsi
longband := RSIndex[1] > longband[1] and RSIndex > longband[1] ? math.max(longband[1], newlongband) : newlongband
shortband := RSIndex[1] < shortband[1] and RSIndex < shortband[1] ? math.min(shortband[1], newshortband) : newshortband
cross_1 = ta.cross(longband[1], RSIndex)
trenda := ta.cross(RSIndex, shortband[1]) ? 1 : cross_1 ? -1 : nz(trenda[1], 1)
FastAtrRsiTL = trenda == 1 ? longband : shortband
////////////////////


length = input.int(50, minval=1, title='Bollinger Length')
mult = input.float(0.35, minval=0.001, maxval=5, step=0.1, title='BB Multiplier')
basis = ta.sma(FastAtrRsiTL - 50, length)
dev = mult * ta.stdev(FastAtrRsiTL - 50, length)
upper = basis + dev
lower = basis - dev
color_bar = RsiMa - 50 > upper ? #00c3ff : RsiMa - 50 < lower ? #ff0062 : color.gray


//
// Zero cross
QQEzlong = 0
QQEzlong := nz(QQEzlong[1])
QQEzshort = 0
QQEzshort := nz(QQEzshort[1])
QQEzlong := RSIndex >= 50 ? QQEzlong + 1 : 0
QQEzshort := RSIndex < 50 ? QQEzshort + 1 : 0
//

//Zero = hline(0, color=color.rgb(116, 26, 26), linestyle=hline.style_dotted, linewidth=1)

////////////////////////////////////////////////////////////////

RSI_Period2 = input(6, title='RSI Length')
SF2 = input(5, title='RSI Smoothing')
QQE2 = input(1.61, title='Fast QQE2 Factor')
ThreshHold2 = input(3, title='Thresh-hold')

src2 = input(close, title='RSI Source')
//

//
Wilders_Period2 = RSI_Period2 * 2 - 1


Rsi2 = ta.rsi(src2, RSI_Period2)
RsiMa2 = ta.ema(Rsi2, SF2)
AtrRsi2 = math.abs(RsiMa2[1] - RsiMa2)
MaAtrRsi2 = ta.ema(AtrRsi2, Wilders_Period2)
dar2 = ta.ema(MaAtrRsi2, Wilders_Period2) * QQE2
longband2 = 0.0
shortband2 = 0.0
trend2 = 0

DeltaFastAtrRsi2 = dar2
RSIndex2 = RsiMa2
newshortband2 = RSIndex2 + DeltaFastAtrRsi2
newlongband2 = RSIndex2 - DeltaFastAtrRsi2
longband2 := RSIndex2[1] > longband2[1] and RSIndex2 > longband2[1] ? math.max(longband2[1], newlongband2) : newlongband2
shortband2 := RSIndex2[1] < shortband2[1] and RSIndex2 < shortband2[1] ? math.min(shortband2[1], newshortband2) : newshortband2
cross_2 = ta.cross(longband2[1], RSIndex2)
trend2 := ta.cross(RSIndex2, shortband2[1]) ? 1 : cross_2 ? -1 : nz(trend2[1], 1)
FastAtrRsi2TL = trend2 == 1 ? longband2 : shortband2


//
// Zero cross
QQE2zlong = 0
QQE2zlong := nz(QQE2zlong[1])
QQE2zshort = 0
QQE2zshort := nz(QQE2zshort[1])
QQE2zlong := RSIndex2 >= 50 ? QQE2zlong + 1 : 0
QQE2zshort := RSIndex2 < 50 ? QQE2zshort + 1 : 0
//

hcolor2 = RsiMa2 - 50 > ThreshHold2 ? color.silver : RsiMa2 - 50 < 0 - ThreshHold2 ? color.silver : na
// plot(FastAtrRsi2TL - 50, title='QQE Line', color=color.new(color.white, 0), linewidth=2)
// plot(RsiMa2 - 50, color=hcolor2, title='Histo2', style=plot.style_columns, transp=50)

Greenbar1 = RsiMa2 - 50 > ThreshHold2
Greenbar2 = RsiMa - 50 > upper

Redbar1 = RsiMa2 - 50 < 0 - ThreshHold2
Redbar2 = RsiMa - 50 < lower
// plot(Greenbar1 and Greenbar2 == 1 ? RsiMa2 - 50 : na, title='QQE Up', style=plot.style_columns, color=color.new(#00c3ff, 0))
// plot(Redbar1 and Redbar2 == 1 ? RsiMa2 - 50 : na, title='QQE Down', style=plot.style_columns, color=color.new(#ff0062, 0))

qqe_col:=Greenbar1 and Greenbar2 == 1 ?1:(Redbar1 and Redbar2 == 1 ?0:-1)


//lab=label.new(bar_index,50,str.tostring(qqe_col))


// ////////////////////////////////////////////////////////////////

// //custom code

// ////////////////////////////////////////////////////////////////


// sma=((lhitt+shitt)/cnt)
// plot(sma*1000)
// plot(250,color=color.red)


//begin


sess=input("0916-1200","time for reversals!!")
v=time(timeframe.period,sess)
rr=input.float(1,"enter the reward..def is 3")
on=na(v)?false:true
bool daybreak=input.bool(false,"daybreak ? true means day end close")
bool apply_on=input.bool(true,"do u want time for reversal?")
apply_on:=not apply_on
test=input.int(2,"train(0) test(1) all(2)?")
// if str.tonumber(timeframe.period)!=5
//     runtime.error("backtests and stocks only valid for 5 min tf!!")
on:=apply_on or on


pts=1/syminfo.mintick
var float sl=0
var float profit=0
// var dud=0
// var counter=0
var con_win=0
var con_lose=0
var tempwin=0
var templose=0
//adding analytics variables
var float[] stararr=array.new_float(10,-1)
var float[] sslarr=array.new_float(10,-1)
var float skipper=-1
var float[] ltararr=array.new_float(10,-1)
var float[] lslarr=array.new_float(10,-1)

var float lhit=0
var float shit=0
var float miss=0
var float cnt=0
var lflag=0
var sflag=0
var i=0
var dud=0
var gap=0
float begin=0
float end=0
// ei_col = 0  //1 for green 0 for red
// qqe_col = 0  //1 for blue 0 for red
// supa_col = 0
//plot(i)
//code begins here
if test==0
    begin:=0
    end:=5500/2
else if test==1
    begin:=5500/2
    end:=bar_index
else if test==2
    begin:=0
    end:=bar_index


if  hei_col==1 and qqe_col==1 and supa_col==1 and lflag==0 and low>upratr and bar_index>=begin and bar_index<=end and on
    lflag:=1
    sflag:=0
    if array.get(lslarr,i)!=-1
        dud:=dud+1
    array.set(lslarr,i,upratr)
    array.set(ltararr,i,(close+rr*(close-upratr)))
    cnt:=cnt+1
    skipper:=i
   // lab=label.new(bar_index,close+100,str.tostring(array.get(lslarr,i)) +"\n"+  str.tostring(array.get(ltararr,i)) +"\n"+str.tostring(i))
    i:=(i+1)%9
    strategy.order("long_"+str.tostring(i-1),strategy.long,1)
    strategy.order("sl_l"+str.tostring(i-1),strategy.short,stop=upratr,oca_name = "exit"+str.tostring(i-1))
    strategy.order("target_l"+str.tostring(i-1),strategy.short,limit=((close+rr*(close-upratr))),oca_name = "exit"+str.tostring(i-1))

if  hei_col==0 and qqe_col==0 and supa_col==0 and sflag==0 and high<lwratr and bar_index>=begin and bar_index<=end and on
    sflag:=1
    lflag:=0
    if array.get(sslarr,i)!=-1
        dud:=dud+1
    array.set(sslarr,i,lwratr)
    array.set(stararr,i,(close-rr*(lwratr-close)))
    skipper:=i
  //  lab=label.new(bar_index,close+100,str.tostring(array.get(sslarr,i)) +"\n"+  str.tostring(array.get(stararr,i)) +"\n"+str.tostring(i))
    i:=(i+1)%9
    cnt:=cnt+1
    strategy.order("short_"+str.tostring(i-1),strategy.short,1)
    strategy.order("sl_s"+str.tostring(i-1),strategy.long,stop=lwratr,oca_name = "exit"+str.tostring(i-1))
    strategy.order("target_s"+str.tostring(i-1),strategy.long,limit=((close-rr*(lwratr-close))),oca_name = "exit"+str.tostring(i-1))


for j=0 to 9
    if array.get(lslarr,j)!=-1 and j!=skipper
        if low < array.get(lslarr,j)  and array.get(lslarr,j)!=-1// and open>array.get(lslarr,j)
            miss:=miss+1
            array.set(ltararr,j,-1)
            array.set(lslarr,j,-1)

        else if high > array.get(ltararr,j)  and array.get(lslarr,j)!=-1 //and open<array.get(ltararr,j)
            lhit:=lhit+1
            array.set(ltararr,j,-1)
            array.set(lslarr,j,-1)

    if array.get(sslarr,j)!=-1 and j!=skipper


        if high > array.get(sslarr,j) and array.get(sslarr,j)!=-1 //and open<array.get(sslarr,j)
            miss:=miss+1
            array.set(stararr,j,-1)
            array.set(sslarr,j,-1)
        else if low < array.get(stararr,j) and array.get(sslarr,j)!=-1 //and open>array.get(stararr,j)
            shit:=shit+1
            array.set(stararr,j,-1)
            array.set(sslarr,j,-1)
skipper:=-1
var day_miss=0
string ender=""
if (timeframe.period)=="1"
    ender:="1528-1529"
else if (timeframe.period)=="5"
    ender:="1520-1525"
else if (timeframe.period)=="15"
    ender:="1500-1515"
else if (timeframe.period)=="60"
    ender:="1330-1430"
else
    //runtime.error("not accounted tf!!")
    daybreak:=false
if time(timeframe.period,ender) and daybreak
    if strategy.position_size!=0
        day_miss+=1
        strategy.cancel_all()
        strategy.close_all("day_end_close")
        for k=0 to (array.size(stararr)==0?na:(array.size(stararr)-1))
            array.set(stararr,k,-1)
            array.set(sslarr,k,-1)

            array.set(ltararr,k,-1)
            array.set(lslarr,k,-1)
    i:=0


if (lhit+shit)>(lhit[1]+shit[1])
    tempwin:=tempwin+1
    templose:=0

else if (miss)>(miss[1])
    templose:=templose+1
    tempwin:=0

if tempwin>con_win
    con_win:=tempwin
if templose>con_lose
    con_lose:=templose


// //*********************adding randomness indicator************

var float nhit=0,var float nphit=0
if cnt%10==0 and cnt>0
    nhit:=(lhit+shit)-nphit
    nphit:=(lhit+shit)

t=table.new(position.top_right,1,6,bgcolor = color.rgb(236, 172, 172))
table.cell(t,0,0,str.tostring(((lhit+shit)/cnt)*100))
table.cell(t,0,1,str.tostring(((lhit+shit)/(lhit+shit+miss))*100))
table.cell(t,0,2,"daymiss "+str.tostring(day_miss))
//table.cell(t,0,1,str.tostring(((lhit)/cnt)*100))
//table.cell(t,0,2,str.tostring(((shit)/cnt)*100))
table.cell(t,0,3,str.tostring(con_win))
// table.cell(t,0,4,str.tostring(gap))
table.cell(t,0,4,str.tostring(con_lose))
table.cell(t,0,5,str.tostring(cnt))
//plot(1000*cnt,color =color.rgb(105, 28, 28))
// // plot(40000+lhit+shit,color=strategy.closedtrades%10==0?color.green:color.white,style=plot.style_circles)
//plot(1000*(lhit+shit),color=color.green)
//plot(1000*miss,color=color.red)

// // hitrate=strategy.wintrades/strategy.closedtrades
// // plot(hitrate*100)
// // plot(strategy.wintrades)
//plot(nhit*10000)
//dud is overwritten trades whereas day_miss are the trades closed at days end

// sma=(lhit+shit)/(lhit+shit+miss)
// plot(sma*100000)
// plot(50000,color=color.red)

// plot(con_win*1000,color=color.green)
// plot(con_lose*1000,color=color.red)


var float[] dat=array.new_float(10,-1)
var dati=0
var float datp=0
if miss>miss[1]
    for cd=0 to ((miss-miss[1])-1)
        array.set(dat,dati,0)
        dati:=(dati+1)%10
if (lhit+shit)>(lhit[1]+shit[1])
    for cd=0 to (  ((lhit+shit)-(lhit[1]+shit[1]))  -1)
        array.set(dat,dati,1)
        dati:=(dati+1)%10

if array.get(dat,9)!=-1
    for cd=0 to 9
        datp:=datp+array.get(dat,cd)

plot((datp/10)*10000)
plot(5000,color = color.red)
datp:=0