Estrategia de seguimiento de tendencias en múltiples marcos temporales basada en indicadores de soporte, resistencia y impulso
Descripción general de la estrategia
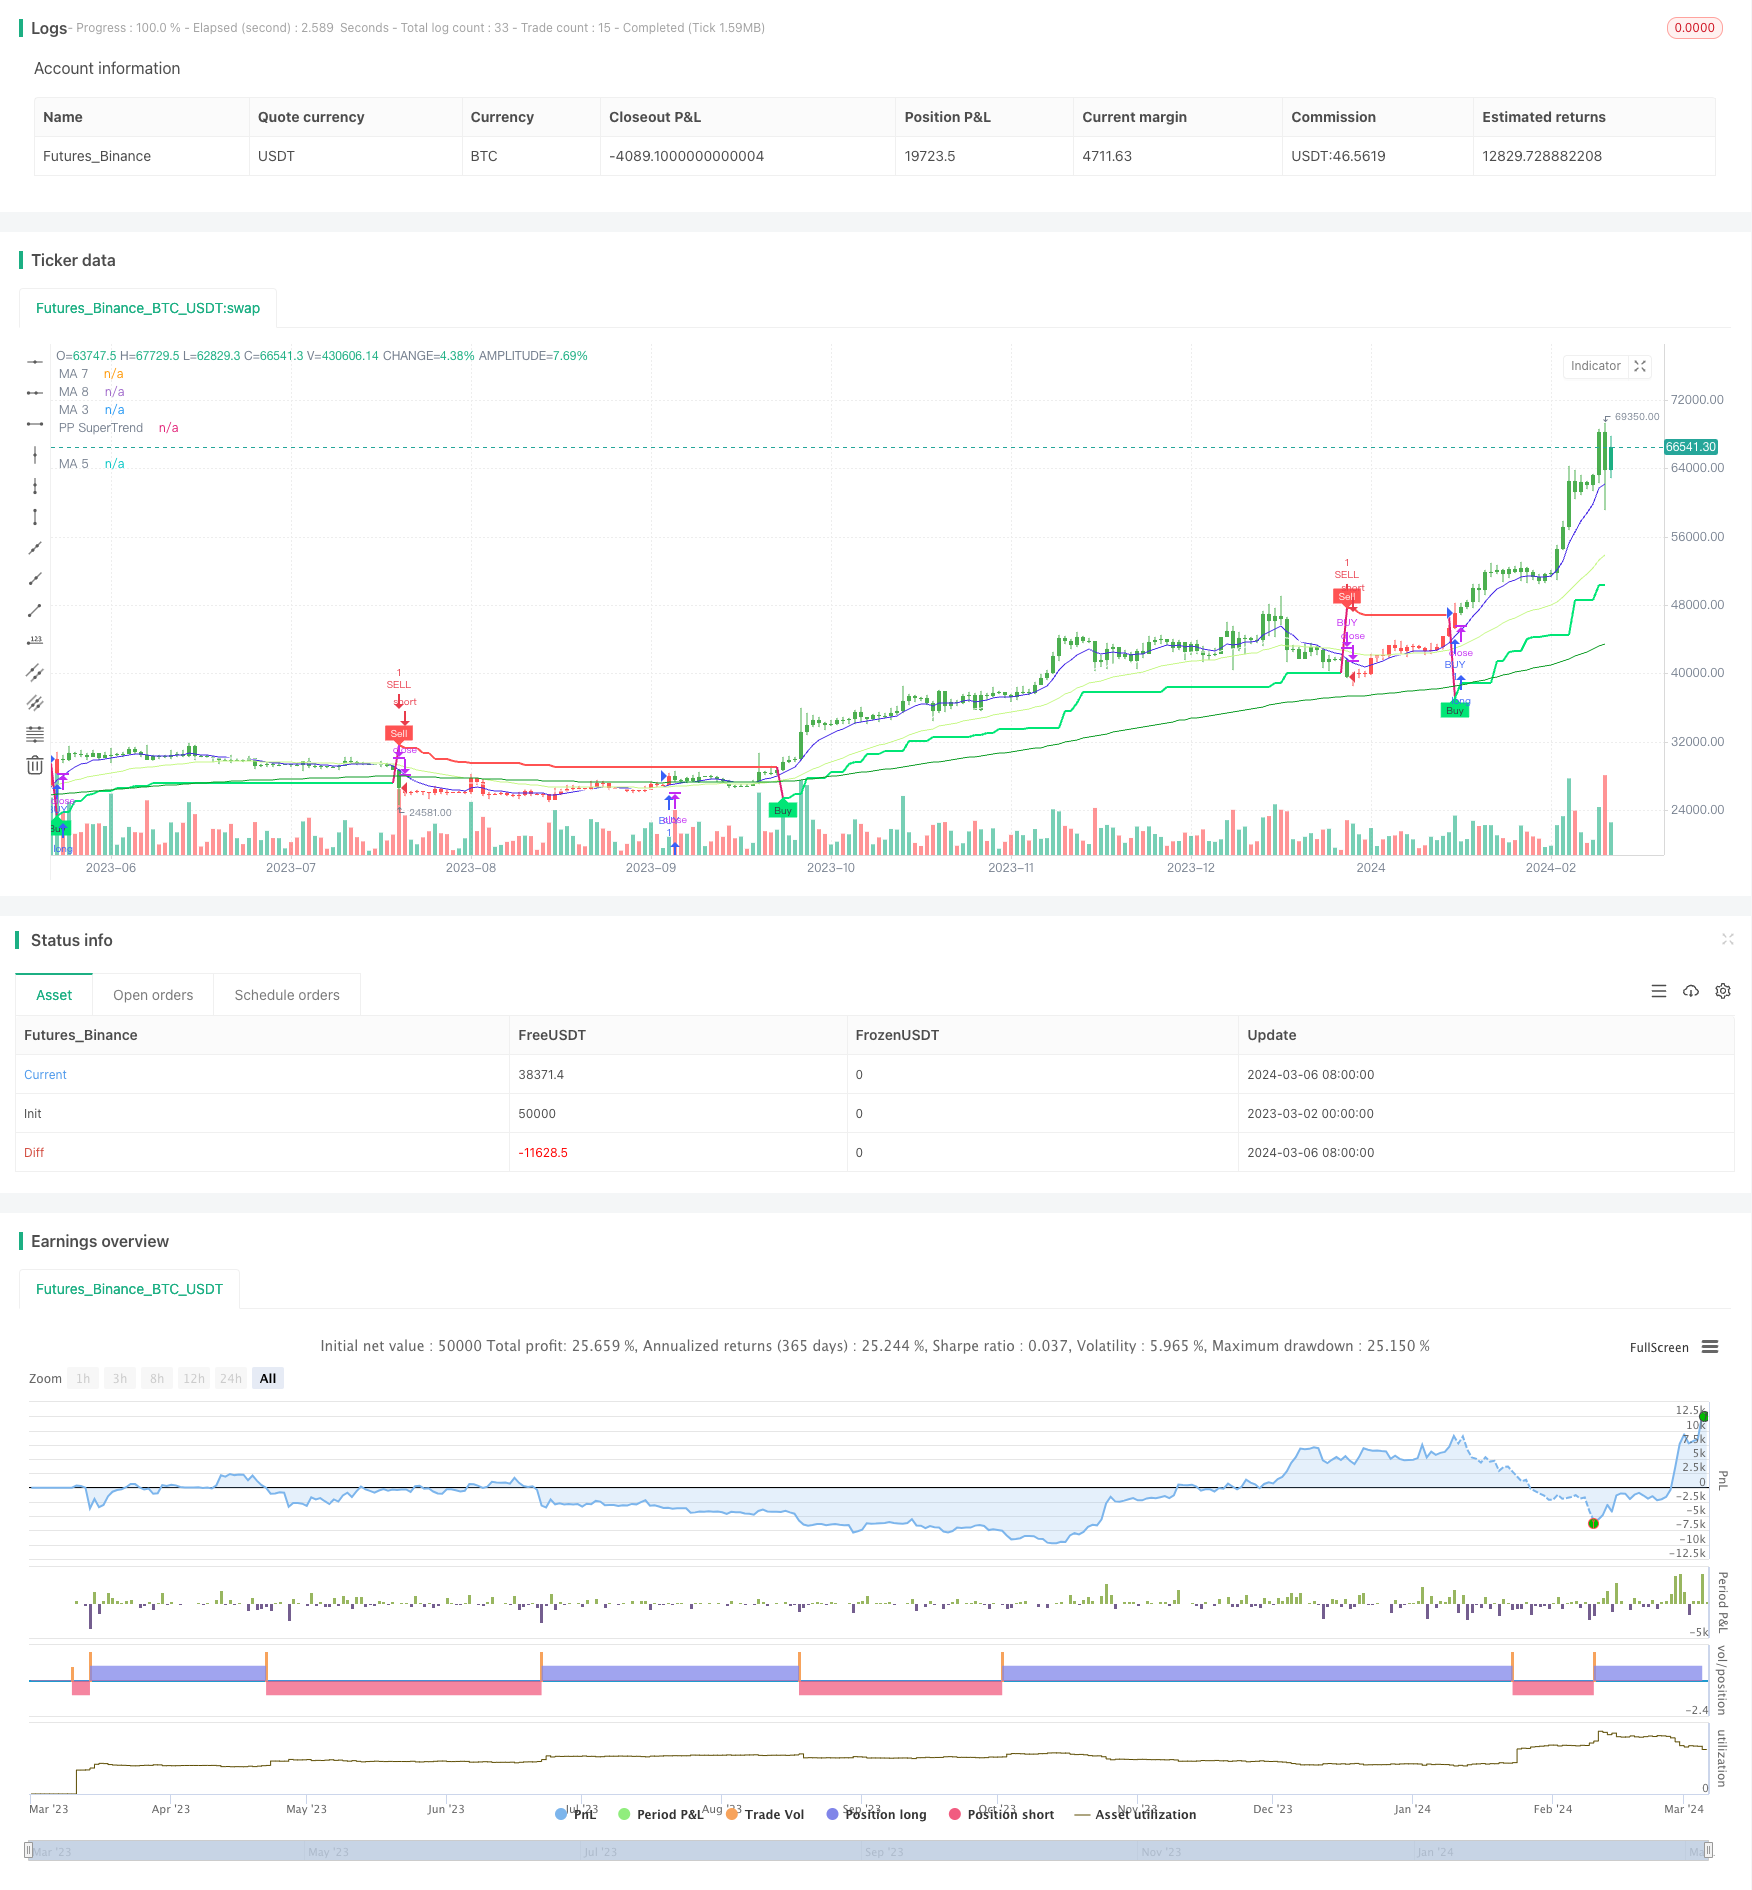
La estrategia integra el uso de varios indicadores técnicos, como soporte de resistencia, indicadores de tendencia súper y promedios móviles, para determinar la dirección de la tendencia de manera integral en varios marcos de tiempo, para lograr un sistema de seguimiento de tendencias. La idea principal de la estrategia es: primero, usar los puntos centrales para determinar la posición de resistencia de soporte en la que se encuentra el precio actual, luego usar el indicador de tendencia súper para determinar la dirección de la tendencia actual, y finalmente usar el filtro de promedios móviles para alejarse de la situación.
Principio de estrategia
- En primer lugar, se calcula el punto central en función de los precios más altos y más bajos de un período determinado en el pasado, para obtener el punto de resistencia de soporte del precio actual.
- La supertendencia se calcula a partir de la resistencia al soporte dinámico, y es un indicador de seguimiento de tendencias.
- La estrategia incluye el ATR como punto de parada en la base de la tendencia original.
- Filtra las tendencias con las medias móviles. Solo hace más cuando la tendencia es hacia arriba y el precio está por encima de la media, y hace menos cuando la tendencia es hacia abajo y el precio está por debajo de la media.
- Establecer ventanas de tiempo de negociación. Abrir posiciones solo en un intervalo de tiempo específico para evitar negociar en momentos importantes.
- Las posiciones múltiples son administradas por separado. Las señales múltiples y vacías activan su propia lógica de apertura.
En resumen, la estrategia abre una posición cuando resonan las tres condiciones de soporte de resistencia, dirección de la tendencia súper y dirección de la línea de equilibrio en el eje central. Si cualquiera de las condiciones falla, la posición queda en la paridad. Esto capta efectivamente la tendencia y al mismo tiempo controla el riesgo.
Análisis de las ventajas
- La ventaja de las operaciones basadas en soportes de resistencia reside en que se ajustan a las leyes de la oferta y la demanda del mercado, y el eje central puede reaccionar dinámicamente al equilibrio del mercado.
- El supertrend es capaz de capturar la tendencia de manera eficiente y detenerla a tiempo. El deterioro del ATR controla aún más el riesgo.
- El filtro de la línea media evita el comercio contracorrente. La probabilidad de ganar es mayor cuando se entra en juego con una tendencia y una resonancia de la línea media.
- La ventana de tiempo de negociación personalizada evita en cierta medida la negociación en puntos de tiempo importantes, como antes de la apertura y el cierre.
- Las señales de múltiples cabezas y cabezas vacías operan de forma independiente, y pueden tener múltiples posiciones vacías al mismo tiempo, aprovechando más las oportunidades del mercado.
Análisis de riesgos
- El riesgo de una operación frecuente. Esta estrategia puede generar un alto costo de operación al generar una baja frecuente en mercados convulsos.
- Aunque la estrategia utiliza un filtro de la línea media, puede producirse un cambio de tendencia si la línea media es contraria a la tendencia general.
- Optimización de los parámetros. La estrategia contiene muchos parámetros, como el ciclo y la multiplicación de la tendencia súper, el ciclo de la media, etc. Diferentes parámetros obtendrán diferentes resultados, y cómo elegir la combinación óptima de parámetros es un desafío.
- En situaciones extremas, como una caída violenta o una crisis de liquidez, la estrategia puede no detener los daños a tiempo.
Dirección de optimización
- Introducir más medias a largo plazo, mejorar la fiabilidad de las tendencias y reducir la frecuencia de las transacciones.
- Se puede considerar la introducción de indicadores de volatilidad, como las bandas de Brin, para reducir el comercio en mercados de alta volatilidad.
- Optimización de los parámetros para encontrar la combinación óptima de parámetros y mejorar la estabilidad de la estrategia.
- Establezca un alto riesgo en situaciones extremas y controle el riesgo. Además, considere agregar juicios de fluctuaciones anormales en el mercado, como saltos en los precios, aumento en el volumen de transacciones, etc., para reducir o suspender la negociación en casos anormales.
Resumir
La estrategia integra varios métodos de análisis técnico, como soporte de resistencia, seguimiento de tendencias y filtración de dinámica, que pueden generar ganancias efectivas en las tendencias y controlar el riesgo de reversión. Su ventaja es que las señales son claras, simples y lógicamente claras, y son adecuadas para su uso en el ciclo de mediano a largo plazo. Sin embargo, la estrategia también tiene problemas con el comercio frecuente, la dificultad de optimizar los parámetros y el control insuficiente del riesgo en situaciones extremas. En el futuro, se puede mejorar aún más mediante la introducción de más indicadores técnicos, la optimización de los parámetros, la configuración de pérdidas duras y el juicio de anomalías.
/*backtest
start: 2023-03-02 00:00:00
end: 2024-03-07 00:00:00
period: 1d
basePeriod: 1h
exchanges: [{"eid":"Futures_Binance","currency":"BTC_USDT"}]
*/

//@rpcoelho
// Based on © Julien_Eche "Pivot Point Supertrend" with optional EMAs ploted
//@version=4

strategy("PPS w/ EMAs", overlay=true)

prd = input(defval = 1, title="Pivot Point Period", minval = 1, maxval = 50)
Factor=input(defval = 4, title = "ATR Factor", minval = 1, step = 0.1)
Pd=input(defval = 72, title = "ATR Period", minval=1)
showpivot = input(defval = false, title="Show Pivot Points")
showlabel = input(defval = true, title="Show Buy/Sell Labels")
showcl = input(defval = false, title="Show PP Center Line")
showsr = input(defval = false, title="Show Support/Resistance")

/////////////////////////////////////////////////////////////////////////
// Switch Board
////////////////////////////////////////////////////////////////////////
// Define the switch board title as a label (since grouping is not available)
//switchboard_group = "████ Switch Board (Turn On/Off Overlay Indicators) ████"
//label.new(bar_index, high, switchboard_group, color=color.red)
// Create input controls for EMA and VWAP switches
switch_ema = input(true, title="EMA")

/////////////////////////////////////////////////////////////////////////
// EMA Selection
////////////////////////////////////////////////////////////////////////

ma_function(source, length, type) =>
    float ma = na
    if type == 'RMA'
        ma := rma(source, length)
    else if type == 'SMA'
        ma := sma(source, length)
    else if type == 'EMA'
        ma := ema(source, length)
    else if type == 'WMA'
        ma := wma(source, length)
    else if type == 'HMA'
        ma := length < 2 ? hma(source, 2) : hma(source, length)
    else
        ma := vwma(source, length)
    ma

// Moving Averages Line Title
//ma_group = "██████████ MAs Line ██████████"

// Inputs for MA 1
len1bool = input(false, title="Show MA 1")
len1 = input(13, title="Length MA 1")
ma_1_type = input("EMA", title="Type MA 1", options=["RMA", "SMA", "EMA", "WMA", "HMA", "VWMA"])
src_ma1 = input(title="MA1 Source", type=input.source, defval=close)
ma_1_colour = input(color.rgb(235, 159, 238), title="Color MA 1")

// Inputs for MA 2
len2bool = input(false, title="Show MA 2")
len2 = input(17, title="Length MA 2")
ma_2_type = input("EMA", title="Type MA 2", options=["RMA", "SMA", "EMA", "WMA", "HMA", "VWMA"])
src_ma2 = input(title="MA2 Source", type=input.source, defval=close)
ma_2_colour = input(color.rgb(230, 241, 65), title="Color MA 2")

// Inputs for MA 3
len3bool = input(true, title="Show MA 3")
len3 = input(34, title="Length MA 3")
ma_3_type = input("EMA", title="Type MA 3", options=["RMA", "SMA", "EMA", "WMA", "HMA", "VWMA"])
src_ma3 = input(title="MA3 Source", type=input.source, defval=close)
ma_3_colour = input(#c7f887, title="Color MA 3")

// Inputs for MA 4
len4bool = input(false, title="Show MA 4")
len4 = input(72, title="Length MA 4")
ma_4_type = input("EMA", title="Type MA 4", options=["RMA", "SMA", "EMA", "WMA", "HMA", "VWMA"])
src_ma4 = input(title="MA4 Source", type=input.source, defval=close)
ma_4_colour = input(#2f6999, title="Color MA 4")

// Inputs for MA 5
len5bool = input(true, title="Show MA 5")
len5 = input(144, title="Length MA 5")
ma_5_type = input("EMA", title="Type MA 5", options=["RMA", "SMA", "EMA", "WMA", "HMA", "VWMA"])
src_ma5 = input(title="MA5 Source", type=input.source, defval=close)
ma_5_colour = input(color.rgb(13, 156, 37), title="Color MA 5")

// Inputs for MA 6
len6bool = input(true, title="Show MA 6")
len6 = input(610, title="Length MA 6")
ma_6_type = input("EMA", title="Type MA 6", options=["RMA", "SMA", "EMA", "WMA", "HMA", "VWMA"])
src_ma6 = input(title="MA6 Source", type=input.source, defval=close)
ma_6_colour = input(color.rgb(173, 161, 152), title="Color MA 6")

// Inputs for MA 7
len7bool = input(true, title="Show MA 7")
len7 = input(8, title="Length MA 7")
ma_7_type = input("EMA", title="Type MA 7", options=["RMA", "SMA", "EMA", "WMA", "HMA", "VWMA"])
src_ma7 = input(title="MA7 Source", type=input.source, defval=close)
ma_7_colour = input(color.rgb(68, 39, 231), title="Color MA 7")

// Inputs for MA 8
len8bool = input(true, title="Show MA 8")
len8 = input(21, title="Length MA 8")
ma_8_type = input("EMA", title="Type MA 8", options=["RMA", "SMA", "EMA", "WMA", "HMA", "VWMA"])
src_ma8 = input(title="MA8 Source", type=input.source, defval=close)
ma_8_colour = input(color.white, title="Color MA 8")

ema1 = security(syminfo.tickerid, timeframe.period, ma_function(src_ma1, len1, ma_1_type))
ema2 = security(syminfo.tickerid, timeframe.period, ma_function(src_ma2, len2, ma_2_type))
ema3 = security(syminfo.tickerid, timeframe.period, ma_function(src_ma3, len3, ma_3_type))
ema4 = security(syminfo.tickerid, timeframe.period, ma_function(src_ma4, len4, ma_4_type))
ema5 = security(syminfo.tickerid, timeframe.period, ma_function(src_ma5, len5, ma_5_type))
ema6 = security(syminfo.tickerid, timeframe.period, ma_function(src_ma6, len6, ma_6_type))
ema7 = security(syminfo.tickerid, timeframe.period, ma_function(src_ma7, len7, ma_7_type))
ema8 = security(syminfo.tickerid, timeframe.period, ma_function(src_ma8, len8, ma_8_type))

plot(len1bool and switch_ema ? ema1:na, color=ma_1_colour, linewidth=1, title='MA 1')
plot(len2bool and switch_ema? ema2:na, color=ma_2_colour, linewidth=1, title='MA 2')
plot(len3bool and switch_ema? ema3:na, color=ma_3_colour, linewidth=1, title='MA 3')
plot(len4bool and switch_ema? ema4:na, color=ma_4_colour, linewidth=1, title='MA 4')
plot(len5bool and switch_ema? ema5:na, color=ma_5_colour, linewidth=1, title='MA 5')
plot(len6bool and switch_ema? ema6:na, color=ma_6_colour, linewidth=2, title='MA 6')
plot(len7bool and switch_ema? ema7:na, color=ma_7_colour, linewidth=1, title='MA 7')
plot(len8bool and switch_ema? ema8:na, color=ma_8_colour, linewidth=1, title='MA 8')


// get Pivot High/Low
float ph = pivothigh(prd, prd)
float pl = pivotlow(prd, prd)

// drawl Pivot Points if "showpivot" is enabled
plotshape(ph and showpivot, text="H",  style=shape.labeldown, color=na, textcolor=color.red, location=location.abovebar, transp=0, offset = -prd)
plotshape(pl and showpivot, text="L",  style=shape.labeldown, color=na, textcolor=color.lime, location=location.belowbar, transp=0, offset = -prd)

// calculate the Center line using pivot points
var float center = na
float lastpp = ph ? ph : pl ? pl : na
if lastpp
    if na(center)
        center := lastpp
    else
        //weighted calculation
        center := (center * 2 + lastpp) / 3

// upper/lower bands calculation
Up = center - (Factor * atr(Pd))
Dn = center + (Factor * atr(Pd))

// get the trend
float TUp = na
float TDown = na
Trend = 0
TUp := close[1] > TUp[1] ? max(Up, TUp[1]) : Up
TDown := close[1] < TDown[1] ? min(Dn, TDown[1]) : Dn
Trend := close > TDown[1] ? 1: close < TUp[1]? -1: nz(Trend[1], 1)
Trailingsl = Trend == 1 ? TUp : TDown

// plot the trend
linecolor = Trend == 1 and nz(Trend[1]) == 1 ? color.lime : Trend == -1 and nz(Trend[1]) == -1 ? color.red : na
plot(Trailingsl, color = linecolor ,  linewidth = 2, title = "PP SuperTrend")

plot(showcl ? center : na, color = showcl ? center < hl2 ? color.blue : color.red : na)

// check and plot the signals
bsignal = Trend == 1 and Trend[1] == -1
ssignal = Trend == -1 and Trend[1] == 1
plotshape(bsignal and showlabel ? Trailingsl : na, title="Buy", text="Buy", location = location.absolute, style = shape.labelup, size = size.tiny, color = color.lime, textcolor = color.black, transp = 0)
plotshape(ssignal and showlabel ? Trailingsl : na, title="Sell", text="Sell", location = location.absolute, style = shape.labeldown, size = size.tiny, color = color.red, textcolor = color.white, transp = 0)

//get S/R levels using Pivot Points
float resistance = na
float support = na
support := pl ? pl : support[1]
resistance := ph ? ph : resistance[1]

// if enabled then show S/R levels
plot(showsr and support ? support : na, color = showsr and support ? color.lime : na, style = plot.style_circles, offset = -prd)
plot(showsr and resistance ? resistance : na, color = showsr and resistance ? color.red : na, style = plot.style_circles, offset = -prd)

// Trend Filter from SuperTrend Long Strategy
Periods = input(title="ATR Period", type=input.integer, defval=3)
src = input(hlc3, title="Source")
Multiplier = input(title="ATR Multiplier", type=input.float, step=0.1, defval=4.0)
changeATR = input(title="Change ATR Calculation Method ?", type=input.bool, defval=true)

// Combine the SuperTrend calculations
atr2 = sma(tr, Periods)
atr = changeATR ? atr(Periods) : atr2

up = src - (Multiplier * atr)
up1 = nz(up[1], up)
up := close[1] > up1 ? max(up, up1) : up

dn = src + (Multiplier * atr)
dn1 = nz(dn[1], dn)
dn := close[1] < dn1 ? min(dn, dn1) : dn

trend = 1
trend := nz(trend[1], trend)
trend := trend == -1 and close > dn1 ? 1 : trend == 1 and close < up1 ? -1 : trend

// Moving Average as Trend Filter
periodes_ma = input(title="Moving Average Period", type=input.integer, defval=20)
src_ma = input(title="Moving Average Source", type=input.source, defval=close)
ma = sma(src_ma, periodes_ma)

// Strategy Entry Conditions
FromMonth = input(defval = 1, title = "From Month", minval = 1, maxval = 12)
FromDay   = input(defval = 1, title = "From Day", minval = 1, maxval = 31)
FromYear  = input(defval = 2017, title = "From Year", minval = 999)
ToMonth   = input(defval = 1, title = "To Month", minval = 1, maxval = 12)
ToDay     = input(defval = 1, title = "To Day", minval = 1, maxval = 31)
ToYear    = input(defval = 9999, title = "To Year", minval = 999)

start     = timestamp(FromYear, FromMonth, FromDay, 00, 00)
finish    = timestamp(ToYear, ToMonth, ToDay, 23, 59)

window()  => true

// Combined entry conditions
longCondition = (trend == 1 and trend[1] == -1 and close > ma) or (bsignal and window())
shortCondition = (trend == -1 and trend[1] == 1 and close < ma) or (ssignal and window())

if (longCondition)
    strategy.entry("BUY", strategy.long)

if (shortCondition)
    strategy.close("BUY")
    strategy.entry("SELL", strategy.short)

buy1 = barssince((trend == 1 and trend[1] == -1 and close > ma) or (bsignal and window()))
sell1 = barssince((trend == -1 and trend[1] == 1 and close < ma) or (ssignal and window()))
color1 = buy1[1] < sell1[1] ? color.green : buy1[1] > sell1[1] ? color.red : na
barcolor(color1)