Estrategia de seguimiento de tendencias del índice de fuerza relativa modificado
Descripción general
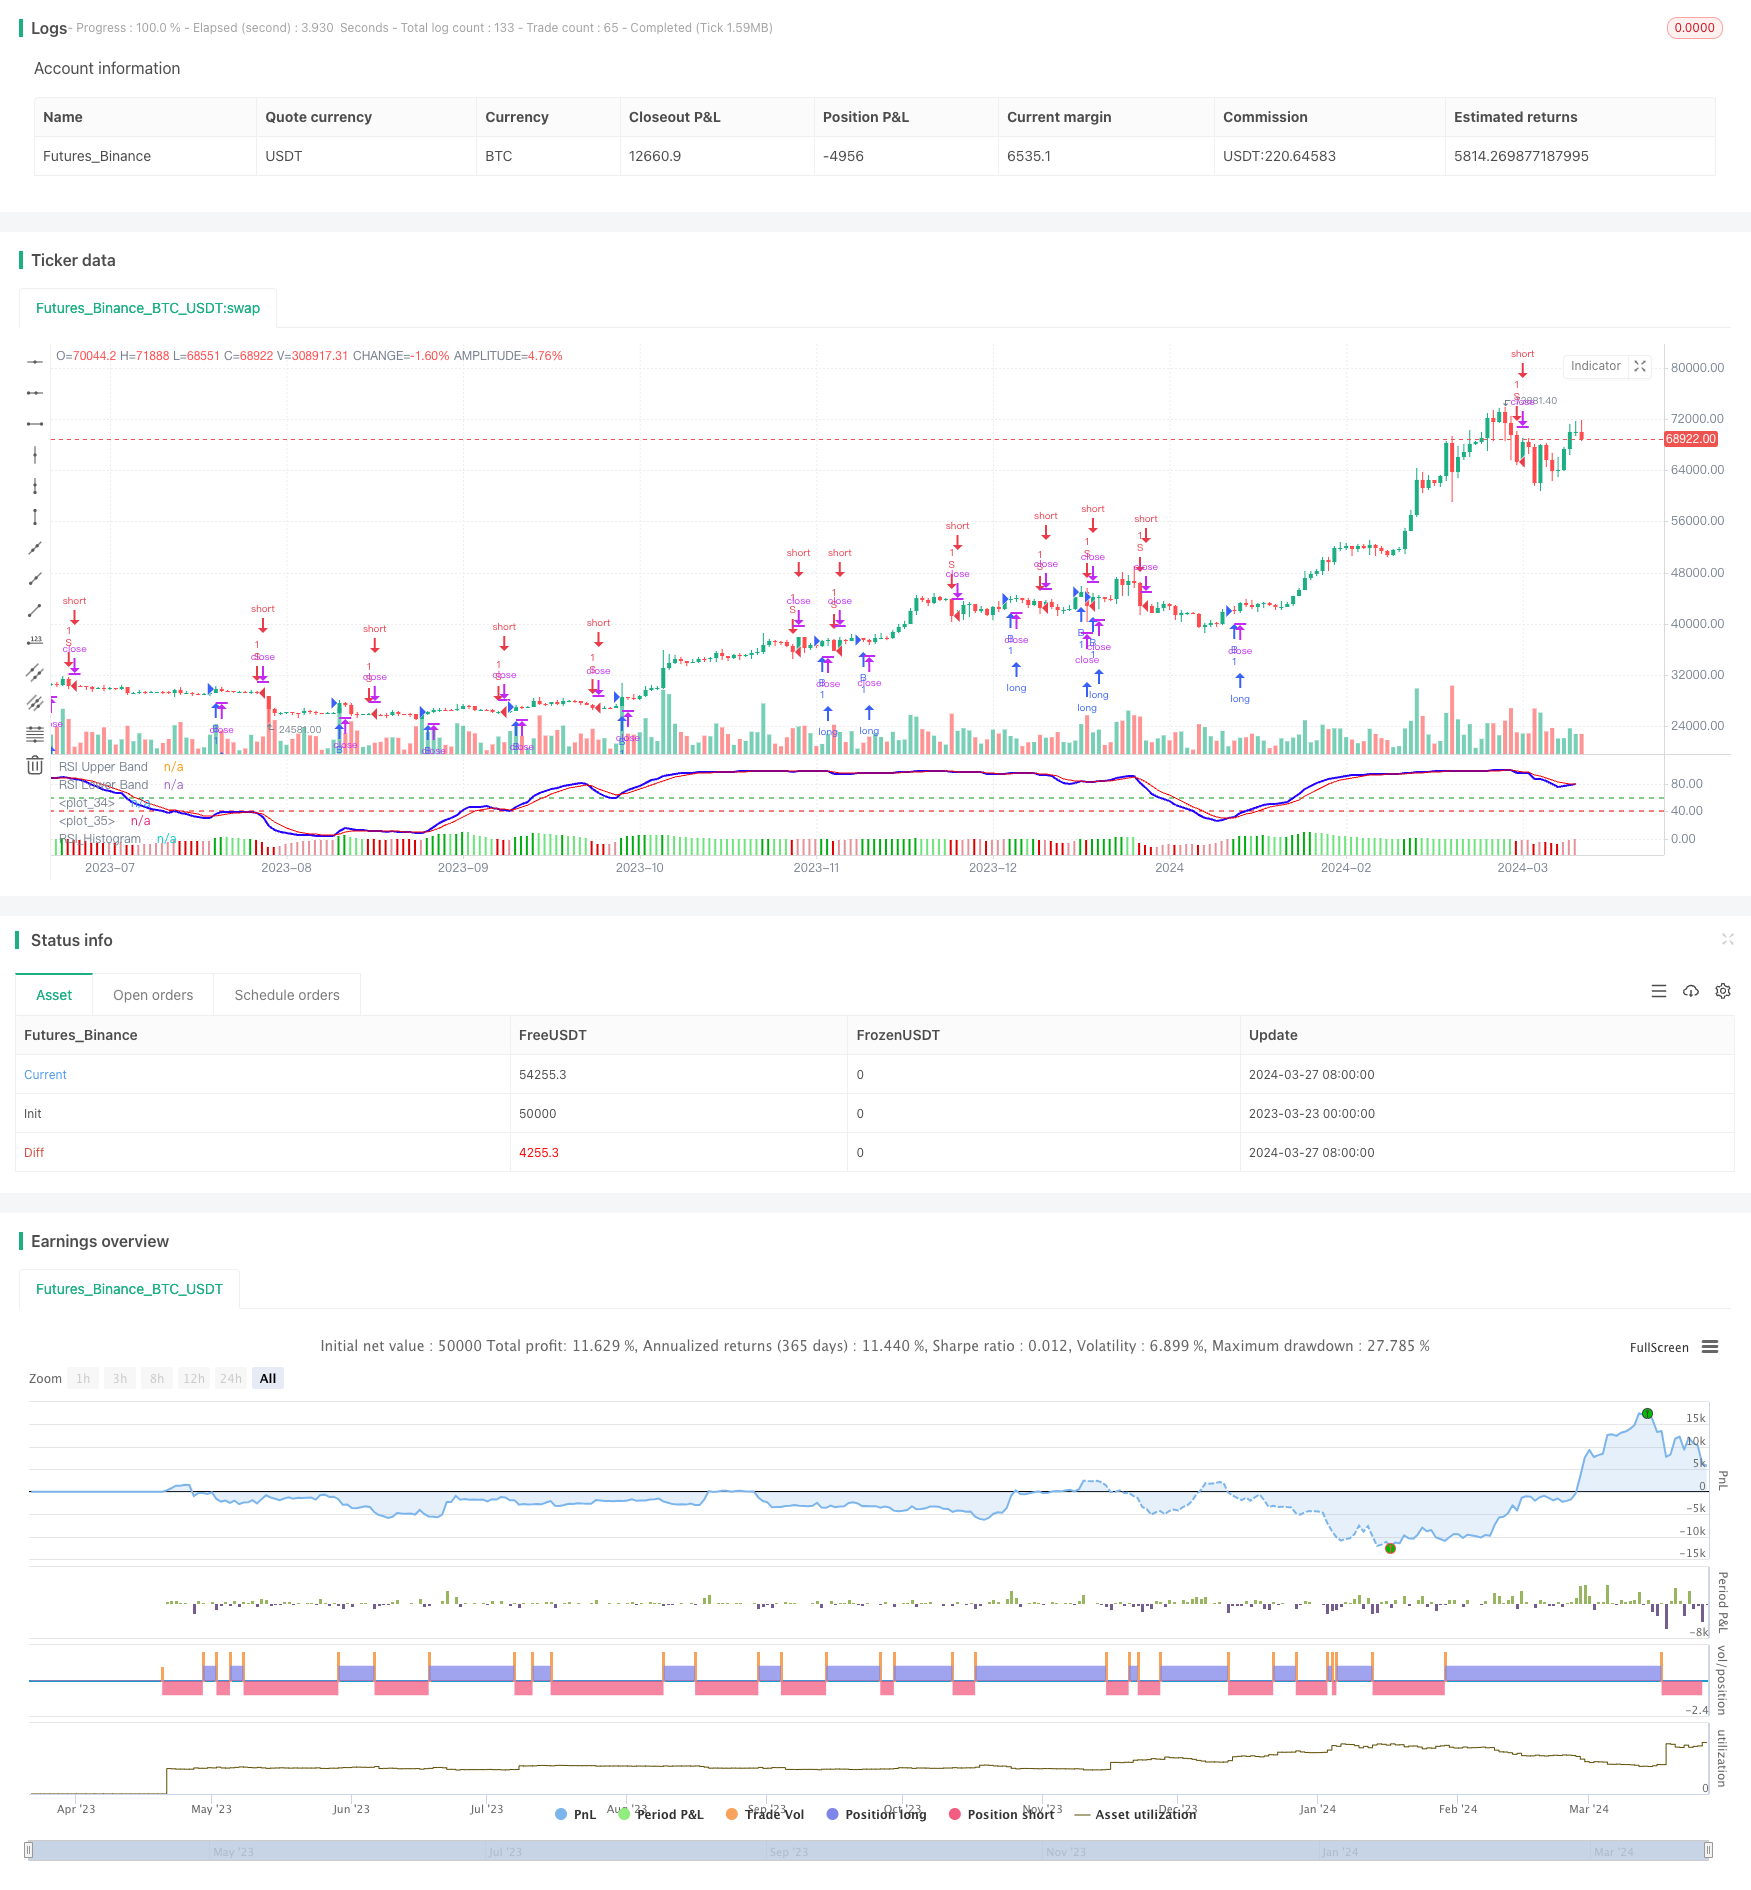
La estrategia se basa en un índice de fuerza relativa modificado (RSI modificado) para capturar las tendencias del mercado. La idea principal de la estrategia es utilizar las señales cruzadas y las señales de gráficos rectangulares del indicador RSI modificado para juzgar las tendencias del mercado y negociar en función de la dirección de la tendencia.
Principio de estrategia
- EMA de precio calculado como la entrada del RSI modificado
- Cálculo del índice RSI modificado
- Calcula el EMA del RSI Modificado como una línea de señal
- Calcula el diferencial entre el RSI modificado y la línea de señal como un gráfico rectangular
- Cuando la línea de señal cruza el RSI modificado y el diagrama es mayor que 0, se genera una señal de compra
- Cuando el RSI modificado atraviesa la línea de señal y el diagrama es menor que 0, genera una señal de venta
Ventajas estratégicas
- El RSI modificado capta mejor las tendencias que el RSI tradicional
- La combinación de la señal de cruce Modified RSI y la señal de gráfico rectangular, puede filtrar eficazmente las señales falsas
- Parámetros ajustables para diferentes mercados y ciclos
- El proceso es sencillo y el cálculo es eficiente.
Riesgo estratégico
- El indicador RSI modificado es propenso a generar señales erróneas en mercados convulsivos
- La captura de los puntos de inflexión de tendencias puede estar atrasada
- Los indicadores individuales pueden verse afectados por el ruido de los precios
Dirección de optimización de la estrategia
- Se puede combinar con otros indicadores de tendencias como las medias móviles para mejorar la fiabilidad de la señal
- Se puede agregar un módulo de stop loss para controlar el riesgo de una sola transacción
- Los parámetros se pueden optimizar en función de las diferentes características del mercado
- Se puede agregar un módulo de administración de posiciones para ajustar dinámicamente las posiciones
Resumir
La estrategia utiliza las características del indicador Modified RSI para construir un sistema de negociación desde el punto de vista del seguimiento de la tendencia. El indicador Modified RSI supera algunos de los defectos del indicador RSI tradicional y tiene una capacidad de captura de tendencias relativamente fuerte. Sin embargo, la estrategia de un solo indicador a menudo tiene limitaciones y necesita ser mejorada en combinación con otros medios tecnológicos.
/*backtest
start: 2023-03-23 00:00:00
end: 2024-03-28 00:00:00
period: 1d
basePeriod: 1h
exchanges: [{"eid":"Futures_Binance","currency":"BTC_USDT"}]
*/

// This source code is subject to the terms of the Mozilla Public License 2.0 at https://mozilla.org/MPL/2.0/
// © YogirajDange

//@version=5


// Verical lines


// // Define the times
// t1 = timestamp(year, month, dayofmonth, 09, 15) // 9:15
// t2 = timestamp(year, month, dayofmonth, 11, 15) // 11:15
// t3 = timestamp(year, month, dayofmonth, 13, 15) // 1:15
// t4 = timestamp(year, month, dayofmonth, 15, 25) // 3:25

// // Check if the current bar is on the current day
// is_today = (year(time) == year(timenow)) and (month(time) == month(timenow)) and (dayofmonth(time) == dayofmonth(timenow))

// // Draw a vertical line at each time
// if is_today and (time == t1 or time == t2 or time == t3 or time == t4)
//     line.new(x1 = bar_index, y1 = low, x2 = bar_index, y2 = high, extend = extend.both, color=color.red, width = 1)

strategy('Modified RSI')
col_grow_above = input(#02ac11, "Above   Grow", group="Histogram", inline="Above")
col_fall_above = input(#6ee47d, "Fall", group="Histogram", inline="Above")
col_grow_below = input(#e5939b, "Below Grow", group="Histogram", inline="Below")
col_fall_below = input(#dd0000, "Fall", group="Histogram", inline="Below")
EMA_length = input.int(13, 'Price_EMA', minval=1)
RSI_length = input.int(14, 'RSI_Period', minval=1)
Avg_length = input.int(5, 'RSI_Avg_EMA', minval=1)
fastMA = ta.ema(close, EMA_length)
modrsi = ta.rsi(fastMA, RSI_length)
RSIAVG = ta.ema(modrsi, Avg_length)
plot(modrsi, color=color.rgb(38, 0, 255), linewidth=2)
plot(RSIAVG, color=color.rgb(247, 0, 0))
rsiUpperBand = hline(60, 'RSI Upper Band', color=#099b0e)
//hline(50, "RSI Middle Band", color=color.new(#787B86, 50))
rsiLowerBand = hline(40, 'RSI Lower Band', color=#e90101)

RSI_hist = modrsi - RSIAVG

//plot(RSI_hist,"RSI_Histogram", color = #c201e9, style = plot.style_columns,linewidth= 5)

plot(RSI_hist, title="RSI_Histogram", style=plot.style_columns, color=(RSI_hist>=0 ? (RSI_hist[1] < RSI_hist ? col_grow_above : col_fall_above) : (RSI_hist[1] < RSI_hist ? col_grow_below : col_fall_below)))


/////// Moving Averages 20 50 EMA

fast_ma = input.int(20, minval=2, title="Fast_EMA")
slow_ma = input.int(50, minval=2, title="Slow_EMA")

src = input.source(close, title="Source")

out = ta.ema(src, fast_ma)
out1 = ta.ema(src, slow_ma)

//plot(out, title="20 EMA", color=color.rgb(117, 71, 247), linewidth = 2)
//plot(out1, title="50 EMA", color=color.rgb(0, 0, 0), linewidth = 2)


longCondition = ((ta.crossover(modrsi, RSIAVG)) and (RSI_hist > 0))
if longCondition
    strategy.entry('B', strategy.long)

shortCondition = ((ta.crossunder(modrsi, RSIAVG)) and (RSI_hist < 0))
if shortCondition
    strategy.entry('S', strategy.short)