Estrategia de seguimiento de tendencias de canal gaussiano
Descripción general
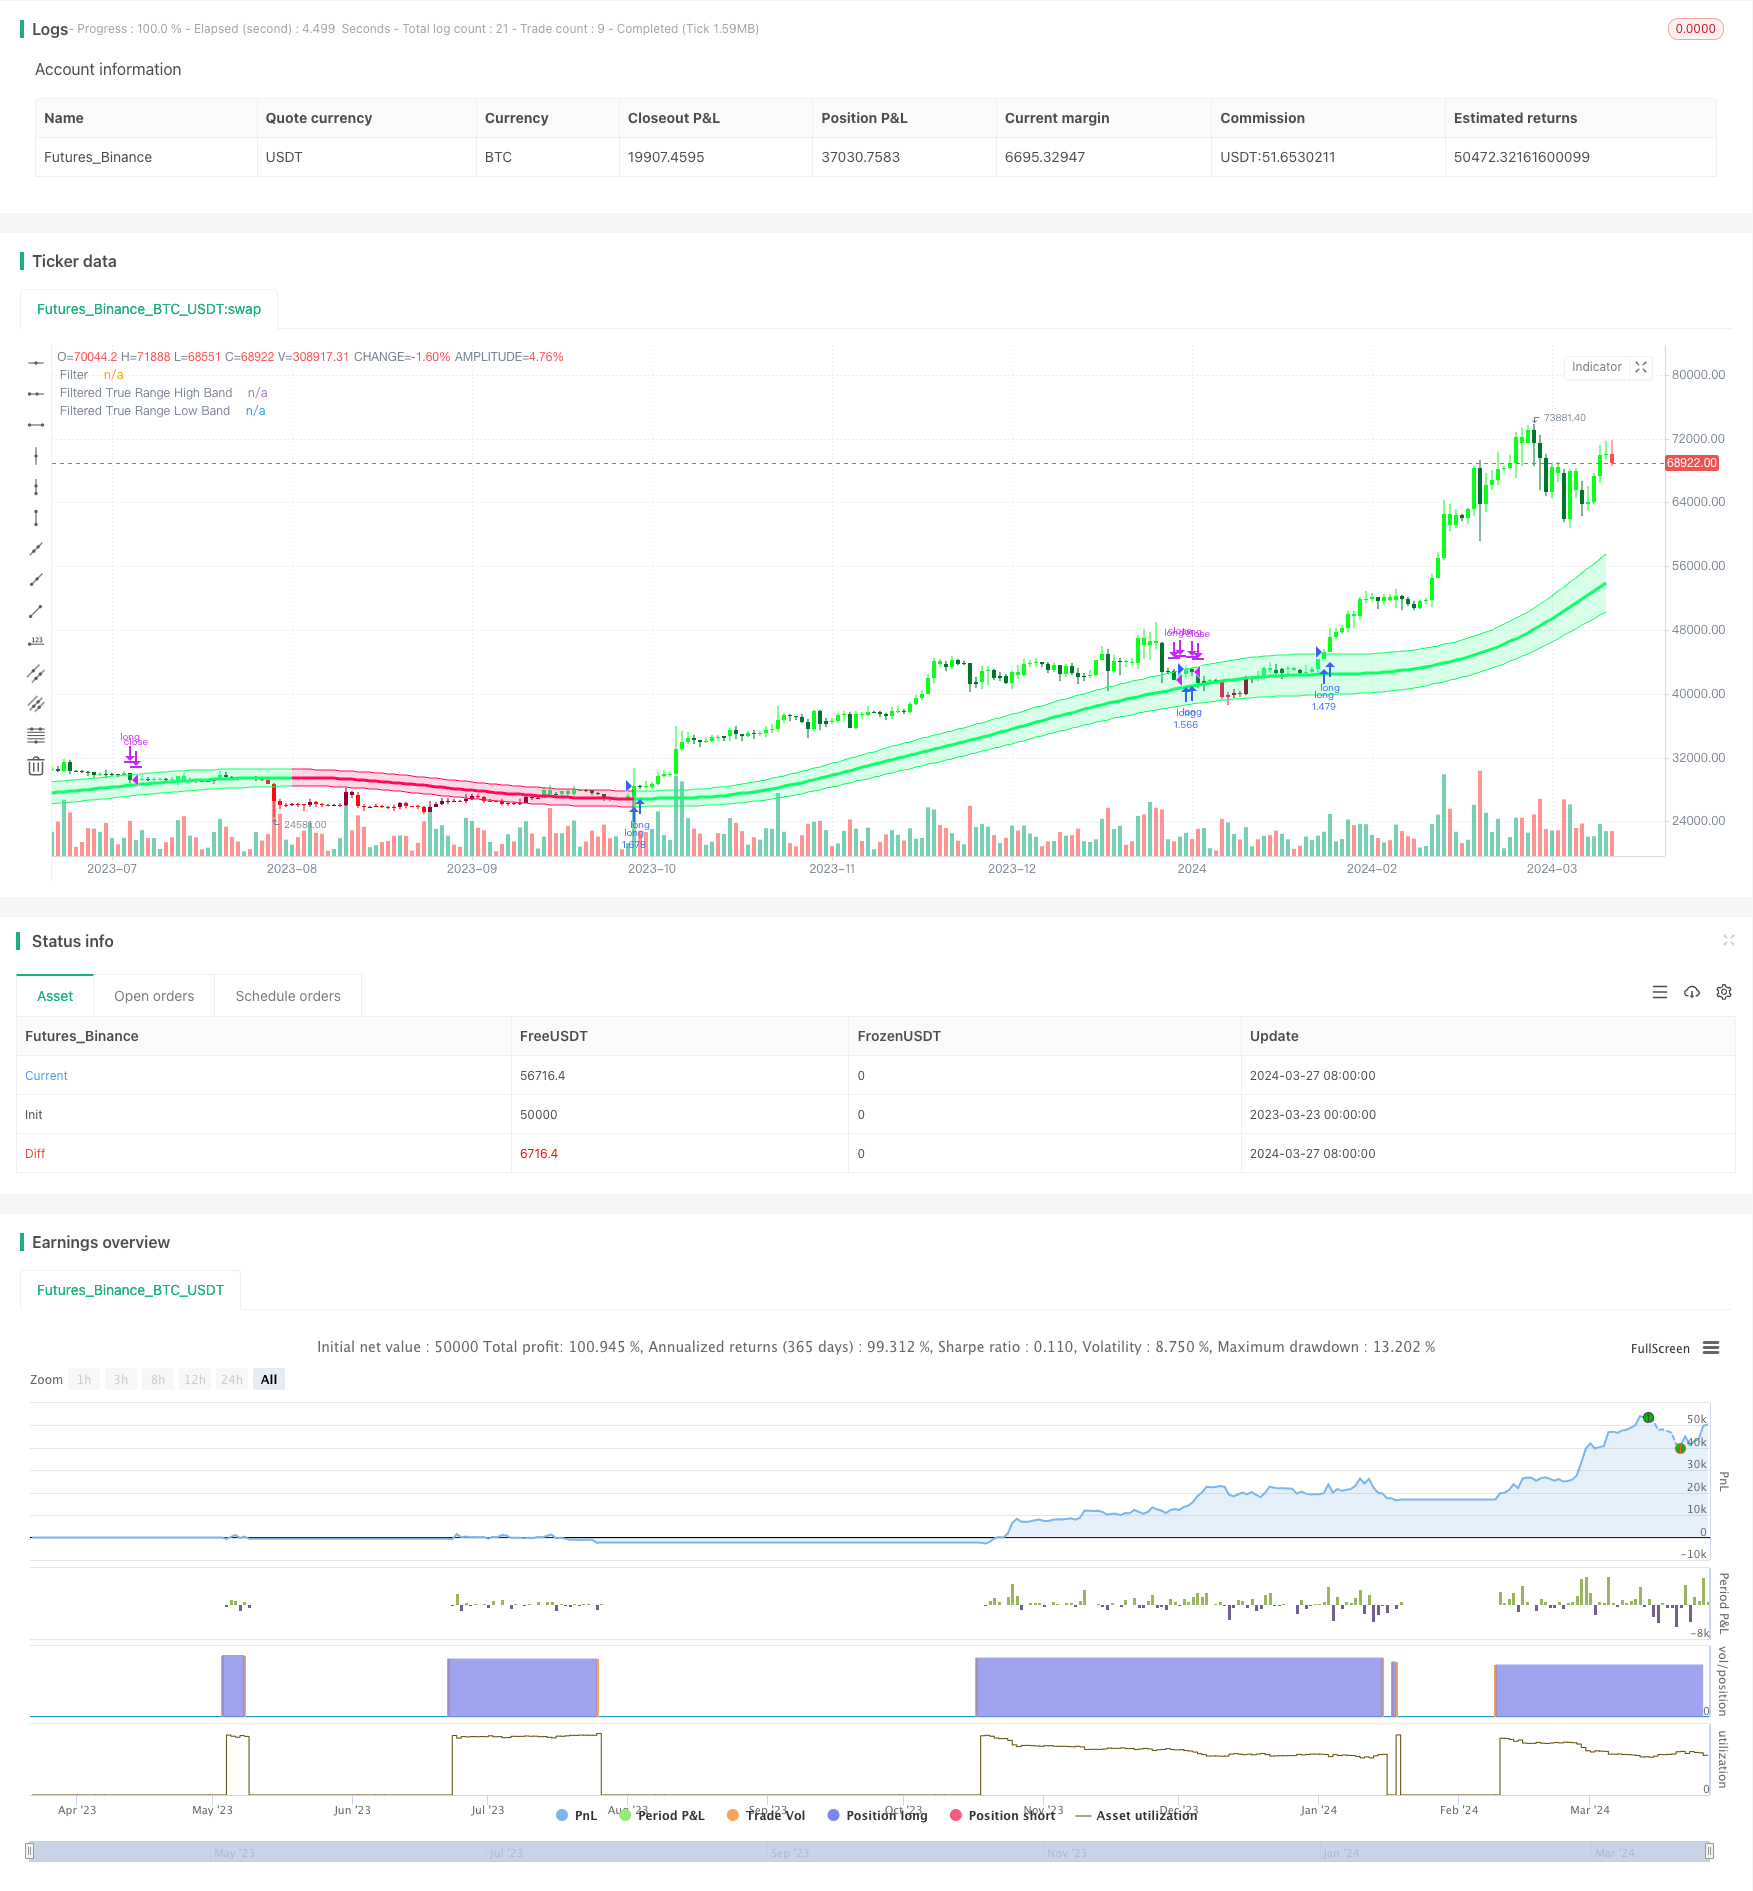
La estrategia de seguimiento de tendencias del canal gaúcho es una estrategia de negociación de seguimiento de tendencias basada en el indicador del canal gaúcho. La estrategia tiene como objetivo capturar la tendencia principal del mercado, comprar y mantener posiciones en tendencias al alza y cerrar posiciones en tendencias a la baja. La estrategia utiliza el indicador del canal gaúcho para identificar la dirección y la intensidad de la tendencia, y determinar el momento de compra y venta mediante el análisis de la relación entre el precio y la subida del canal.
Principio de estrategia
El indicador Gaussian Channel, desarrollado por Ehlers, es una herramienta de análisis de tendencias que utiliza la técnica de las ondas gaussianas en combinación con el rango verdadero (True Range). El indicador primero calcula los valores β y α en función del ciclo de muestreo y el número de puntos polares, luego procesa los datos en forma de filtro para obtener una curva de nivelación (Mid-Orbit).
Ventajas estratégicas
- Seguimiento de tendencias: Esta estrategia es buena para capturar las principales tendencias del mercado y invertir en la dirección de las tendencias, lo que ayuda a obtener beneficios estables a largo plazo.
- Reducción de la frecuencia de las operaciones: la estrategia sólo se inicia cuando se confirma la tendencia, manteniendo la posición mientras la tendencia continúa, lo que reduce el número de operaciones innecesarias y los costos de las operaciones.
- Reducción de la latencia: mediante la reducción de la latencia y el modo de reacción rápida, la estrategia puede reaccionar más a tiempo a los cambios en el mercado.
- Flexibilidad en los parámetros: los usuarios pueden ajustar los parámetros de la estrategia según sus necesidades, como el ciclo de muestra, el número de puntos polares, el múltiplo de alcance real, etc., para optimizar el rendimiento de la estrategia.
Riesgo estratégico
- Riesgo de optimización de parámetros: la configuración inadecuada de los parámetros puede conducir a un mal desempeño de la estrategia. Se recomienda la optimización y la retroalimentación de los parámetros en diferentes entornos de mercado para encontrar la combinación óptima de parámetros.
- Riesgo de cambio de tendencia: cuando la tendencia del mercado cambia repentinamente, la estrategia puede generar un gran retroceso. El riesgo se puede controlar mediante el establecimiento de un stop loss o la introducción de otros indicadores.
- Riesgo de mercado en crisis: en mercados en crisis, las estrategias pueden generar señales de negociación frecuentes, lo que puede afectar a las ganancias. Se pueden filtrar las señales mediante parámetros de optimización o en combinación con otros indicadores técnicos.
Dirección de optimización de la estrategia
- Introducción de otros indicadores técnicos: en combinación con otros indicadores de tendencia o de oscilación, como MACD, RSI, etc., para mejorar la precisión y la fiabilidad de la señal.
- Optimización de parámetros dinámicos: ajuste dinámico de los parámetros de la estrategia de acuerdo con los cambios en el estado del mercado para adaptarse a diferentes entornos de mercado.
- Agrega un módulo de control de riesgo: establece reglas razonables de stop loss y stop loss, controla el riesgo de una sola transacción y el nivel de retiro en general.
- Análisis de varios períodos de tiempo: combina señales de diferentes períodos de tiempo, como la línea diurna, la línea de 4 horas, etc., para obtener información más completa del mercado.
Resumir
La estrategia de seguimiento de tendencias del canal de Gauss es una estrategia de seguimiento de tendencias basada en la tecnología de las ondas de Gauss para obtener ganancias estables a largo plazo al capturar las principales tendencias del mercado. La estrategia utiliza los indicadores del canal de Gauss para identificar la dirección y la fuerza de la tendencia, al tiempo que ofrece funciones para reducir la latencia y la reacción rápida.
/*backtest
start: 2023-03-23 00:00:00
end: 2024-03-28 00:00:00
period: 1d
basePeriod: 1h
exchanges: [{"eid":"Futures_Binance","currency":"BTC_USDT"}]
*/

//@version=5
strategy(title="Gaussian Channel Strategy v2.0", overlay=true, calc_on_every_tick=false, initial_capital=1000, default_qty_type=strategy.percent_of_equity, default_qty_value=100, commission_type=strategy.commission.percent, commission_value=0.1, slippage=3)

//-----------------------------------------------------------------------------------------------------------------------------------------------------------------
// Gaussian Channel Indicaor - courtesy of @DonovanWall
//-----------------------------------------------------------------------------------------------------------------------------------------------------------------

// Date condition inputs
startDate = input(timestamp("1 January 2018 00:00 +0000"), "Date Start", group="Main Algo Settings")
endDate = input(timestamp("1 January 2060 00:00 +0000"), "Date Start", group="Main Algo Settings")
timeCondition = true

// This study is an experiment utilizing the Ehlers Gaussian Filter technique combined with lag reduction techniques and true range to analyze trend activity.
// Gaussian filters, as Ehlers explains it, are simply exponential moving averages applied multiple times.
// First, beta and alpha are calculated based on the sampling period and number of poles specified. The maximum number of poles available in this script is 9.
// Next, the data being analyzed is given a truncation option for reduced lag, which can be enabled with "Reduced Lag Mode".
// Then the alpha and source values are used to calculate the filter and filtered true range of the dataset.
// Filtered true range with a specified multiplier is then added to and subtracted from the filter, generating a channel.
// Lastly, a one pole filter with a N pole alpha is averaged with the filter to generate a faster filter, which can be enabled with "Fast Response Mode".

// Custom bar colors are included.

// Note: Both the sampling period and number of poles directly affect how much lag the indicator has, and how smooth the output is.
//      Larger inputs will result in smoother outputs with increased lag, and smaller inputs will have noisier outputs with reduced lag.
//      For the best results, I recommend not setting the sampling period any lower than the number of poles + 1. Going lower truncates the equation.

//-----------------------------------------------------------------------------------------------------------------------------------------------------------------
// Updates:
// Huge shoutout to @e2e4mfck for taking the time to improve the calculation method!
// -> migrated to v4
// -> pi is now calculated using trig identities rather than being explicitly defined.
// -> The filter calculations are now organized into functions rather than being individually defined.
// -> Revamped color scheme.

//-----------------------------------------------------------------------------------------------------------------------------------------------------------------
// Functions - courtesy of @e2e4mfck
//-----------------------------------------------------------------------------------------------------------------------------------------------------------------

// Filter function
f_filt9x (_a, _s, _i) =>
    int _m2 = 0, int _m3 = 0, int _m4 = 0, int _m5 = 0, int _m6 = 0,
    int _m7 = 0, int _m8 = 0, int _m9 = 0, float _f = .0, _x = (1 - _a)
    // Weights.
    // Initial weight _m1 is a pole number and equal to _i
    _m2 := _i == 9 ? 36  : _i == 8 ? 28 : _i == 7 ? 21 : _i == 6 ? 15 : _i == 5 ? 10 : _i == 4 ? 6 : _i == 3 ? 3 : _i == 2 ? 1 : 0
    _m3 := _i == 9 ? 84  : _i == 8 ? 56 : _i == 7 ? 35 : _i == 6 ? 20 : _i == 5 ? 10 : _i == 4 ? 4 : _i == 3 ? 1 : 0
    _m4 := _i == 9 ? 126 : _i == 8 ? 70 : _i == 7 ? 35 : _i == 6 ? 15 : _i == 5 ? 5  : _i == 4 ? 1 : 0
    _m5 := _i == 9 ? 126 : _i == 8 ? 56 : _i == 7 ? 21 : _i == 6 ? 6  : _i == 5 ? 1  : 0
    _m6 := _i == 9 ? 84  : _i == 8 ? 28 : _i == 7 ? 7  : _i == 6 ? 1  : 0
    _m7 := _i == 9 ? 36  : _i == 8 ? 8  : _i == 7 ? 1  : 0
    _m8 := _i == 9 ? 9   : _i == 8 ? 1  : 0
    _m9 := _i == 9 ? 1   : 0
    // filter
    _f :=   math.pow(_a, _i) * nz(_s) +
      _i  *     _x      * nz(_f[1])      - (_i >= 2 ?
      _m2 * math.pow(_x, 2)  * nz(_f[2]) : 0) + (_i >= 3 ?
      _m3 * math.pow(_x, 3)  * nz(_f[3]) : 0) - (_i >= 4 ?
      _m4 * math.pow(_x, 4)  * nz(_f[4]) : 0) + (_i >= 5 ?
      _m5 * math.pow(_x, 5)  * nz(_f[5]) : 0) - (_i >= 6 ?
      _m6 * math.pow(_x, 6)  * nz(_f[6]) : 0) + (_i >= 7 ?
      _m7 * math.pow(_x, 7)  * nz(_f[7]) : 0) - (_i >= 8 ?
      _m8 * math.pow(_x, 8)  * nz(_f[8]) : 0) + (_i == 9 ?
      _m9 * math.pow(_x, 9)  * nz(_f[9]) : 0)

// 9 var declaration fun
f_pole (_a, _s, _i) =>
    _f1 =            f_filt9x(_a, _s, 1),      _f2 = (_i >= 2 ? f_filt9x(_a, _s, 2) : 0), _f3 = (_i >= 3 ? f_filt9x(_a, _s, 3) : 0)
    _f4 = (_i >= 4 ? f_filt9x(_a, _s, 4) : 0), _f5 = (_i >= 5 ? f_filt9x(_a, _s, 5) : 0), _f6 = (_i >= 6 ? f_filt9x(_a, _s, 6) : 0)
    _f7 = (_i >= 2 ? f_filt9x(_a, _s, 7) : 0), _f8 = (_i >= 8 ? f_filt9x(_a, _s, 8) : 0), _f9 = (_i == 9 ? f_filt9x(_a, _s, 9) : 0)
    _fn = _i == 1 ? _f1 : _i == 2 ? _f2 : _i == 3 ? _f3 :
      _i == 4     ? _f4 : _i == 5 ? _f5 : _i == 6 ? _f6 :
      _i == 7     ? _f7 : _i == 8 ? _f8 : _i == 9 ? _f9 : na
    [_fn, _f1]

//-----------------------------------------------------------------------------------------------------------------------------------------------------------------
// Inputs
//-----------------------------------------------------------------------------------------------------------------------------------------------------------------

// Source
src = input(defval=hlc3, title="Source")

// Poles
int N = input.int(defval=4, title="Poles", minval=1, maxval=9)

// Period
int per = input.int(defval=144, title="Sampling Period", minval=2)

// True Range Multiplier
float mult = input.float(defval=1.414, title="Filtered True Range Multiplier", minval=0)

// Lag Reduction
bool modeLag  = input.bool(defval=false, title="Reduced Lag Mode")
bool modeFast = input.bool(defval=false, title="Fast Response Mode")

//-----------------------------------------------------------------------------------------------------------------------------------------------------------------
// Definitions
//-----------------------------------------------------------------------------------------------------------------------------------------------------------------

// Beta and Alpha Components
beta  = (1 - math.cos(4*math.asin(1)/per)) / (math.pow(1.414, 2/N) - 1)
alpha = - beta + math.sqrt(math.pow(beta, 2) + 2*beta)

// Lag
lag = (per - 1)/(2*N)

// Data
srcdata = modeLag ? src + (src - src[lag]) : src
trdata  = modeLag ? ta.tr(true) + (ta.tr(true) - ta.tr(true)[lag]) : ta.tr(true)

// Filtered Values
[filtn, filt1]     = f_pole(alpha, srcdata, N)
[filtntr, filt1tr] = f_pole(alpha, trdata,  N)

// Lag Reduction
filt   = modeFast ? (filtn + filt1)/2 : filtn
filttr = modeFast ? (filtntr + filt1tr)/2 : filtntr

// Bands
hband = filt + filttr*mult
lband = filt - filttr*mult

// Colors
color1   = #0aff68
color2   = #00752d
color3   = #ff0a5a
color4   = #990032
fcolor   = filt > filt[1] ? #0aff68 : filt < filt[1] ? #ff0a5a : #cccccc
barcolor = (src > src[1]) and (src > filt) and (src < hband) ? #0aff68 : (src > src[1]) and (src >= hband) ? #0aff1b : (src <= src[1]) and (src > filt) ? #00752d :
           (src < src[1]) and (src < filt) and (src > lband) ? #ff0a5a : (src < src[1]) and (src <= lband) ? #ff0a11 : (src >= src[1]) and (src < filt) ? #990032 : #cccccc

//-----------------------------------------------------------------------------------------------------------------------------------------------------------------
// Outputs
//-----------------------------------------------------------------------------------------------------------------------------------------------------------------

// Filter Plot
filtplot = plot(filt, title="Filter", color=fcolor, linewidth=3)

// Band Plots
hbandplot = plot(hband, title="Filtered True Range High Band", color=fcolor)
lbandplot = plot(lband, title="Filtered True Range Low Band", color=fcolor)

// Channel Fill
fill(hbandplot, lbandplot, title="Channel Fill", color=color.new(fcolor, 80))

// Bar Color
barcolor(barcolor)

longCondition = ta.crossover(close, hband) and timeCondition
closeAllCondition = ta.crossunder(close, hband) and timeCondition

if longCondition
    strategy.entry("long", strategy.long)

if closeAllCondition
    strategy.close("long")