Estrategia de trading cuantitativo con control dinámico de riesgo y seguimiento de tendencias de múltiples indicadores

Descripción general
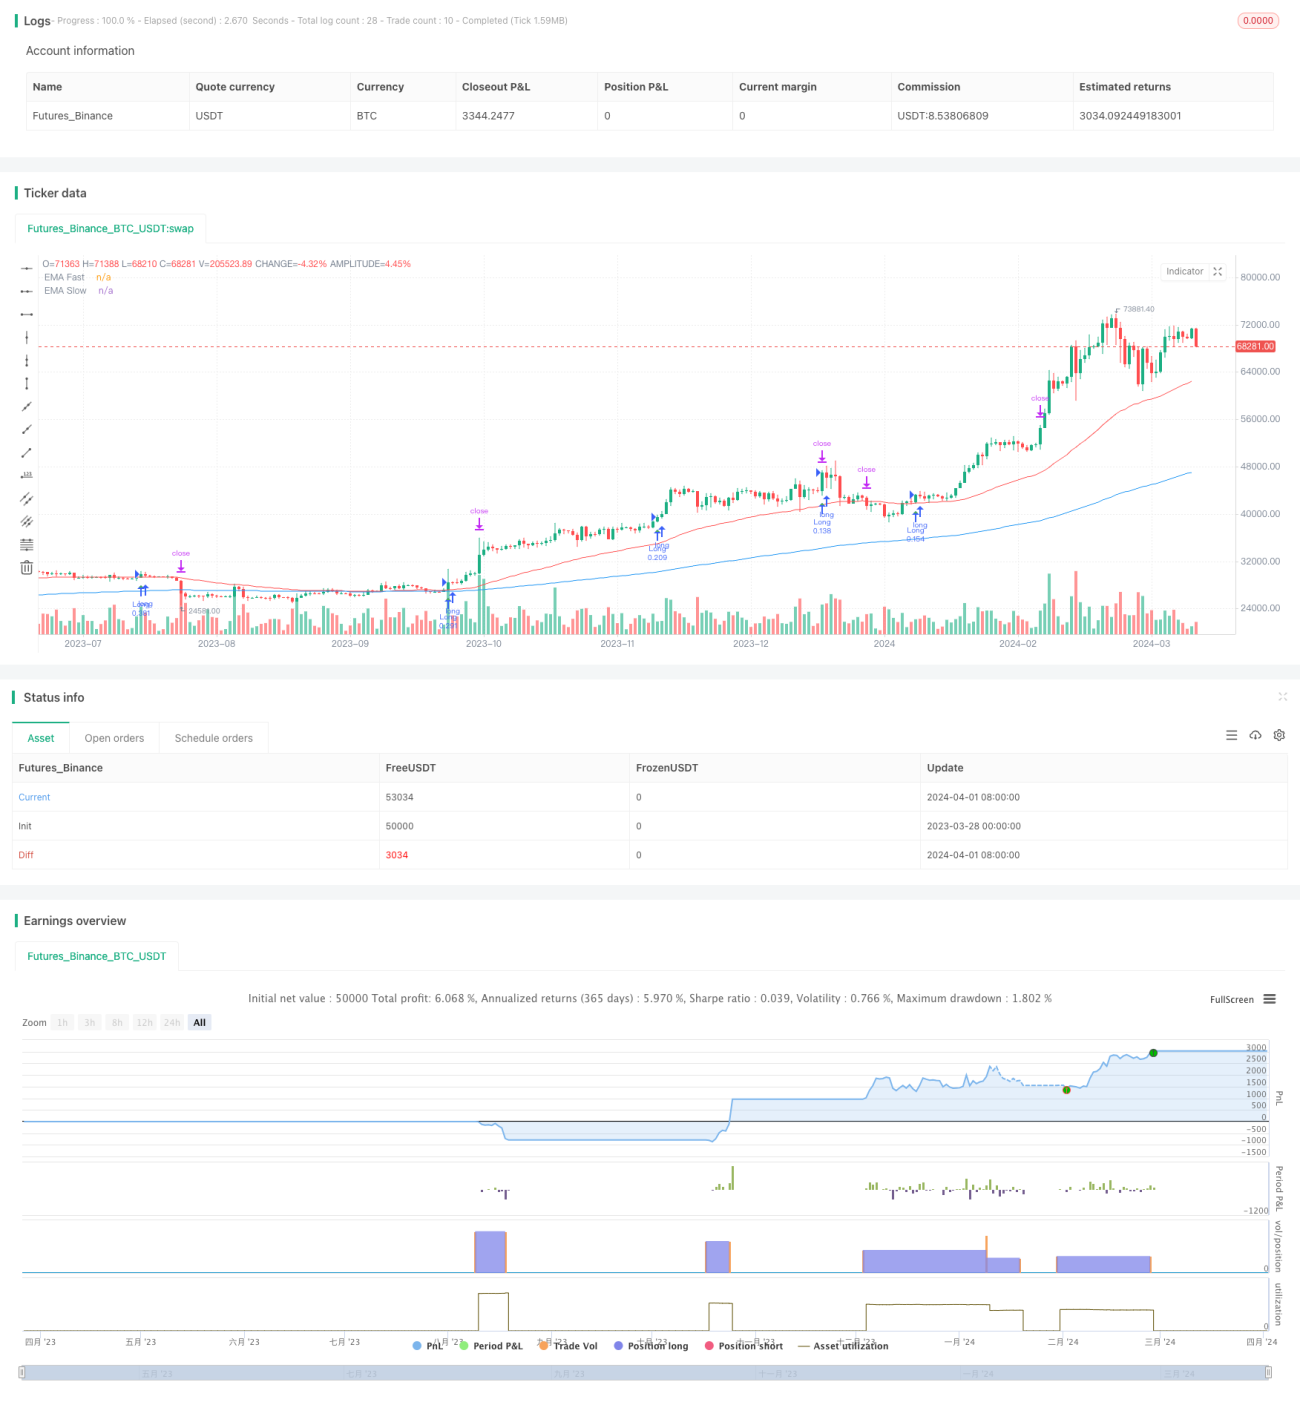
La estrategia utiliza varios indicadores técnicos, como el índice de fuerza relativa (RSI), el indicador de dispersión de convergencia de la media móvil (MACD), el índice de media móvil (EMA) y la amplitud real promedio (ATR), combinado con un mecanismo de gestión de posición dinámica y paradas de pérdidas y pérdidas, para lograr una estrategia de comercio cuantitativa de seguimiento de tendencias integral. La estrategia analiza la velocidad, la dirección, la intensidad y la volatilidad de los precios y se adapta a varios entornos de mercado para capturar las tendencias del mercado y controlar el riesgo.
Principio de estrategia
- El RSI se utiliza para medir la velocidad y la amplitud de los cambios en los precios, para identificar el estado de sobrecompra y sobreventa, y para proporcionar señales para el comercio.
- El MACD determina el movimiento, la dirección y la intensidad de los cambios en los precios mediante el análisis diferencial de las medias móviles rápidas y lentas, lo que sugiere un punto de cambio de tendencia.
- El doble EMA cruza la dirección de confirmación de la tendencia, la línea rápida que rompe la línea lenta se considera una señal de mira más, y la línea rápida que cae la línea lenta se considera una señal de mira hacia arriba.
- ATR mide la volatilidad del mercado y se utiliza para ajustar dinámicamente los niveles de stop loss y stop loss para adaptarse a diferentes estados del mercado.
- Combinando las múltiples condiciones de RSI, MACD y EMA, la estrategia abre posiciones extras cuando se forma una tendencia de varios extremos, y abre posiciones exteriores cuando se forma una tendencia de la parte de arriba.
- Utiliza el ATR como referencia de pérdidas y establece objetivos de ganancias dinámicas, manteniendo el riesgo/beneficio por transacción.
- Basado en la brecha de riesgo estratégica y la volatilidad de los activos indicados, ajuste dinámico de la posición de cada transacción para lograr la constancia de la brecha de riesgo.
Ventajas estratégicas
- Seguimiento de tendencias: estrategias basadas en varios indicadores técnicos para identificar tendencias y capturar oportunidades de tendencias a medio y largo plazo en el mercado.
- Control de riesgo dinámico: los niveles de stop loss y stop stop se ajustan a la dinámica de ATR para adaptarse a diferentes estados de mercado de volatilidad y controlar el riesgo de una sola operación.
- Gestión de posiciones: toma en cuenta el tamaño de la cuenta y la volatilidad de los indicadores, optimiza automáticamente las posiciones de cada transacción y mantiene estable la apertura de riesgo general.
- Adaptabilidad: los parámetros de la estrategia se pueden ajustar con flexibilidad para diferentes mercados, variedades y estilos de inversión.
- Estricta disciplina: ejecutar operaciones basadas en reglas cuantitativas, eliminar el impacto de las emociones subjetivas y garantizar la objetividad y la coherencia de la estrategia.
Riesgo estratégico
- Riesgo de mercado: la incertidumbre en los mercados financieros, incluyendo la influencia de factores económicos, políticos, eventos inesperados, etc., puede causar que el rendimiento de la estrategia se desvíe de las expectativas.
- Riesgo de parámetros: la configuración inadecuada de los parámetros puede llevar a que la estrategia se ajuste demasiado a los datos históricos y no funcione bien en aplicaciones reales.
- Puntos de deslizamiento y costos de transacción: Los puntos de deslizamiento y las comisiones en las transacciones reales pueden afectar el beneficio neto de la estrategia.
- Situaciones extremas: la estrategia puede enfrentarse a un retiro mayor en situaciones extremas (como un entorno de fluctuación rápida, agotamiento de la liquidez, etc.).
Dirección de optimización de la estrategia
- Optimización de parámetros: busca la combinación óptima de parámetros para mejorar la solidez y adaptabilidad de la estrategia mediante el retroceso de los datos históricos.
- Configuración dinámica de las posiciones vacantes: ajuste dinámico de la proporción de las posiciones vacantes en función de la intensidad y la dirección de las tendencias del mercado para comprender mejor las tendencias.
- Juzgar el estado del mercado: combinar indicadores como la volatilidad y la correlación para juzgar el estado del mercado y adoptar un ajuste estratégico correspondiente en diferentes estados.
- En combinación con el análisis fundamental, los factores fundamentales, como la macroeconomía y las tendencias de la industria, se toman en cuenta para guiar el uso e interpretación de los indicadores técnicos.
- Optimización de los controles de riesgo: basado en el bloqueo dinámico de pérdidas, añade medios de gestión de riesgos avanzados, como la optimización de la cartera de inversiones, el uso de instrumentos de cobertura, etc.
Resumir
La estrategia utiliza posiciones dinámicas y gestión de riesgos para controlar el riesgo de retiro mientras se capta la oportunidad de la tendencia. La estrategia es muy adaptable y se puede ajustar de manera óptima según las características del mercado y las necesidades de inversión. Pero en la aplicación real, se debe prestar atención a factores como el riesgo del mercado, la configuración de los parámetros y el costo de la negociación, y evaluar y optimizar la estrategia periódicamente.
//@version=5
strategy("Enhanced Professional Strategy V6", shorttitle="EPS V6", overlay=true)

// Input parameters with tooltips for enhanced user understanding.
rsiPeriod = input.int(14, title="RSI Period", tooltip="Period length for the Relative Strength Index. Standard setting is 14. Adjust to increase or decrease sensitivity.")
macdFastLength = input.int(12, title="MACD Fast Length", tooltip="Length for the fast EMA in the MACD. Typical setting is 12. Adjust for faster signal response.")
macdSlowLength = input.int(26, title="MACD Slow Length", tooltip="Length for the slow EMA in the MACD. Standard setting is 26. Adjust for slower signal stabilization.")
macdSmoothing = input.int(9, title="MACD Smoothing", tooltip="Smoothing length for the MACD signal line. Commonly set to 9. Modifies signal line smoothness.")
atrLength = input.int(14, title="ATR Length", tooltip="Period length for the Average True Range. Used to measure market volatility.")
riskRewardRatio = input.float(2.0, title="Risk/Reward Ratio", tooltip="Your target risk vs. reward ratio. A setting of 2.0 aims for profits twice the size of the risk.")
emaFastLength = input.int(50, title="EMA Fast Length", tooltip="Period length for the fast Exponential Moving Average. Influences trend sensitivity.")
emaSlowLength = input.int(200, title="EMA Slow Length", tooltip="Period length for the slow Exponential Moving Average. Determines long-term trend direction.")- 1