Estrategia dual RSI y bandas de Bollinger

Descripción general
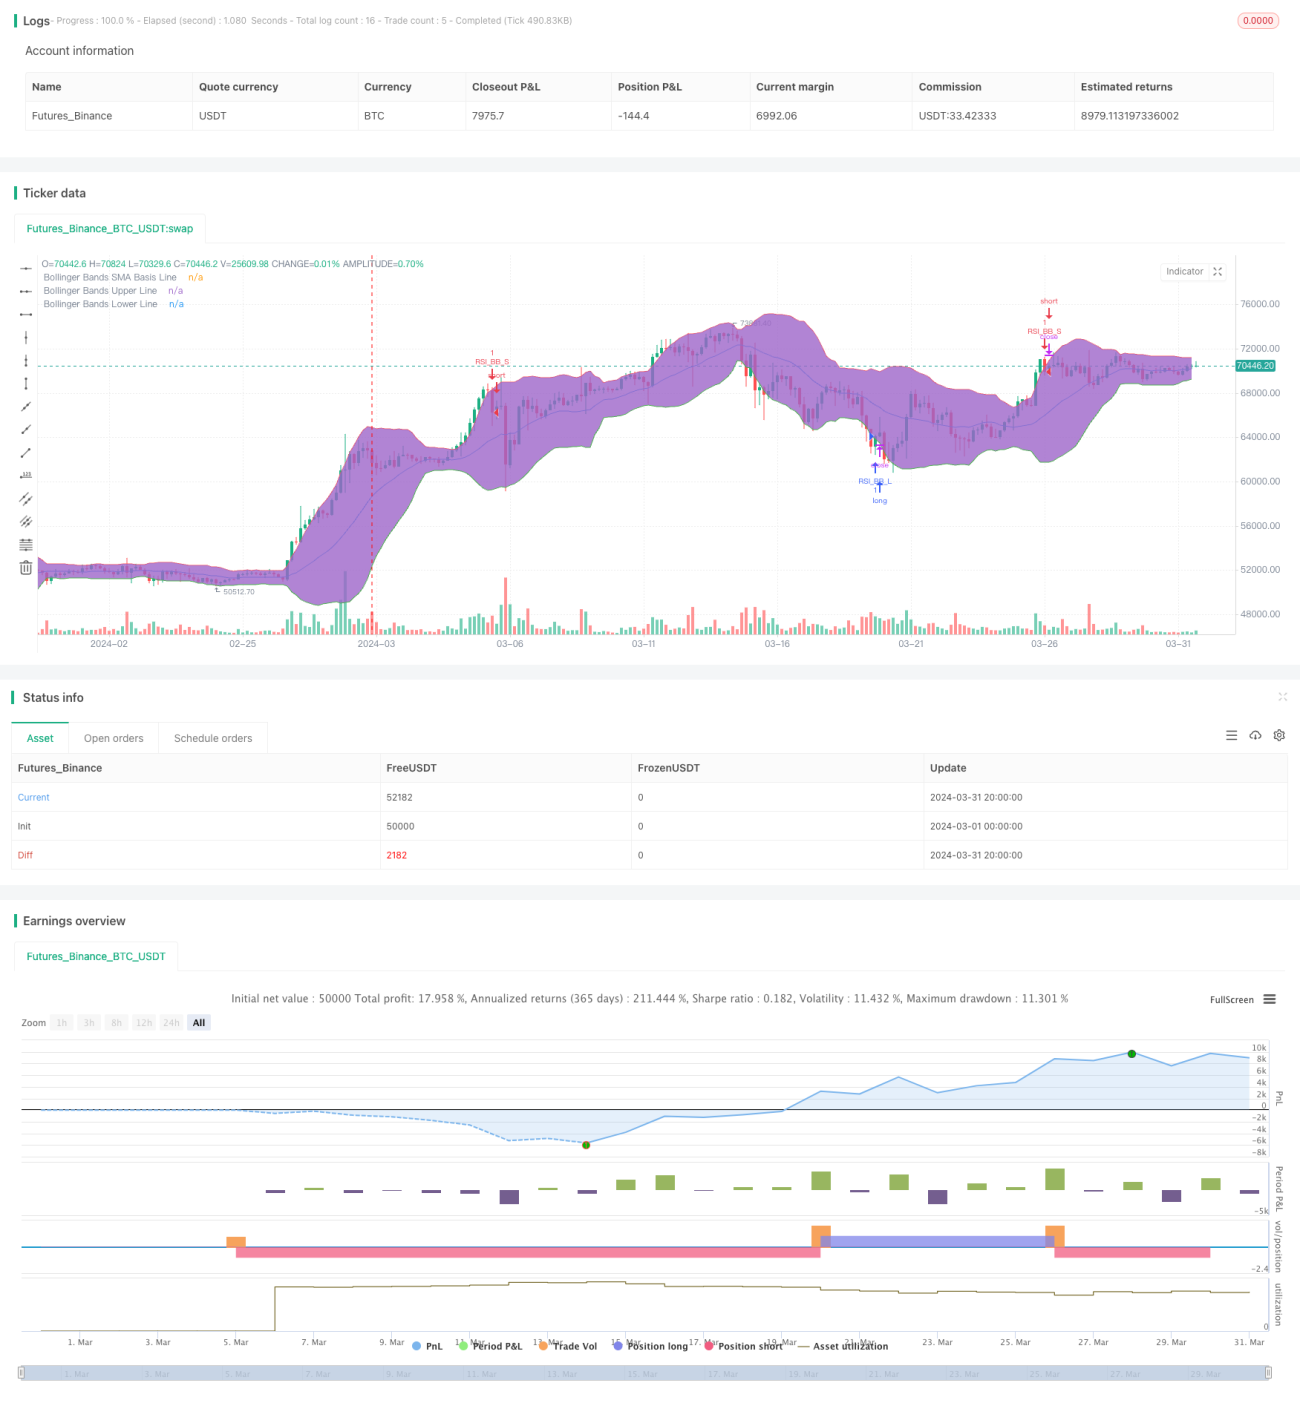
La estrategia combina dos indicadores técnicos, el índice de fuerza relativa (RSI) y las bandas de Bollinger (Bollinger Bands), para generar una señal de compra cuando el precio está por debajo de la banda de Bollinger y una señal de venta cuando el precio está por encima de la banda de Bollinger. La estrategia solo dispara una señal de negociación cuando el indicador RSI y el indicador de Bollinger están a la vez en un estado de sobreventa o sobreventa.
Principio de estrategia
- Calcula el valor RSI de acuerdo con el parámetro RSI establecido.
- El uso de la fórmula de la banda de Brin para calcular el medio de la banda de Brin, el tren superior y el tren inferior.
- Para determinar si el precio de cierre actual ha roto la banda de Brin para subir o bajar.
- Determine si el RSI actual está por encima de la brecha de sobreventa o por debajo de la de sobreventa.
- Cuando el indicador de la banda de Brin y el RSI cumplen al mismo tiempo las condiciones de compra o venta, se genera la correspondiente señal de negociación.
Ventajas estratégicas
- La combinación de los indicadores técnicos de tendencia y dinámica permite un juicio más amplio de la situación del mercado.
- El uso simultáneo de dos indicadores como condiciones de filtración reduce la probabilidad de falsas señales.
- La lógica del código es clara, los parámetros son flexibles y se adaptan a diferentes entornos de mercado y estilos de negociación.
Riesgo estratégico
- En un mercado convulso, esta estrategia puede generar más pérdidas.
- La configuración incorrecta de los parámetros puede causar un mal rendimiento de la estrategia, que necesita ser optimizada en función de la situación real.
- La estrategia no tiene un límite de pérdidas y podría tener un mayor riesgo de retirada.
Dirección de optimización de la estrategia
- Los parámetros del RSI y el Brin se pueden optimizar según las características del mercado y las preferencias personales.
- La introducción de otros indicadores técnicos, como MACD, mediano, etc., mejora la fiabilidad de la señal.
- Establezca un stop loss y un stop loss razonables para controlar el riesgo de una sola transacción.
- Para los mercados convulsivos, se puede considerar la posibilidad de aumentar las condiciones de juicio o reducir la posición, reduciendo los costos asociados con el comercio frecuente.
Resumir
El RSI y la doble estrategia de las bandas de Brin, mediante la combinación de indicadores de tendencia y dinámica, pueden juzgar de manera más completa el estado del mercado y dar una señal de negociación correspondiente. Sin embargo, la estrategia puede tener un mal desempeño en mercados convulsos y no se establecen medidas de control de riesgo, por lo que se debe tener cuidado al operar en el mercado real.
/*backtest
start: 2024-03-01 00:00:00
end: 2024-03-31 23:59:59
period: 4h
basePeriod: 15m
exchanges: [{"eid":"Futures_Binance","currency":"BTC_USDT"}]
*/

//@version=4
strategy("Bollinger + RSI, Double Strategy (by ChartArt) v1.1", shorttitle="CA_-_RSI_Bol_Strat_1.1", overlay=true)

// ChartArt's RSI + Bollinger Bands, Double Strategy - Update- 1