Estrategia de ganancias multicapa con cruce de medias móviles

Descripción general
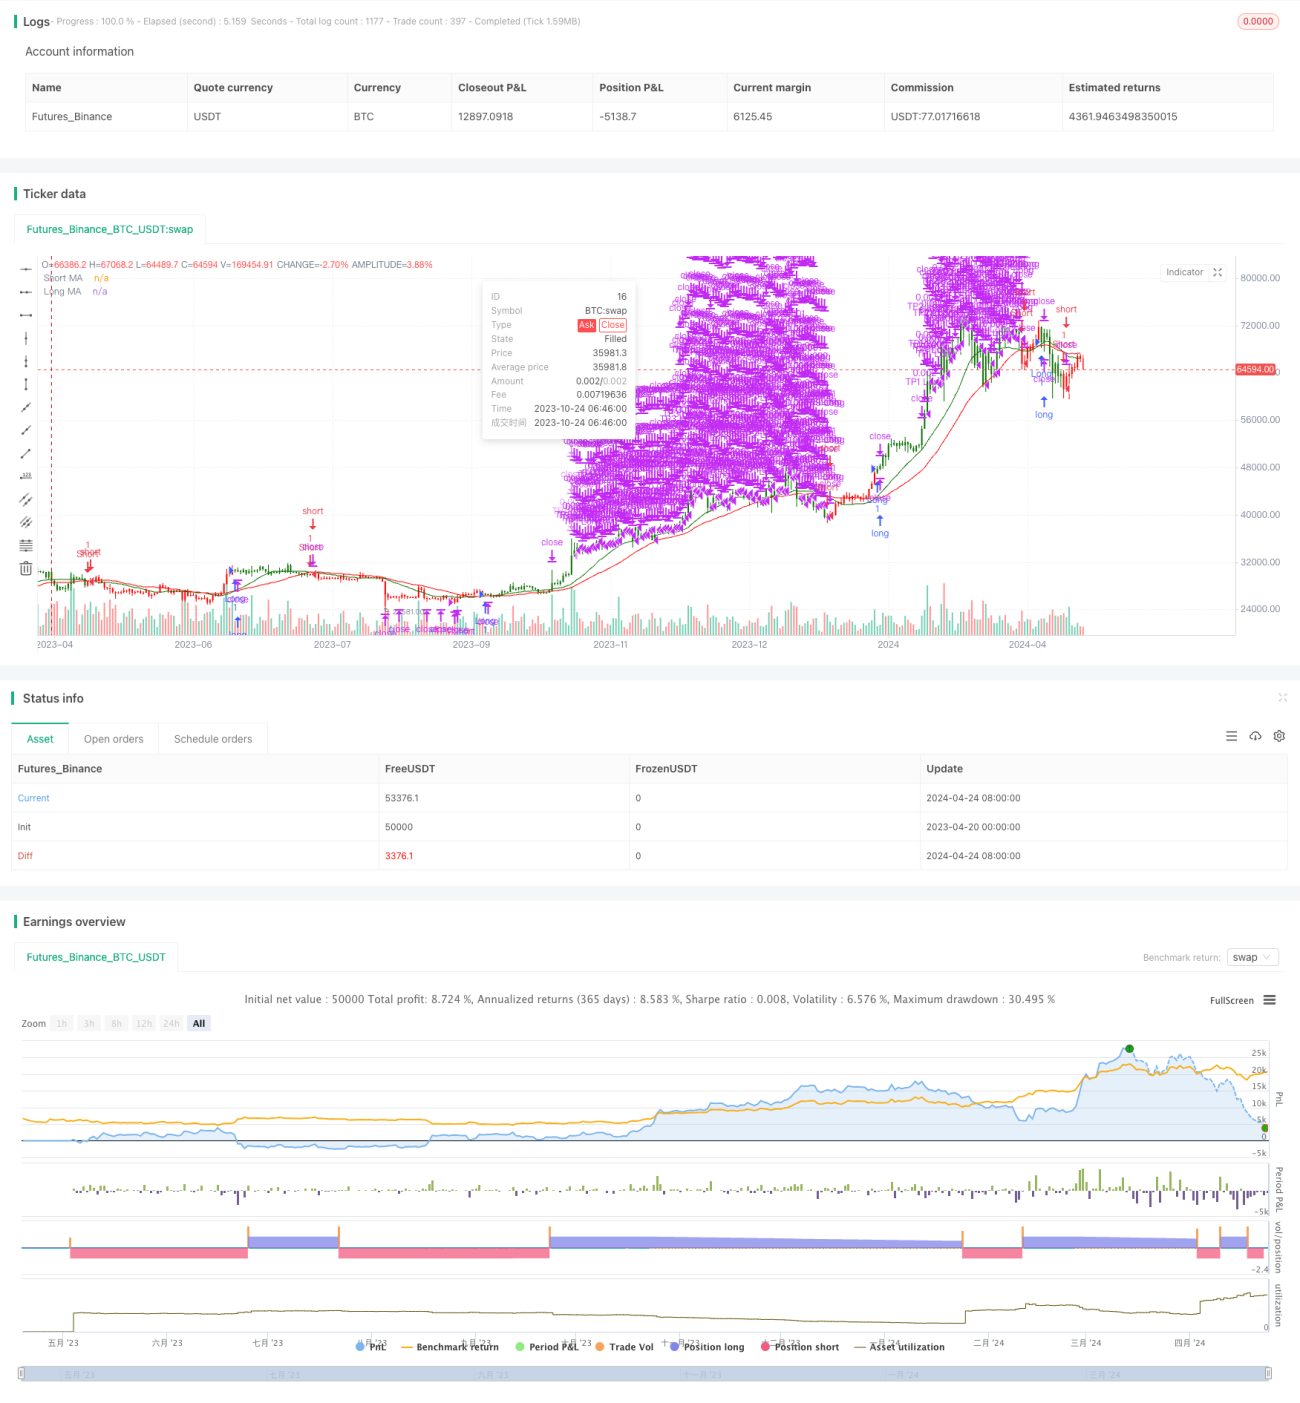
La estrategia utiliza el cruce de dos medias móviles para determinar la tendencia del mercado, y abre posiciones extras y extras cuando se cruza la media móvil a largo plazo en las medias móviles a corto plazo. Al mismo tiempo, la estrategia utiliza el método de cierre de ganancias en varios niveles, y cierra las posiciones en lotes cuando el precio alcanza el nivel de ganancias predeterminado, para maximizar los beneficios y controlar el riesgo.
Principio de estrategia
El núcleo de la estrategia es el uso de las medias móviles de diferentes períodos para capturar la tendencia del mercado. Cuando el corto plazo de las medias móviles sobre el largo plazo de las medias móviles, significa que el mercado puede entrar en una tendencia al alza, a continuación, abrir más posiciones; cuando el corto plazo de las medias móviles por debajo de la media de movimiento a largo plazo, significa que el mercado puede entrar en una tendencia a la baja, a continuación, abrir una posición vacía.
Ventajas estratégicas
- Sencilla y eficaz: La estrategia se basa en el clásico principio de la media móvil cruzada, es simple y fácil de entender, a la vez que ha demostrado su eficacia en la práctica.
- La conclusión de la ganancia múltiple: Al establecer varios niveles de ganancia y cerrar las posiciones en lotes cuando los precios alcanzan estos niveles, se puede maximizar los beneficios, al mismo tiempo que se controla el riesgo.
- Parámetros flexibles: La configuración de los parámetros de la estrategia es muy flexible, y los usuarios pueden ajustar el ciclo de las medias móviles y el nivel de ganancias según sus necesidades y características del mercado para obtener el mejor resultado.
Riesgo estratégico
- Riesgo de fluctuación del mercado: cuando el mercado está en una situación de gran volatilidad, las frecuentes señales de cruce pueden conducir a una estrategia de negociación frecuente, aumentando los costos de negociación y el riesgo de retiro.
- Riesgo de configuración de parámetros: la configuración inadecuada de los parámetros puede conducir a un mal desempeño de la estrategia, como la elección incorrecta del ciclo de la media móvil o la configuración inadecuada del nivel de ganancias, etc.
- Riesgo de identificación de tendencias: la estrategia depende principalmente de las tendencias, y puede presentarse una mayor cantidad de falsas señales cuando el mercado está inestable o la tendencia no es clara, lo que puede provocar pérdidas.
Dirección de optimización de la estrategia
- Combinación con otros indicadores: Se puede considerar la combinación con otros indicadores técnicos, como RSI, MACD, etc., para mejorar la precisión y la fiabilidad de la identificación de tendencias.
- Parámetros de optimización: se puede buscar el ciclo de la media móvil óptimo y los parámetros de nivel de ganancias para adaptarse a diferentes condiciones de mercado mediante la retroalimentación y la optimización.
- Adición de stop loss: Se puede considerar la adición de un mecanismo de stop loss para controlar aún más el riesgo, por ejemplo, el stop loss dinámico de acuerdo con la configuración de ATR.
- Modificación de entradas y salidas: se pueden explorar más condiciones de entrada y salida, como factores como el volumen de transacciones, la resistencia de soporte, etc., para mejorar la estabilidad de la estrategia.
Resumir
La estrategia de ganancias de múltiples capas de la media móvil cruzada es una estrategia de seguimiento de tendencias simple y efectiva, que permite obtener más ganancias en la tendencia al mismo tiempo que controla el riesgo a través de la forma en que se obtienen ganancias de múltiples capas. Sin embargo, la estrategia también tiene algunas limitaciones y riesgos, que deben optimizarse y mejorarse según las condiciones específicas del mercado y las necesidades de los usuarios. En general, la estrategia puede ser una herramienta de negociación efectiva, pero no puede depender completamente de ella, y debe combinarse con otros métodos de análisis y medidas de gestión de riesgos para obtener el mejor efecto.
/*backtest
start: 2023-04-20 00:00:00
end: 2024-04-25 00:00:00
period: 1d
basePeriod: 1h
exchanges: [{"eid":"Futures_Binance","currency":"BTC_USDT"}]
*/

// This Pine Script™ code is subject to the terms of the Mozilla Public License 2.0 at https://mozilla.org/MPL/2.0/
// © ValdesTradingBots

//Follow Us for More Insights and Updates!- 1