Estrategia de seguimiento de tendencias y media móvil de señales de KDJ

Descripción general
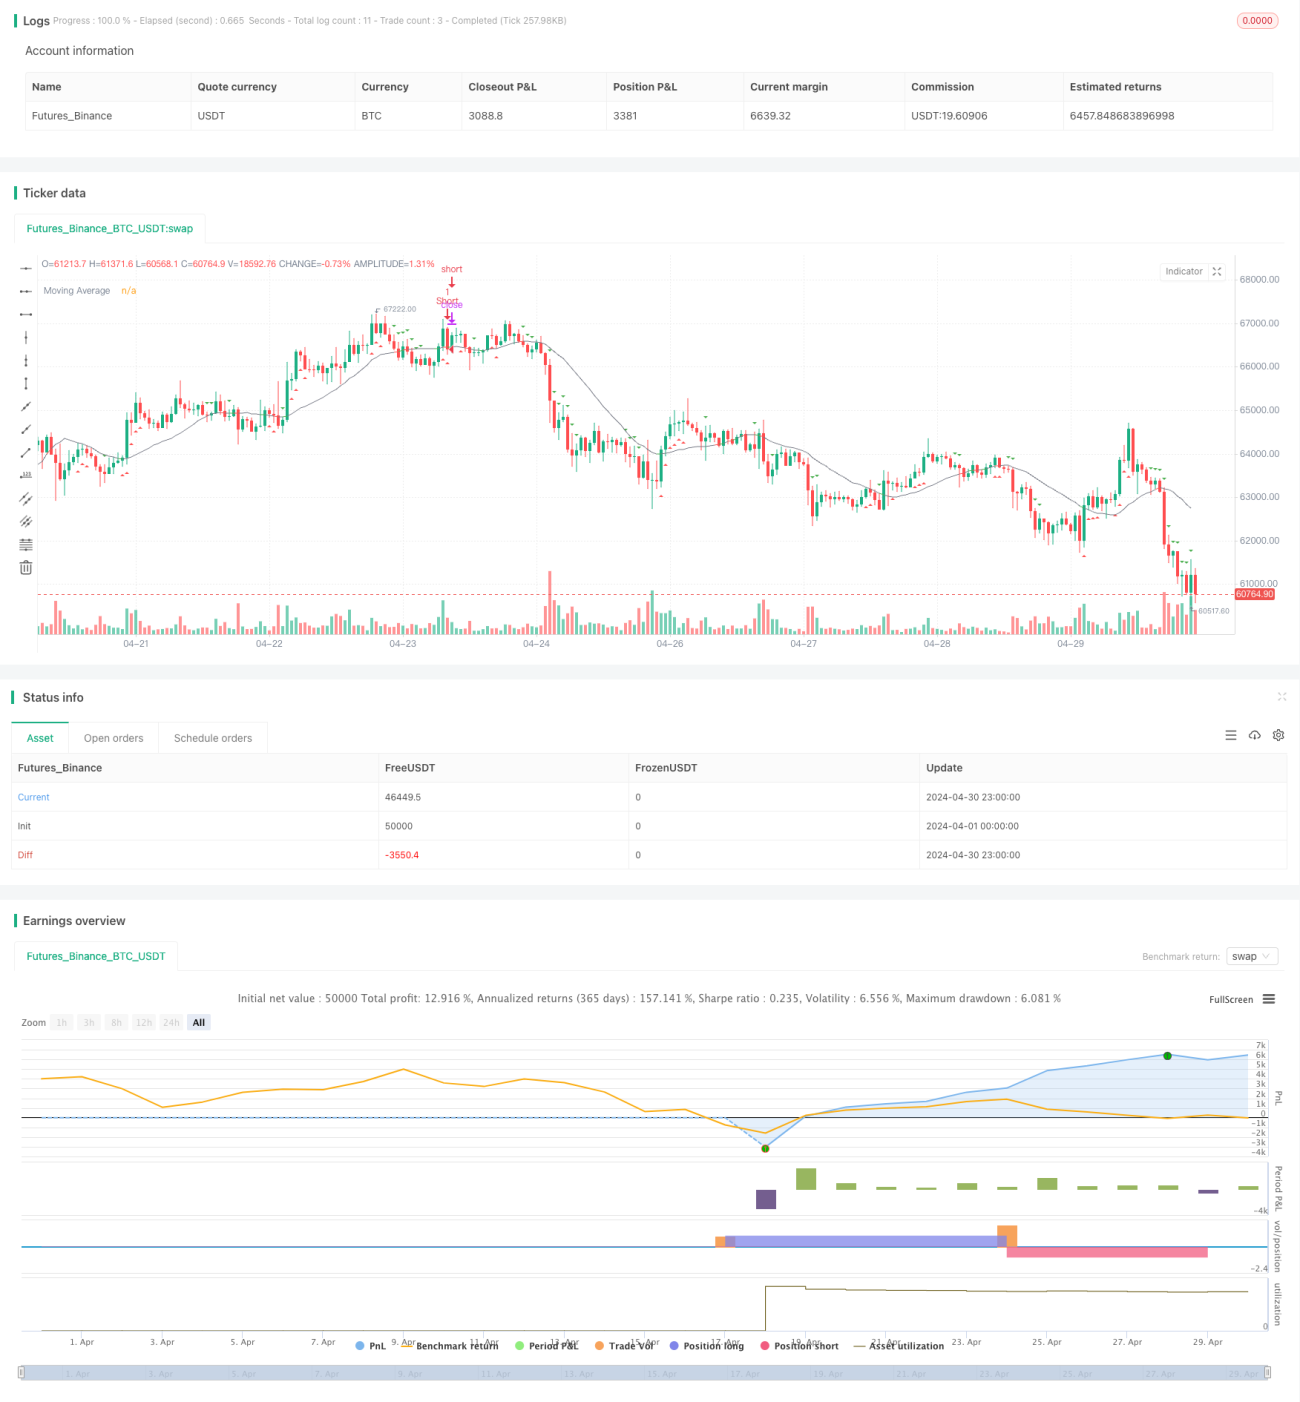
La estrategia utiliza el indicador KDJ y el promedio móvil ((MA) para identificar la tendencia del mercado y generar señales de negociación. La estrategia genera una señal de cierre cuando el indicador KDJ supera la zona de sobreventa y el precio cae por debajo de la MA. La estrategia genera una señal de cierre cuando el indicador KDJ está por debajo de la zona de sobreventa y el precio rompe la MA.
Principio de estrategia
- Calcula los valores K, D y J del indicador KDJ, donde K es el promedio móvil de N días de RSV, D es el promedio móvil de M días de K, y J se obtiene de la fórmula "3K-2D" es el resultado.
- Calcula el promedio móvil MA para determinar la tendencia actual de los precios.
- Para determinar la dirección de la MA, se usa como una señal positiva, y se usa como una señal negativa.
- Cuando el valor de J de KDJ es mayor que el nivel de sobreventa y el precio pasa por MA, se genera una señal de corto plazo; cuando el valor de J es menor que el nivel de sobreventa y el precio pasa por MA, se genera una señal de más.
- Posiciones de varios o vacíos de cabeza abiertas según la señal de un número fijo de manos ((1 mano)).
Análisis de las ventajas
- Al mismo tiempo, se tiene en cuenta el estado de sobrecompra y sobreventa de los precios y la dirección de la tendencia, para tener una mejor comprensión de la tendencia.
- El uso de MA como confirmación de tendencia puede filtrar eficazmente las señales falsas del indicador KDJ en situaciones de convulsión.
- Se ha añadido un umbral ajustable de sobrecompra y sobreventa, lo que aumenta la flexibilidad de la estrategia.
- El color de la media móvil cambia según la dirección de la tendencia, proporcionando un juicio intuitivo de la tendencia.
- Graficar las señales de negociación en un gráfico para observar y analizar el rendimiento de la estrategia.
Análisis de riesgos
- Los indicadores KDJ son más sensibles a los parámetros, y los resultados pueden variar mucho según los diferentes parámetros, lo que requiere una optimización para los diferentes parámetros y períodos.
- En una situación de crisis, la estrategia puede generar más señales falsas y causar pérdidas, incluso con una MA como confirmación de tendencia.
- El tamaño de las posiciones fijas no tiene en cuenta la gestión de riesgos, y puede asumir un mayor riesgo en momentos de gran volatilidad en el mercado.
- Las estrategias que carecen de mecanismos de stop loss y de suspensión pueden perder oportunidades de ganancias o aumentar las pérdidas.
Dirección de optimización
- Optimización de los parámetros del indicador KDJ para encontrar la combinación óptima de parámetros para el indicador actual y el ciclo.
- La introducción de más indicadores técnicos como RSI, MACD, etc., enriquece el juicio de tendencias y las condiciones de filtración de la señal, mejorando la calidad de la señal.
- Optimizar la gestión de posiciones, ajustar el tamaño de las posiciones en función de la volatilidad del mercado o el valor neto de la cuenta, y controlar el riesgo.
- La adición de una lógica de stop loss y stop-loss para cerrar las posiciones cuando se alcanzan las condiciones predeterminadas para reducir las pérdidas individuales y bloquear las ganancias.
- La estrategia se evalúa y optimiza para encontrar la mejor combinación de parámetros y la adaptabilidad al mercado.
Resumir
La estrategia, a través de la combinación de los indicadores de KDJ y las medias móviles, puede capturar mejor las tendencias del mercado y generar señales de negociación. El uso racional de la información de sobreventa y sobreventa y la dirección de la tendencia puede obtener un buen rendimiento de las operaciones. Sin embargo, la estrategia aún tiene espacio para optimización, como la introducción de más condiciones de filtración, gestión dinámica de posiciones y paradas de pérdidas, etc., para mejorar aún más la solidez y la rentabilidad de la estrategia.
- 1