Estrategias de compra y venta basadas en mapas de calor de volumen y precios en tiempo real

Descripción general
La estrategia combina un gráfico de volumen de transacciones y precios en tiempo real para generar una señal de compra y venta mediante el análisis de los precios y la distribución del volumen de transacciones en un período de tiempo determinado. La estrategia primero calcula varios niveles de precios en función del precio actual y el porcentaje del rango de precios establecido.
Principio de estrategia
- Se calculan varios niveles de precios basados en el precio actual y el porcentaje del rango de precios establecido.
- Calcular el volumen de transacciones de compra y venta en cada nivel de precios durante el período anterior y calcular el volumen de transacciones de compra y venta acumulado.
- Determine el color de las etiquetas y muestre las etiquetas o dibuje un gráfico de acuerdo con el volumen de transacciones acumuladas.
- Trazar una curva de precios en tiempo real.
- Calcular los indicadores como el EMA, el VWAP y otros.
- En función de la relación entre el precio y los indicadores como EMA, VWAP y las condiciones de volumen de transacción, se determina si se cumplen las condiciones de compra. Si se cumple y no se ha generado una señal antes, se genera una señal de compra.
- En función de la relación entre el precio y los indicadores como la EMA y las condiciones de volumen de transacción, se determina si se cumplen las condiciones de venta. Si se cumple y no se ha producido una señal antes, se produce una señal de venta. Si hay dos líneas negativas consecutivas y no se ha producido una señal antes, también se produce una señal de venta.
- Registra el estado actual de las condiciones de compra y venta y actualiza el estado de la generación de señales.
Análisis de las ventajas
- La combinación de gráficos de volumen de transacciones y precios en tiempo real permite mostrar de forma intuitiva la distribución de precios y volúmenes de transacciones, lo que proporciona una referencia para las decisiones comerciales.
- La introducción de indicadores como EMA, VWAP, enriquece el criterio de la estrategia y mejora la fiabilidad de la misma.
- Al mismo tiempo, se tienen en cuenta factores como el precio, los indicadores y el volumen de transacciones, lo que hace que la señal de compra y venta sea más completa y sólida.
- Se establecen las condiciones de restricción de la generación de señales, evitando la generación de señales repetitivas y reduciendo las señales engañosas.
Análisis de riesgos
- El rendimiento de la estrategia puede verse afectado por la configuración de parámetros como el porcentaje de rango de precios, el período de retroceso, etc., que requieren ajustes y optimizaciones según las circunstancias específicas.
- Indicadores como el EMA, VWAP y otros también tienen ciertos retrasos y limitaciones, que pueden no ser válidos en ciertas circunstancias del mercado.
- La estrategia se aplica principalmente a los mercados con una fuerte tendencia, donde las señales falsas son más probables en los mercados convulsivos.
- Las medidas de control de riesgo de la estrategia son relativamente simples y carecen de medios de gestión de riesgo como el stop loss y la gestión de posiciones.
Dirección de optimización
- La introducción de más indicadores técnicos y de sentimiento en el mercado, como el RSI, el MACD y el Brin, enriquece la base de juicio estratégico.
- Optimizar las condiciones de generación de las señales de compra y venta, mejorar la precisión y la fiabilidad de las señales. Se puede considerar la introducción de análisis de varios marcos de tiempo para confirmar la dirección de la tendencia.
- Incorporar medidas de control de riesgo como el control de pérdidas y posiciones, establecer límites razonables de pérdidas y posiciones, y controlar el umbral de riesgo de las operaciones individuales.
- Optimización de parámetros y retroalimentación de la estrategia para encontrar la combinación óptima de parámetros y el alcance de la aplicación en el mercado.
- Considerar la combinación de esta estrategia con otras estrategias para aprovechar las ventajas de las diferentes estrategias y mejorar la estabilidad y rentabilidad en general.
Resumir
La estrategia de la combinación de gráficos de volumen de transacciones, precios en tiempo real y varios indicadores técnicos para generar señales de compra y venta, con un cierto valor de referencia. La ventaja de la estrategia es que puede mostrar visualmente la distribución de precios y volúmenes de transacciones, y la generación de señales de la consideración integral de varios factores. Pero la estrategia también tiene algunas limitaciones y riesgos, como el impacto de la configuración de parámetros, el atraso de los indicadores, la dependencia de mercados de tendencias, etc. Por lo tanto, en la aplicación práctica, es necesario optimizar y perfeccionar la estrategia, como la introducción de más indicadores, la optimización de las condiciones de la señal, el fortalecimiento del control de riesgos, etc., para mejorar la estabilidad de la estrategia y la rentabilidad.
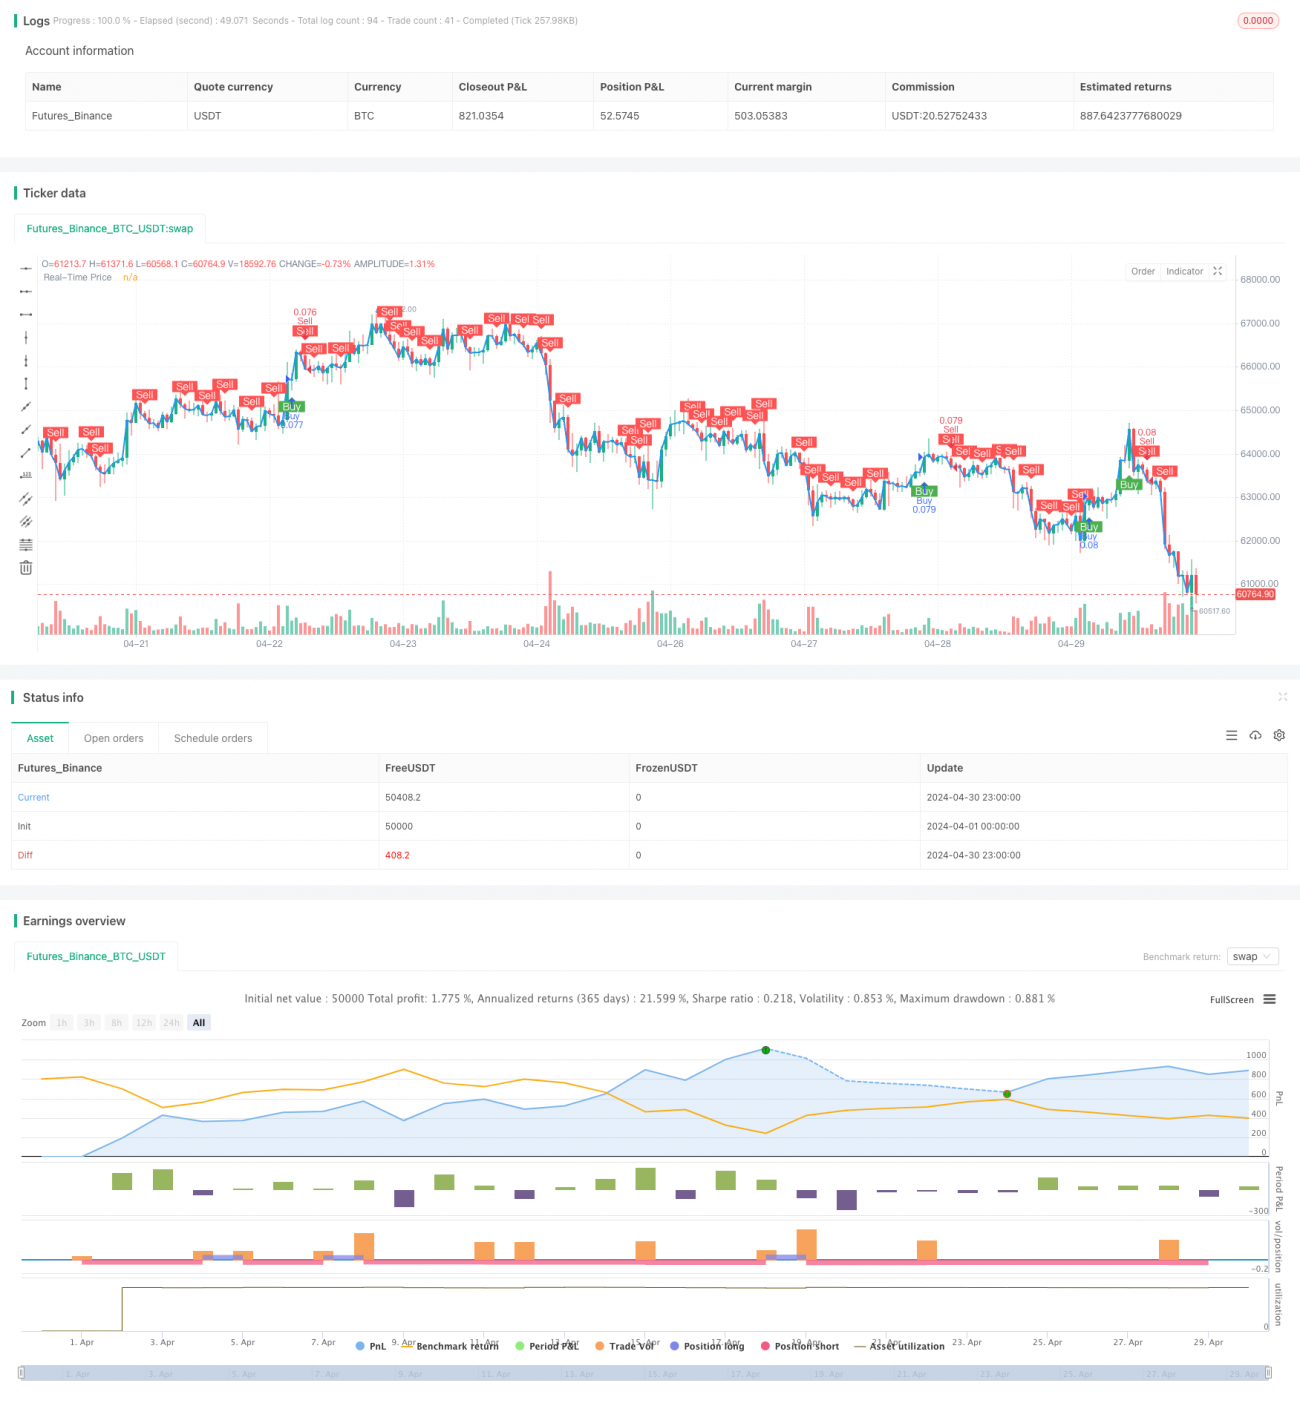
/*backtest
start: 2024-04-01 00:00:00
end: 2024-04-30 23:59:59
period: 1h
basePeriod: 15m
exchanges: [{"eid":"Futures_Binance","currency":"BTC_USDT"}]
*/

//@version=5
strategy("Buy and Sell Volume Heatmap with Real-Time Price Strategy", overlay=true, default_qty_type=strategy.percent_of_equity, default_qty_value=10)

// Settings for Volume Heatmap- 1