
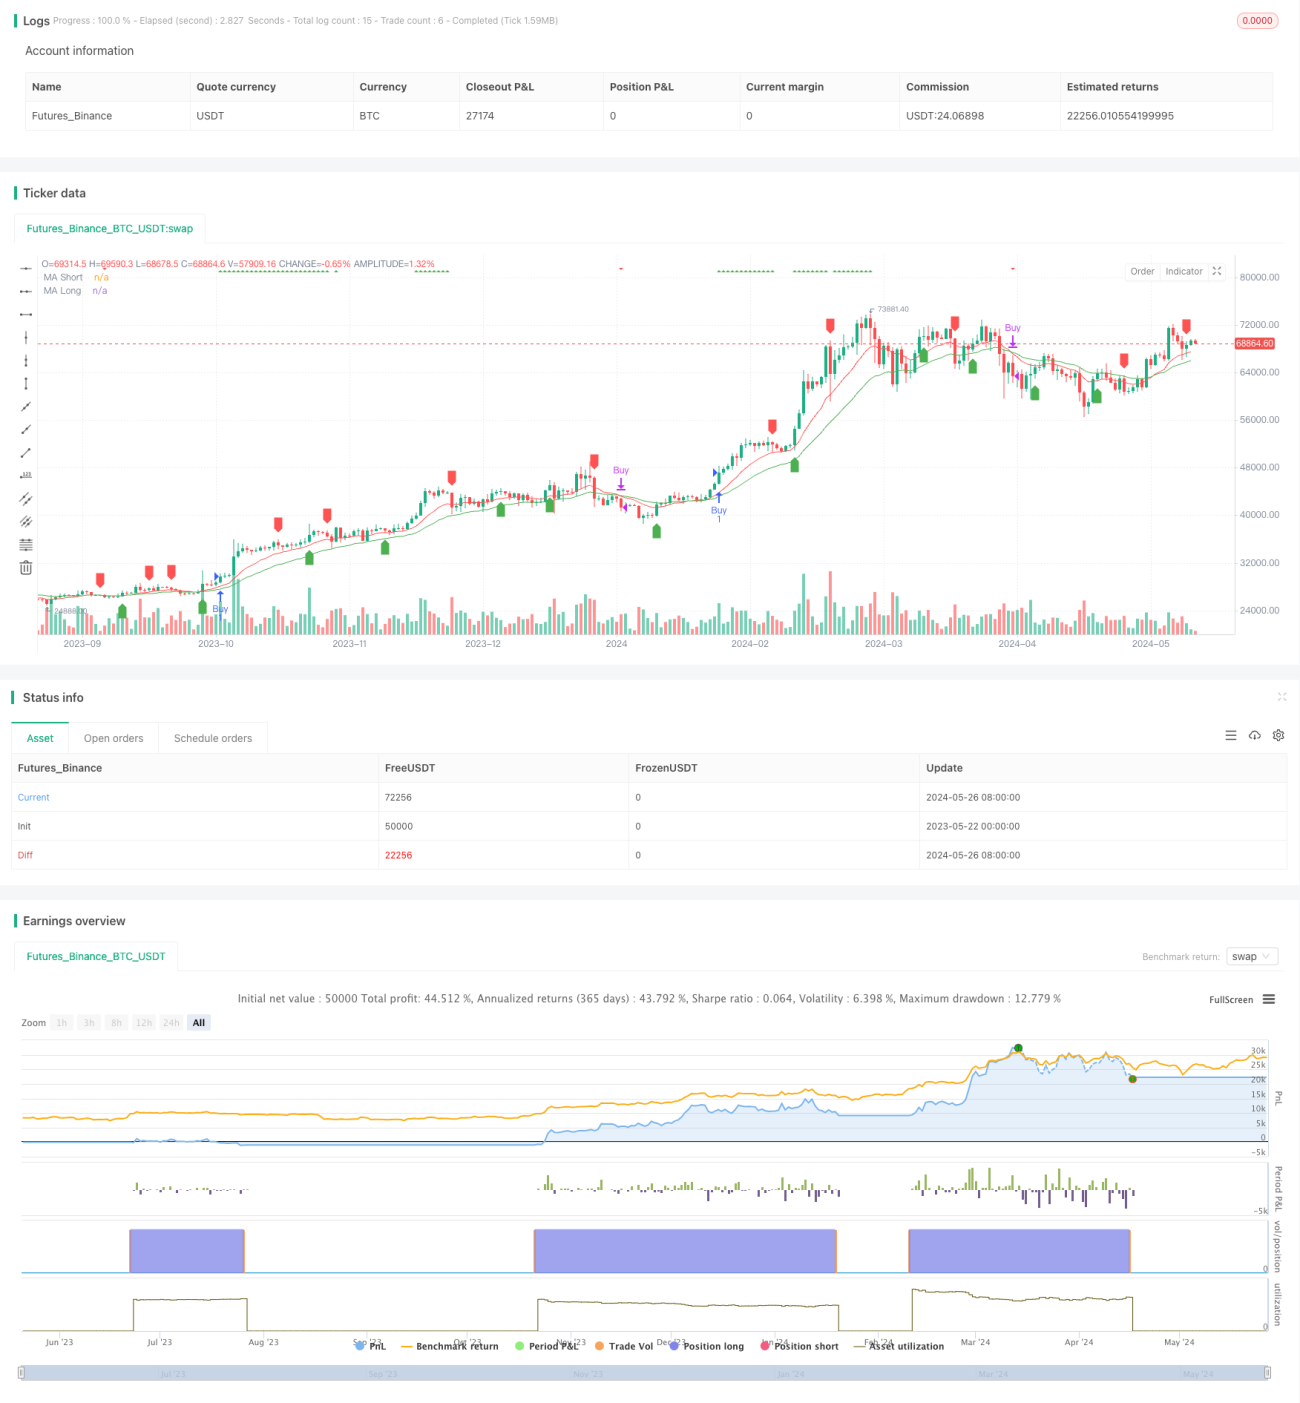
Descripción general
La estrategia combina el indicador RSI con el promedio móvil ((MA) para generar señales de negociación. El RSI se usa para determinar si el mercado está sobrecomprado o sobrevendido, y el MA se usa para determinar la tendencia de los precios. Se produce una señal de compra cuando el RSI está sobrecomprado y el precio es superior al MA; se produce una señal de venta cuando el RSI está sobrevendido o el MA produce un punto muerto.
Principio de estrategia
- Calcule el valor del indicador RSI para determinar si el mercado está sobrecomprado (<70) o sobrevendido (<30).
- Calcule el MA de un ciclo personalizado, que incluye los cuatro tipos de EMA, SMA, HMA y WMA, y decida si se muestra en el gráfico según la configuración de los parámetros.
- Cuando el RSI está sobrecomprado y el precio de cierre es superior al MA, genera una señal de compra; cuando el RSI está sobrevendido o el MA produce un tenedor, genera una señal de venta.
- Introducir el indicador StochRSI como un criterio auxiliar, el StochRSI marca una señal en el gráfico cuando se sobrecompra (<70) o se sobreventa (<30), pero no genera una señal de negociación real.
Ventajas estratégicas
- La combinación orgánica de los dos indicadores clásicos RSI y MA permite capturar mejor las tendencias y los momentos de sobrecompra y sobreventa.
- El tipo y los parámetros de MA se pueden configurar libremente, con una gran flexibilidad, y se pueden ajustar según las diferentes características del mercado.
- La introducción del indicador StochRSI como un criterio auxiliar para dar más referencia a las decisiones de negociación.
- La lógica del código es clara, legible y fácil de entender y reutilizar.
Riesgo estratégico
- El RSI y el MA son indicadores de retraso y pueden generar más señales engañosas durante el inicio de la reversión de tendencia.
- La configuración incorrecta de los parámetros puede causar señales demasiado tempranas o demasiado tardías, lo que afecta a la ganancia general.
- La falta de gestión de los paros y posiciones puede suponer un riesgo mayor en momentos de gran volatilidad.
Dirección de optimización de la estrategia
- Introducir más indicadores de vanguardia, como la volatilidad, para juzgar el cambio de tendencia con anticipación.
- Se filtran las señales de compra y venta para generar señales que requieren que RSI y MA cumplan ciertas condiciones al mismo tiempo para mejorar la precisión de la señal.
- Incorpora un módulo de gestión de pérdidas y posiciones en la estrategia para controlar el riesgo de una sola operación y el riesgo general.
- Optimización de los parámetros de la estrategia para encontrar la combinación óptima de parámetros.
- Considerar la inclusión de diferentes ciclos o variedades, aprovechando al máximo la relación entre los diferentes ciclos o variedades.
Resumir
La estrategia, mediante la combinación de los dos indicadores clásicos RSI y MA, es capaz de capturar la tendencia y el momento de la sobreventa, mientras que la introducción del indicador StochRSI como un juicio auxiliar, la idea general es simple y clara. Sin embargo, la estrategia también tiene algunas deficiencias, como la falta de medidas de control de riesgo, la precisión de la señal debe mejorar, etc. En el futuro, la estrategia puede perfeccionarse mediante la introducción de más indicadores, la optimización de las reglas de la señal, la adición de un módulo de control de riesgo, etc., con el objetivo de obtener ganancias más sólidas.
- 1