Estrategia de optimización del mecanismo de mercado de posiciones largas y cortas basada en volatilidad y línea de regresión

Descripción general
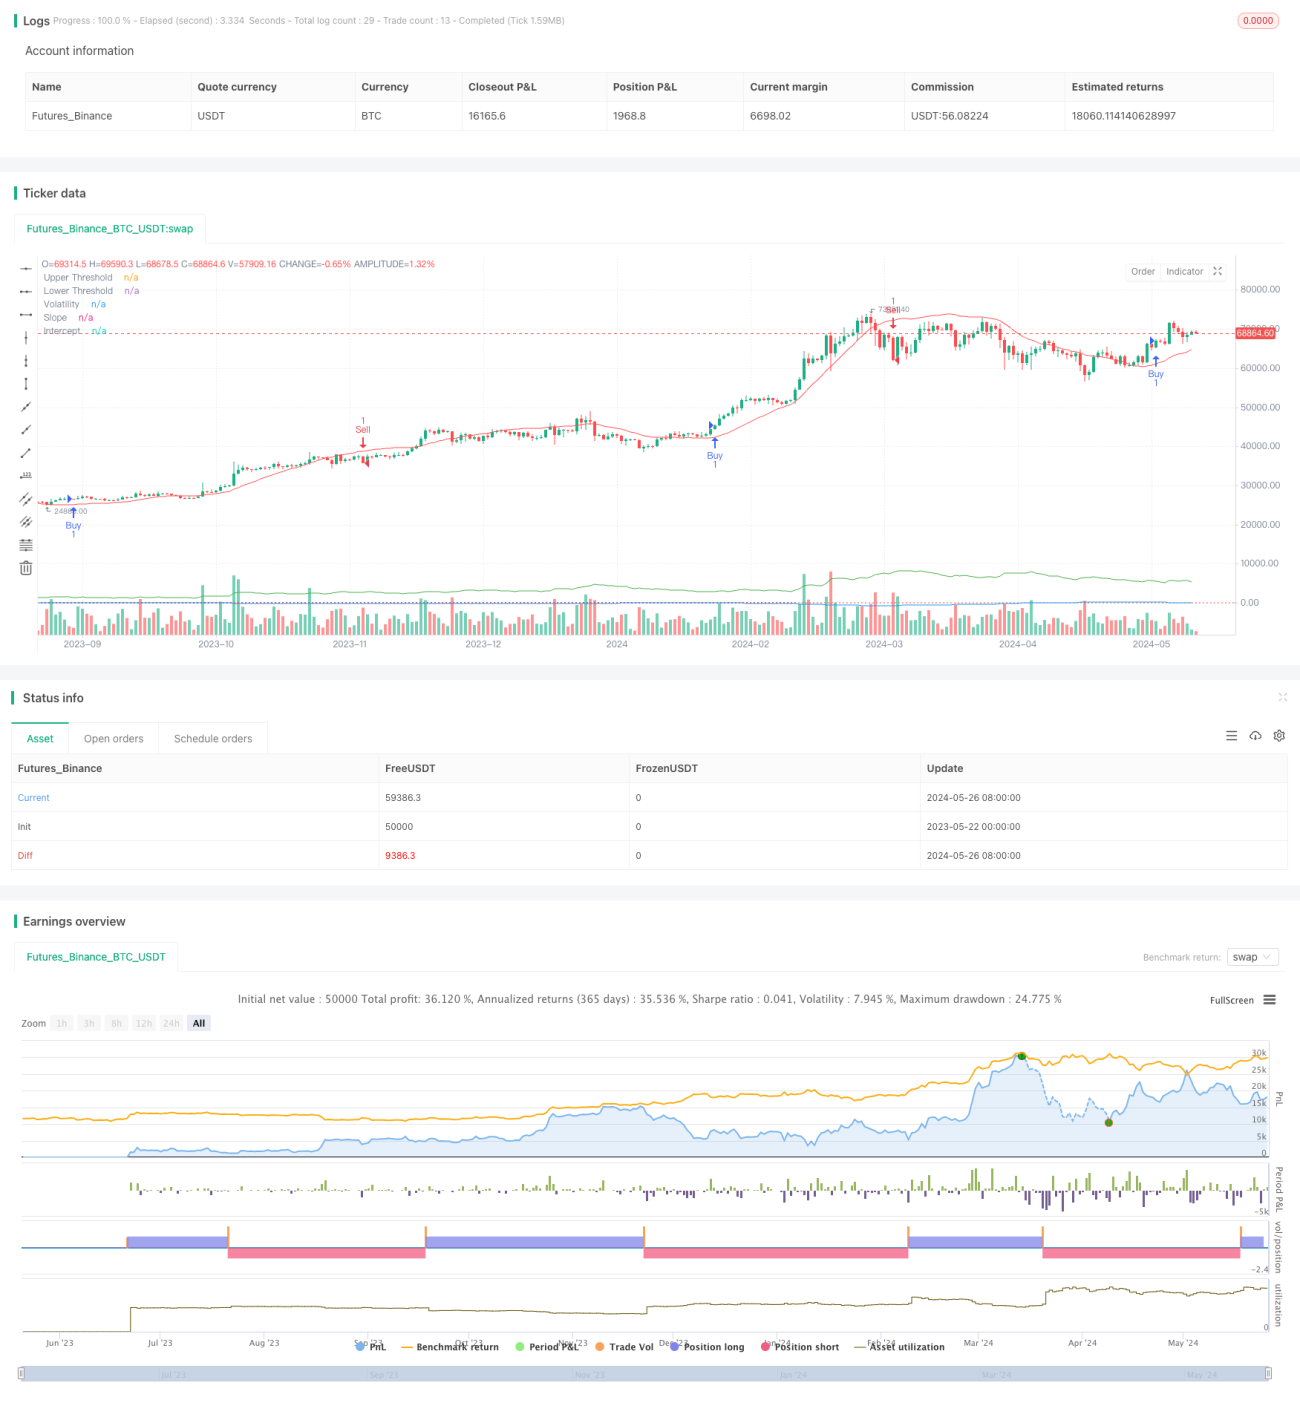
La estrategia utiliza la regresión lineal y el índice de volatilidad para identificar diferentes estados de mercado, y cuando se cumplen las condiciones de compra o venta, la estrategia establece posiciones de más o menos cabeza correspondientes. Al mismo tiempo, la estrategia permite optimizar y ajustar los parámetros según las condiciones del mercado para adaptarse a diferentes entornos de mercado. La estrategia también utiliza las medias móviles del índice como indicadores adicionales para confirmar las señales de negociación.
Principio de estrategia
- Cálculo de la intersección y la pendiente de la regresión lineal para determinar la tendencia del mercado.
- Calcule la tasa de fluctuación real promedio (ATR) multiplicada por el multiplicador como indicador de la tasa de fluctuación.
- Cuando la inclinación es mayor que el alza y el precio es más alto que la línea de retorno más la volatilidad, se genera una señal de compra.
- Una señal de venta se genera cuando la pendiente es menor que la baja y el precio es menor que la línea de retorno menos la volatilidad.
- Utiliza las medias móviles de índices rápidos y lentos (EMA) como indicadores de confirmación adicionales.
- Cuando aparezca una señal de compra y el EMA rápido sea mayor que el EMA lento, establezca una posición de más de una cabeza.
- Cuando aparezca una señal de venta y el EMA rápido sea menor que el EMA lento, establezca una posición en blanco.
Ventajas estratégicas
- La combinación de la regresión lineal y el índice de volatilidad permite identificar con mayor precisión el estado y la tendencia del mercado.
- El uso de indicadores de EMA adicionales para confirmar las señales de negociación aumenta la fiabilidad de la estrategia.
- Permite optimizar los parámetros clave para adaptarse a diferentes entornos de mercado y características de la variedad.
- Al mismo tiempo, considera la tendencia y la volatilidad, puede tomar posiciones a tiempo cuando la tendencia es clara y controlar el riesgo cuando la volatilidad se agrava.
Riesgo estratégico
- La mala selección de los parámetros puede conducir a un mal desempeño de la estrategia, que necesita ser optimizada en función de las características específicas de la variedad y el mercado.
- En un mercado convulso o en un punto de cambio de tendencia, la estrategia puede generar frecuentes operaciones o señales erróneas.
- La estrategia depende de datos históricos y puede no reaccionar a tiempo ante eventos inesperados o fluctuaciones anormales en el mercado.
Dirección de optimización de la estrategia
- Introducción de otros indicadores técnicos o fundamentales para enriquecer la base de decisión de la estrategia y mejorar la precisión de la señal.
- Optimizar la selección de parámetros, como la longitud de la regresión, el multiplicador de la tasa de fluctuación, el ciclo EMA, etc., para adaptarse a las diferentes variedades y características del mercado.
- Incrementar los mecanismos de stop loss y de suspensión, controlar el riesgo de cada transacción y el nivel de retiro en general.
- Considere agregar reglas de administración de posiciones y administración de fondos, y ajuste el tamaño de las posiciones en función de las fluctuaciones del mercado y la equidad de la cuenta.
Resumir
La estrategia identifica el estado del mercado a través de la regresión lineal y el índice de volatilidad, y utiliza la EMA como indicador de confirmación, para construir una estrategia de negociación flexible y lógica clara. La estrategia tiene la ventaja de combinar tendencias y volatilidad, mientras que permite la optimización de los parámetros, para adaptarse a diferentes entornos del mercado.
- 1