Estrategia combinada de supertendencia y EMA

Descripción general
La estrategia de combinación de Supertrend y EMA es una estrategia de negociación que utiliza el indicador Supertrend en combinación con múltiples EMA. La estrategia utiliza el indicador Supertrend para determinar la dirección de la tendencia del mercado actual, mientras que el indicador EMA de diferentes períodos se utiliza como condición para la activación de la señal de compra y venta. Cuando el EMA a corto plazo se bifurca con el EMA a medio plazo y el indicador Supertrend muestra una tendencia alcista, se genera una señal de compra; cuando el EMA a corto plazo se bifurca con el EMA a medio plazo y el indicador Supertrend muestra una tendencia descendente, se genera una señal de venta.
Principio de estrategia
El principio central de la estrategia combinada de Supertrend y EMA es utilizar las características de los indicadores de Supertrend y EMA para capturar los cambios de tendencia y las fluctuaciones de los precios en el mercado. El indicador de Supertrend juzga la dirección de la tendencia en el mercado actual al comparar el precio de cierre actual con la trayectoria ascendente del ciclo anterior. Cuando el precio de cierre se rompe en la trayectoria ascendente, el mercado entra en una tendencia alcista; cuando el precio de cierre se rompe en la trayectoria descendente, el mercado entra en una tendencia descendente.
Ventajas estratégicas
- El indicador Supertrend capta de manera efectiva los cambios de tendencia en el mercado y ayuda a la estrategia a operar de acuerdo con las tendencias del mercado.
- Confirmación de múltiples EMA: el uso de diferentes indicadores de EMA de diferentes períodos como condiciones de activación de señales de compra y venta puede mejorar la fiabilidad de la señal y reducir la aparición de señales falsas.
- Control de riesgos: los indicadores de tendencias de Supertrend permiten evitar el comercio en condiciones adversas y reducir el riesgo.
- Adaptabilidad: La estrategia se puede aplicar a diferentes mercados y variedades, con una mejor adaptabilidad y flexibilidad.
Riesgo estratégico
- Riesgo de optimización de parámetros: La configuración de los parámetros de los indicadores Supertrend y EMA tiene un gran impacto en el rendimiento de la estrategia, y los parámetros inadecuados pueden causar la falla de la estrategia.
- Riesgo de fluctuación del mercado: en momentos de fuerte volatilidad del mercado, los EMA a corto plazo pueden cruzarse con frecuencia con los EMA a mediano plazo, lo que puede generar múltiples falsas señales para la estrategia.
- Riesgo de cambio de tendencia: cuando se produce un cambio de tendencia en el mercado, los indicadores de Supertrend pueden retrasarse, lo que lleva a la estrategia a perder en el inicio de la tendencia.
Dirección de optimización de la estrategia
- Optimización de parámetros: se encuentra la combinación óptima de parámetros para mejorar la estabilidad y la rentabilidad de la estrategia mediante la optimización de los multiplicadores de los indicadores de Supertrend y los ciclos de los indicadores EMA.
- Filtración de señales: después de que se produzca la señal de cruce de EMA, se puede combinar con otros indicadores técnicos (como RSI, MACD, etc.) para una segunda confirmación de la señal, lo que mejora la fiabilidad de la señal.
- Detener los pérdidas: Introducir un mecanismo razonable de detener las pérdidas, controlar el riesgo de las operaciones individuales y mejorar la relación riesgo-beneficio de la estrategia.
- Multivariedad y ciclo: aplicar esta estrategia a diferentes variedades y ciclos para reducir el riesgo global mediante la diversificación de las inversiones.
Resumir
La combinación de estrategias de Supertrend y EMA combina el indicador de Supertrend con múltiples indicadores de EMA para formar un sistema de comercio de seguimiento de tendencias completo. La estrategia utiliza el indicador de Supertrend para juzgar la tendencia del mercado y, al mismo tiempo, genera señales de compra y ventaja de tener una fuerte capacidad de seguimiento de tendencias, confirmación de señales confiables y adaptabilidad amplia. Sin embargo, la estrategia también enfrenta riesgos como optimización de parámetros, fluctuaciones en el mercado y reversión de tendencias.
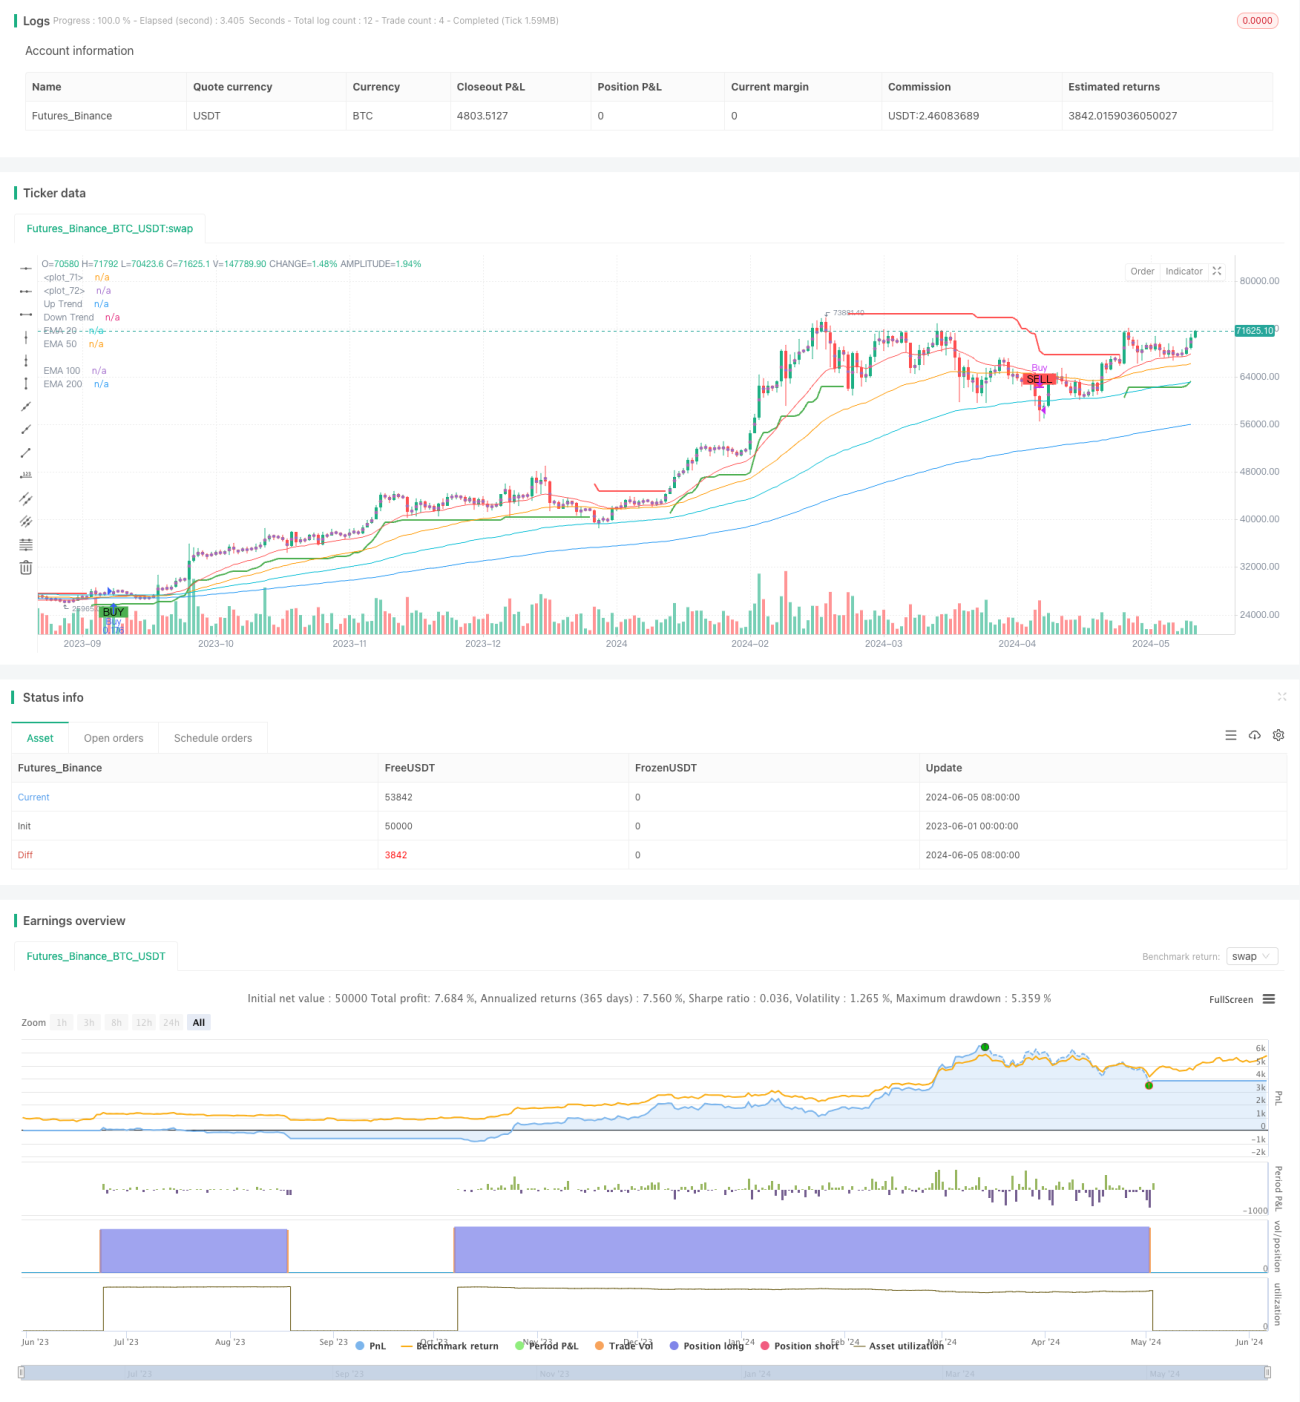
/*backtest
start: 2023-06-01 00:00:00
end: 2024-06-06 00:00:00
period: 1d
basePeriod: 1h
exchanges: [{"eid":"Futures_Binance","currency":"BTC_USDT"}]
*/

//@version=4
strategy("Supertrend EMA Strategy", overlay=true, default_qty_type=strategy.percent_of_equity, default_qty_value=10)

// Supertrend Parameters- 1