Estrategia de trading inteligente G Trend EMA ATR

Descripción general
Esta estrategia utiliza el indicador de canal G para identificar la dirección de la tendencia del mercado y, al mismo tiempo, combina los indicadores EMA y ATR para optimizar los puntos de entrada y salida. La idea principal de la estrategia es: cuando el precio rompe la trayectoria superior del canal G y hace más en la parte inferior del EMA, rompe la trayectoria inferior del canal G y hace vacío en la parte superior del EMA.
Principio de estrategia
- Calculación de la subida y bajada del canal G: la subida y bajada del canal G se calcula utilizando el precio de cierre actual y el precio más bajo del precio más alto anterior.
- Determinar la dirección de la tendencia: juzgar la tendencia de los vacíos observando la relación entre el precio y la subida y bajada del canal G.
- Cálculo de la EMA: Calcula el valor de la EMA del período especificado.
- Cálculo del ATR: Cálculo del ATR para el período especificado.
- Para determinar las condiciones de compra y venta, el precio se activa cuando el canal G se sale de la vía y se encuentra por debajo de la EMA. El precio se activa cuando el canal G se sale de la vía y se encuentra por encima de la EMA.
- Establezca el stop loss: el stop loss es el precio de apertura de la posición - 2 veces el ATR, el stop loss es el precio de apertura de la posición + 4 veces el ATR ((múltiples caras); el stop loss es el precio de apertura de la posición + 2 veces el ATR, el stop loss es el precio de apertura de la posición - 4 veces el ATR ((caras vacías)).
- Trigger de estrategia: ejecuta la operación de apertura de posición correspondiente cuando se cumplen las condiciones de compra y venta, y establece el correspondiente Stop Loss.
Ventajas estratégicas
- Seguimiento de tendencias: estrategias que utilizan el canal G para capturar las tendencias del mercado de manera efectiva y adecuada a las situaciones de tendencia.
- Detención de pérdidas dinámicas: Utiliza ATR para ajustar dinámicamente las paradas de pérdidas, para adaptarse mejor a la volatilidad del mercado.
- Control de riesgo: el Stop Loss está configurado en el doble de la ATR, controlando el riesgo de cada operación.
- Sencillo y fácil de usar: La lógica de la estrategia es clara y adecuada para la mayoría de los inversores.
Riesgo estratégico
- En un mercado convulso, las frecuentes señales de intercambio pueden aumentar las pérdidas.
- Optimización de parámetros: diferentes variedades y ciclos pueden requerir diferentes parámetros, y el uso a ciegas puede conllevar riesgos.
- En casos extremos, los precios pueden fluctuar mucho y el stop loss puede no ejecutarse.
Dirección de optimización de la estrategia
- Filtración de tendencias: Aumentar las condiciones de filtración de tendencias, como MA cruzado, DMI, etc., para reducir las operaciones en situaciones de crisis.
- Optimización de parámetros: Optimización de parámetros para diferentes variedades y ciclos para encontrar la combinación óptima de parámetros.
- Gestión de posiciones: ajustar las posiciones de acuerdo con la dinámica de la volatilidad del mercado para mejorar la utilización de los fondos.
- Estrategia combinada: combinación de esta estrategia con otras estrategias efectivas para mejorar la estabilidad.
Resumir
La estrategia utiliza el canal G, EMA, ATR y otros indicadores para construir un sistema de comercio de seguimiento de tendencias simple y eficaz. Puede obtener buenos resultados en situaciones de tendencia, pero suele funcionar en situaciones de crisis. Posteriormente, la estrategia se puede optimizar en términos de filtración de tendencias, optimización de parámetros, administración de posiciones y combinación de estrategias, para mejorar aún más la solidez y la rentabilidad de la estrategia.
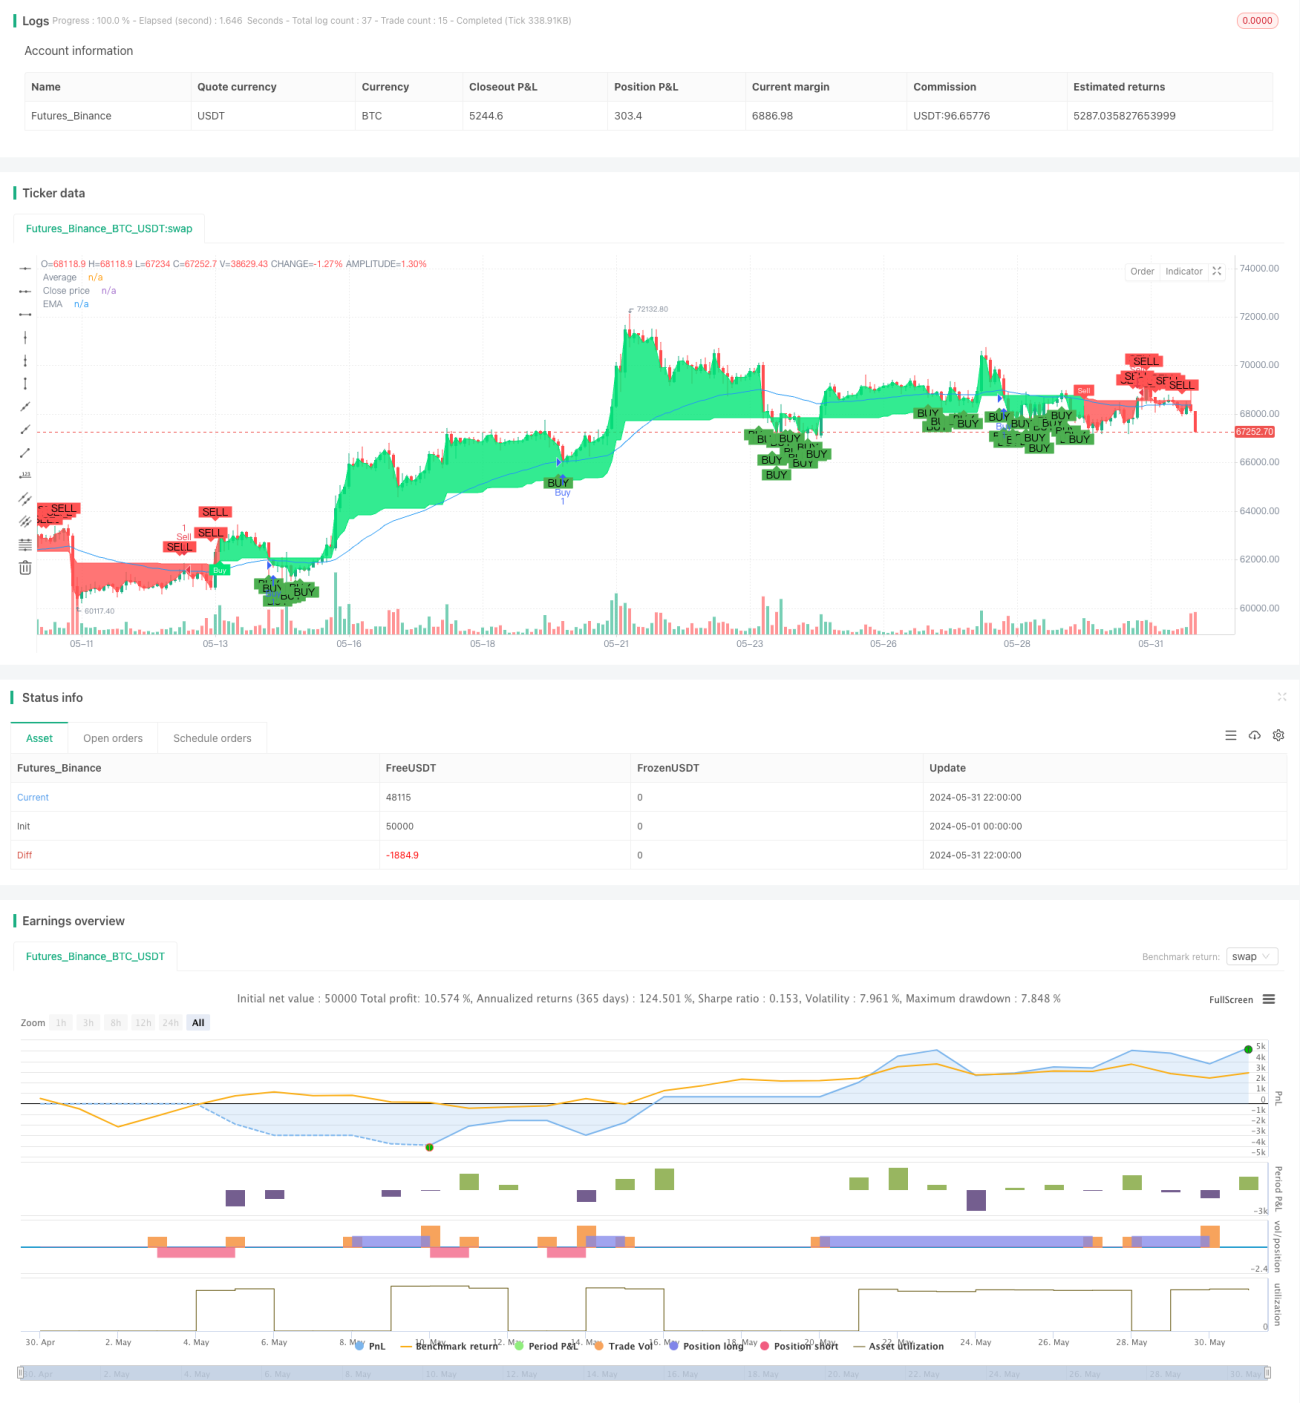
/*backtest
start: 2024-05-01 00:00:00
end: 2024-05-31 23:59:59
period: 2h
basePeriod: 15m
exchanges: [{"eid":"Futures_Binance","currency":"BTC_USDT"}]
*/

//@version=4
// Full credit to AlexGrover: https://www.tradingview.com/script/fIvlS64B-G-Channels-Efficient-Calculation-Of-Upper-Lower-Extremities/
strategy ("G-Channel Trend Detection with EMA Strategy and ATR", shorttitle="G-Trend EMA ATR Strategy", overlay=true)
- 1